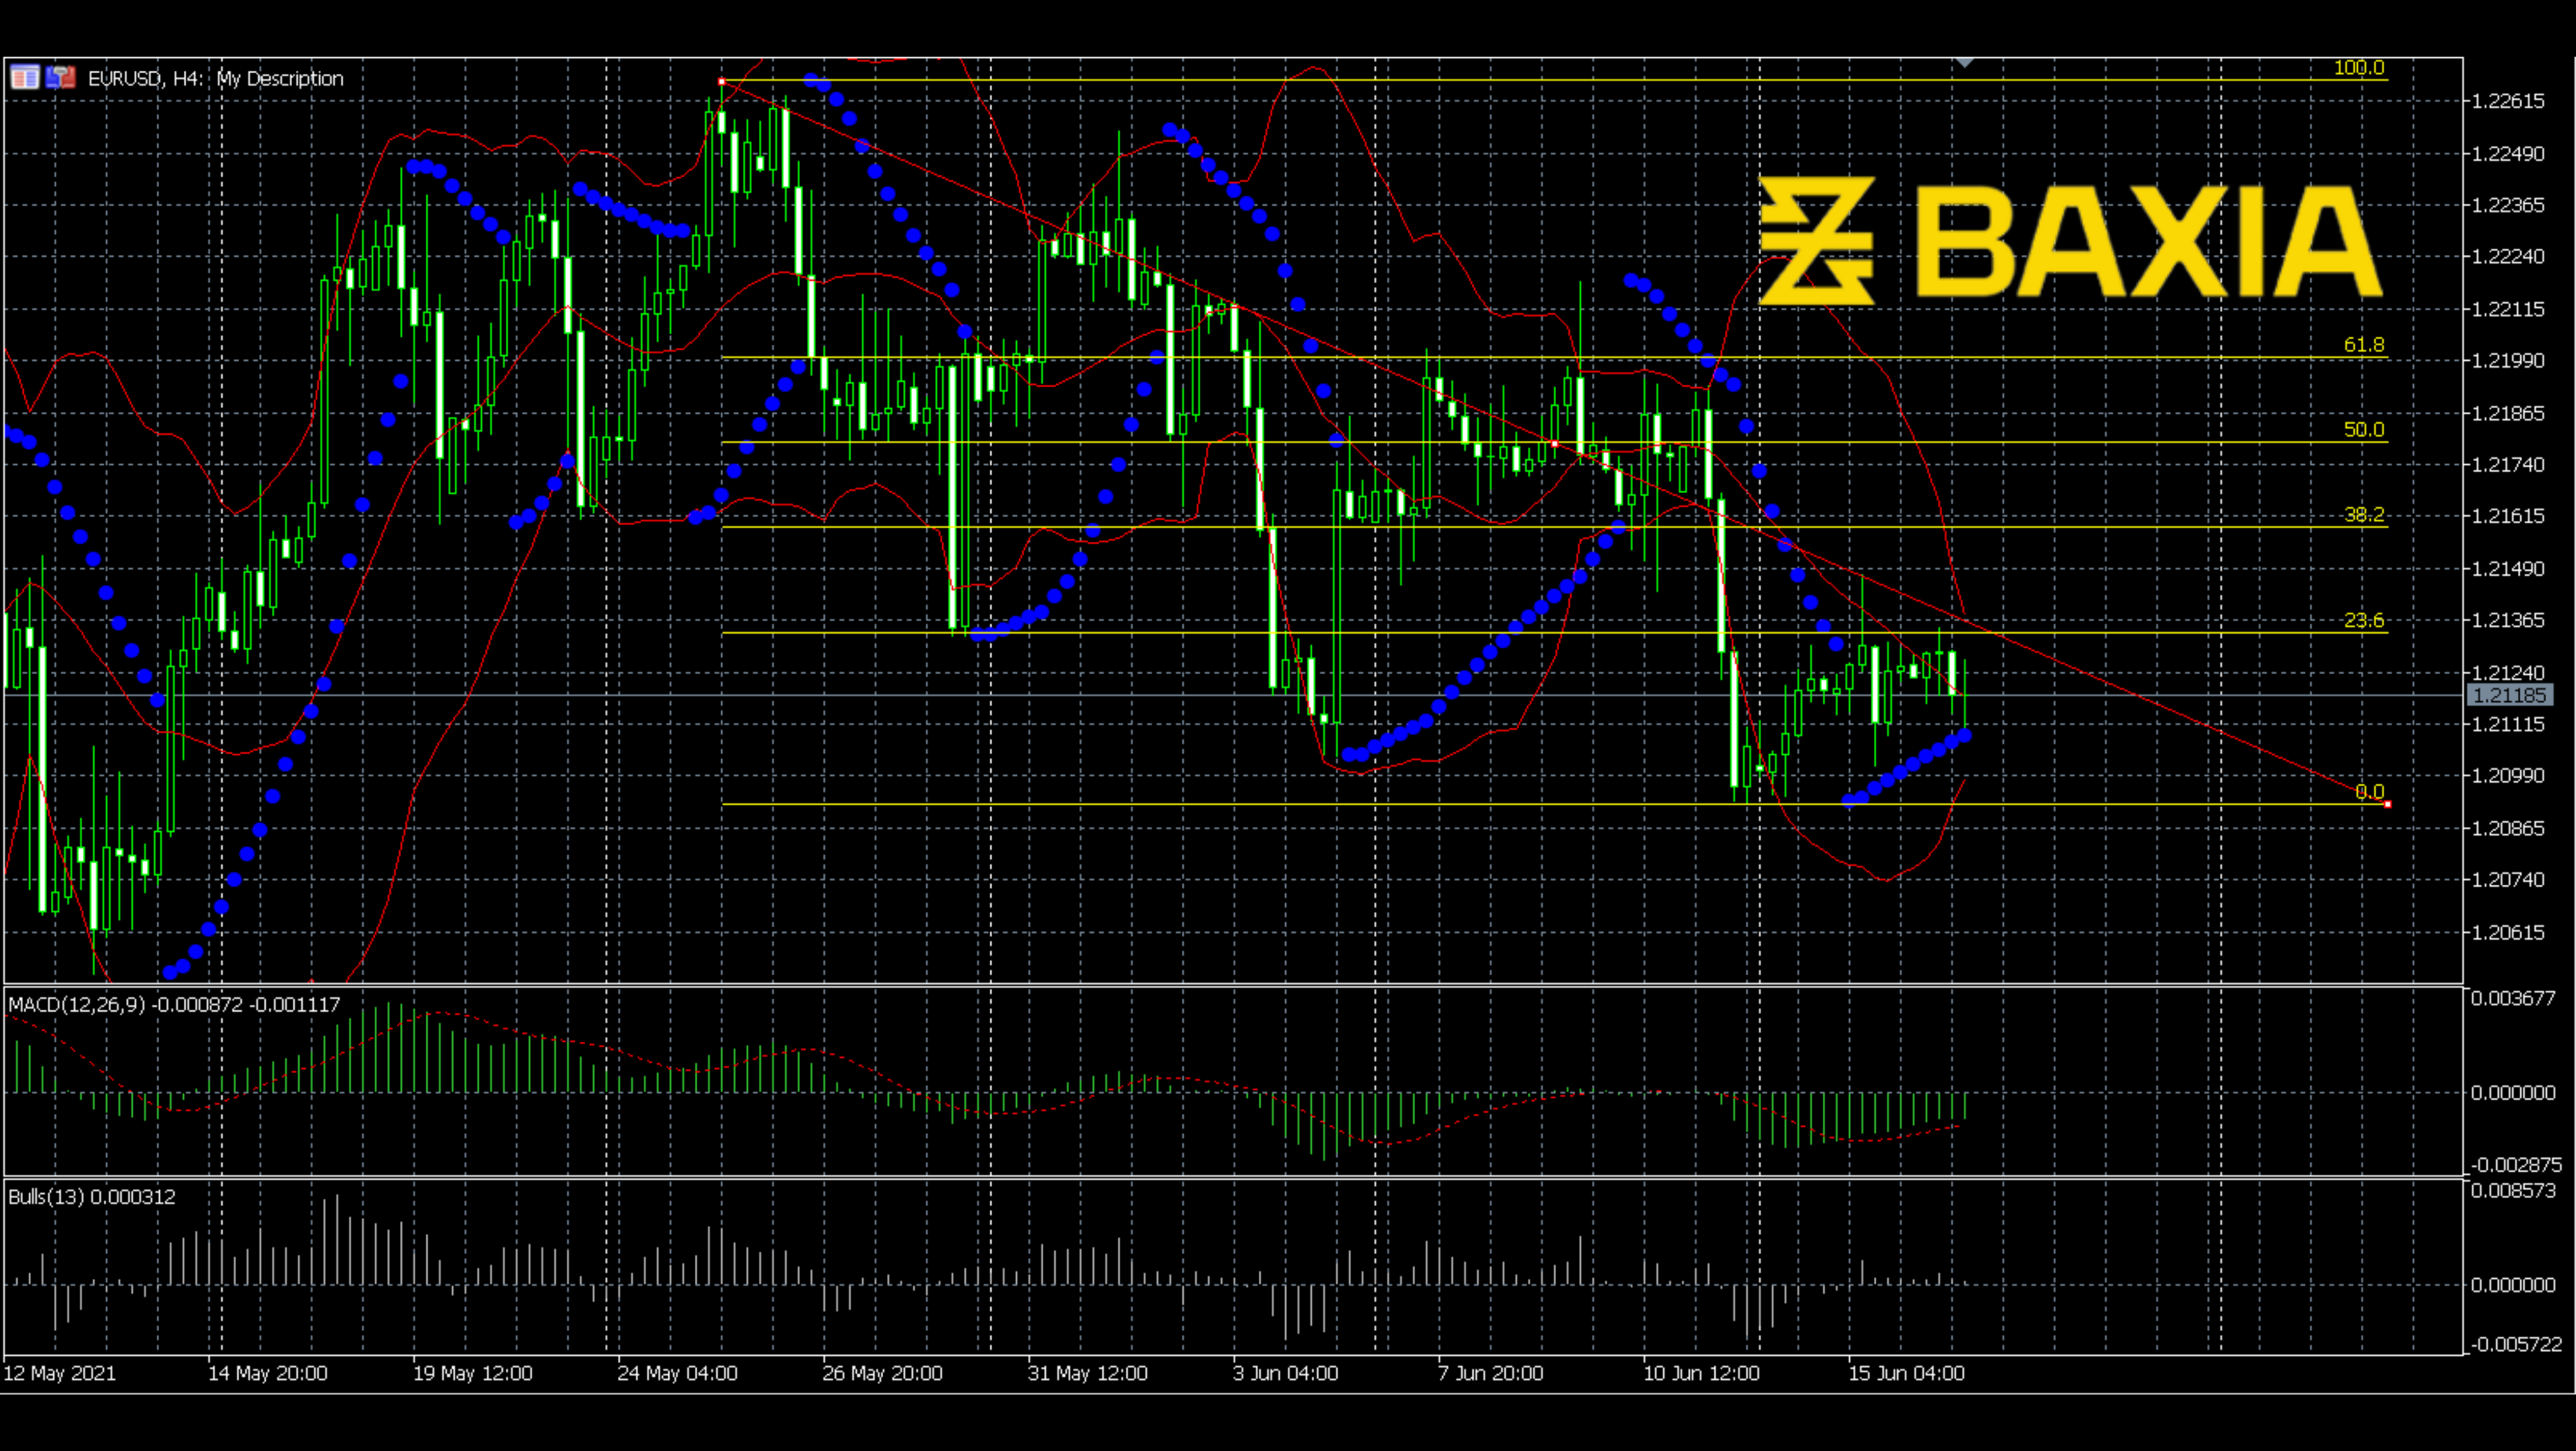

From this Heikin-Ashi candle 4-hour chart, we can see that the price had been through a long downward trend, which had lasted for almost one month. This is a comparatively steady and long trend, there was neither a steeper angle nor a crazy jump, however, it is slowing down. As can be seen, recently, the price started to fluctuate and hover around 1.207 and stopped going down.
.png?width=4920&name=Graph%20Template%20(48).png)
The Fibonacci retracement is built based on the last downward period. From the Fibonacci lines, we can see that the price is touching the 23.6% Fibonacci level, a potential resistance level. We should pay attention that it may not be able to go higher. Also, the MFI has been at a high level for a while, since the price started to fluctuate. This could mean that this is the highest the price can go for now, there is no bullish strength to push it higher.
We love to hear new ideas from traders and want to know what you think!
If you like this topic and want to suggest future topics that you find helpful, let us know by clicking the ‘submit your feedback’ button below.

Trading foreign exchange on margin carries a high level of risk, and may not be suitable for all investors. Before deciding to trade foreign exchange you should carefully consider your investment objectives, level of experience, and risk appetite.
Nothing contained in this website should be construed as investment advice. Any reference to an investment's past or potential performance is not, and should not be construed as, a recommendation or as a guarantee of any specific outcome or profit.