
The price of USDCHF has been rising since Aug 4th. The upward trend has lasted for five days; not long enough, but still not a short movement. The slope of the trend was sharp at the beginning; then it went mild. The price has made an arch in these five days. Usually when a price line goes mild, we would consider it as resistance. So, does the price meet resistance here?
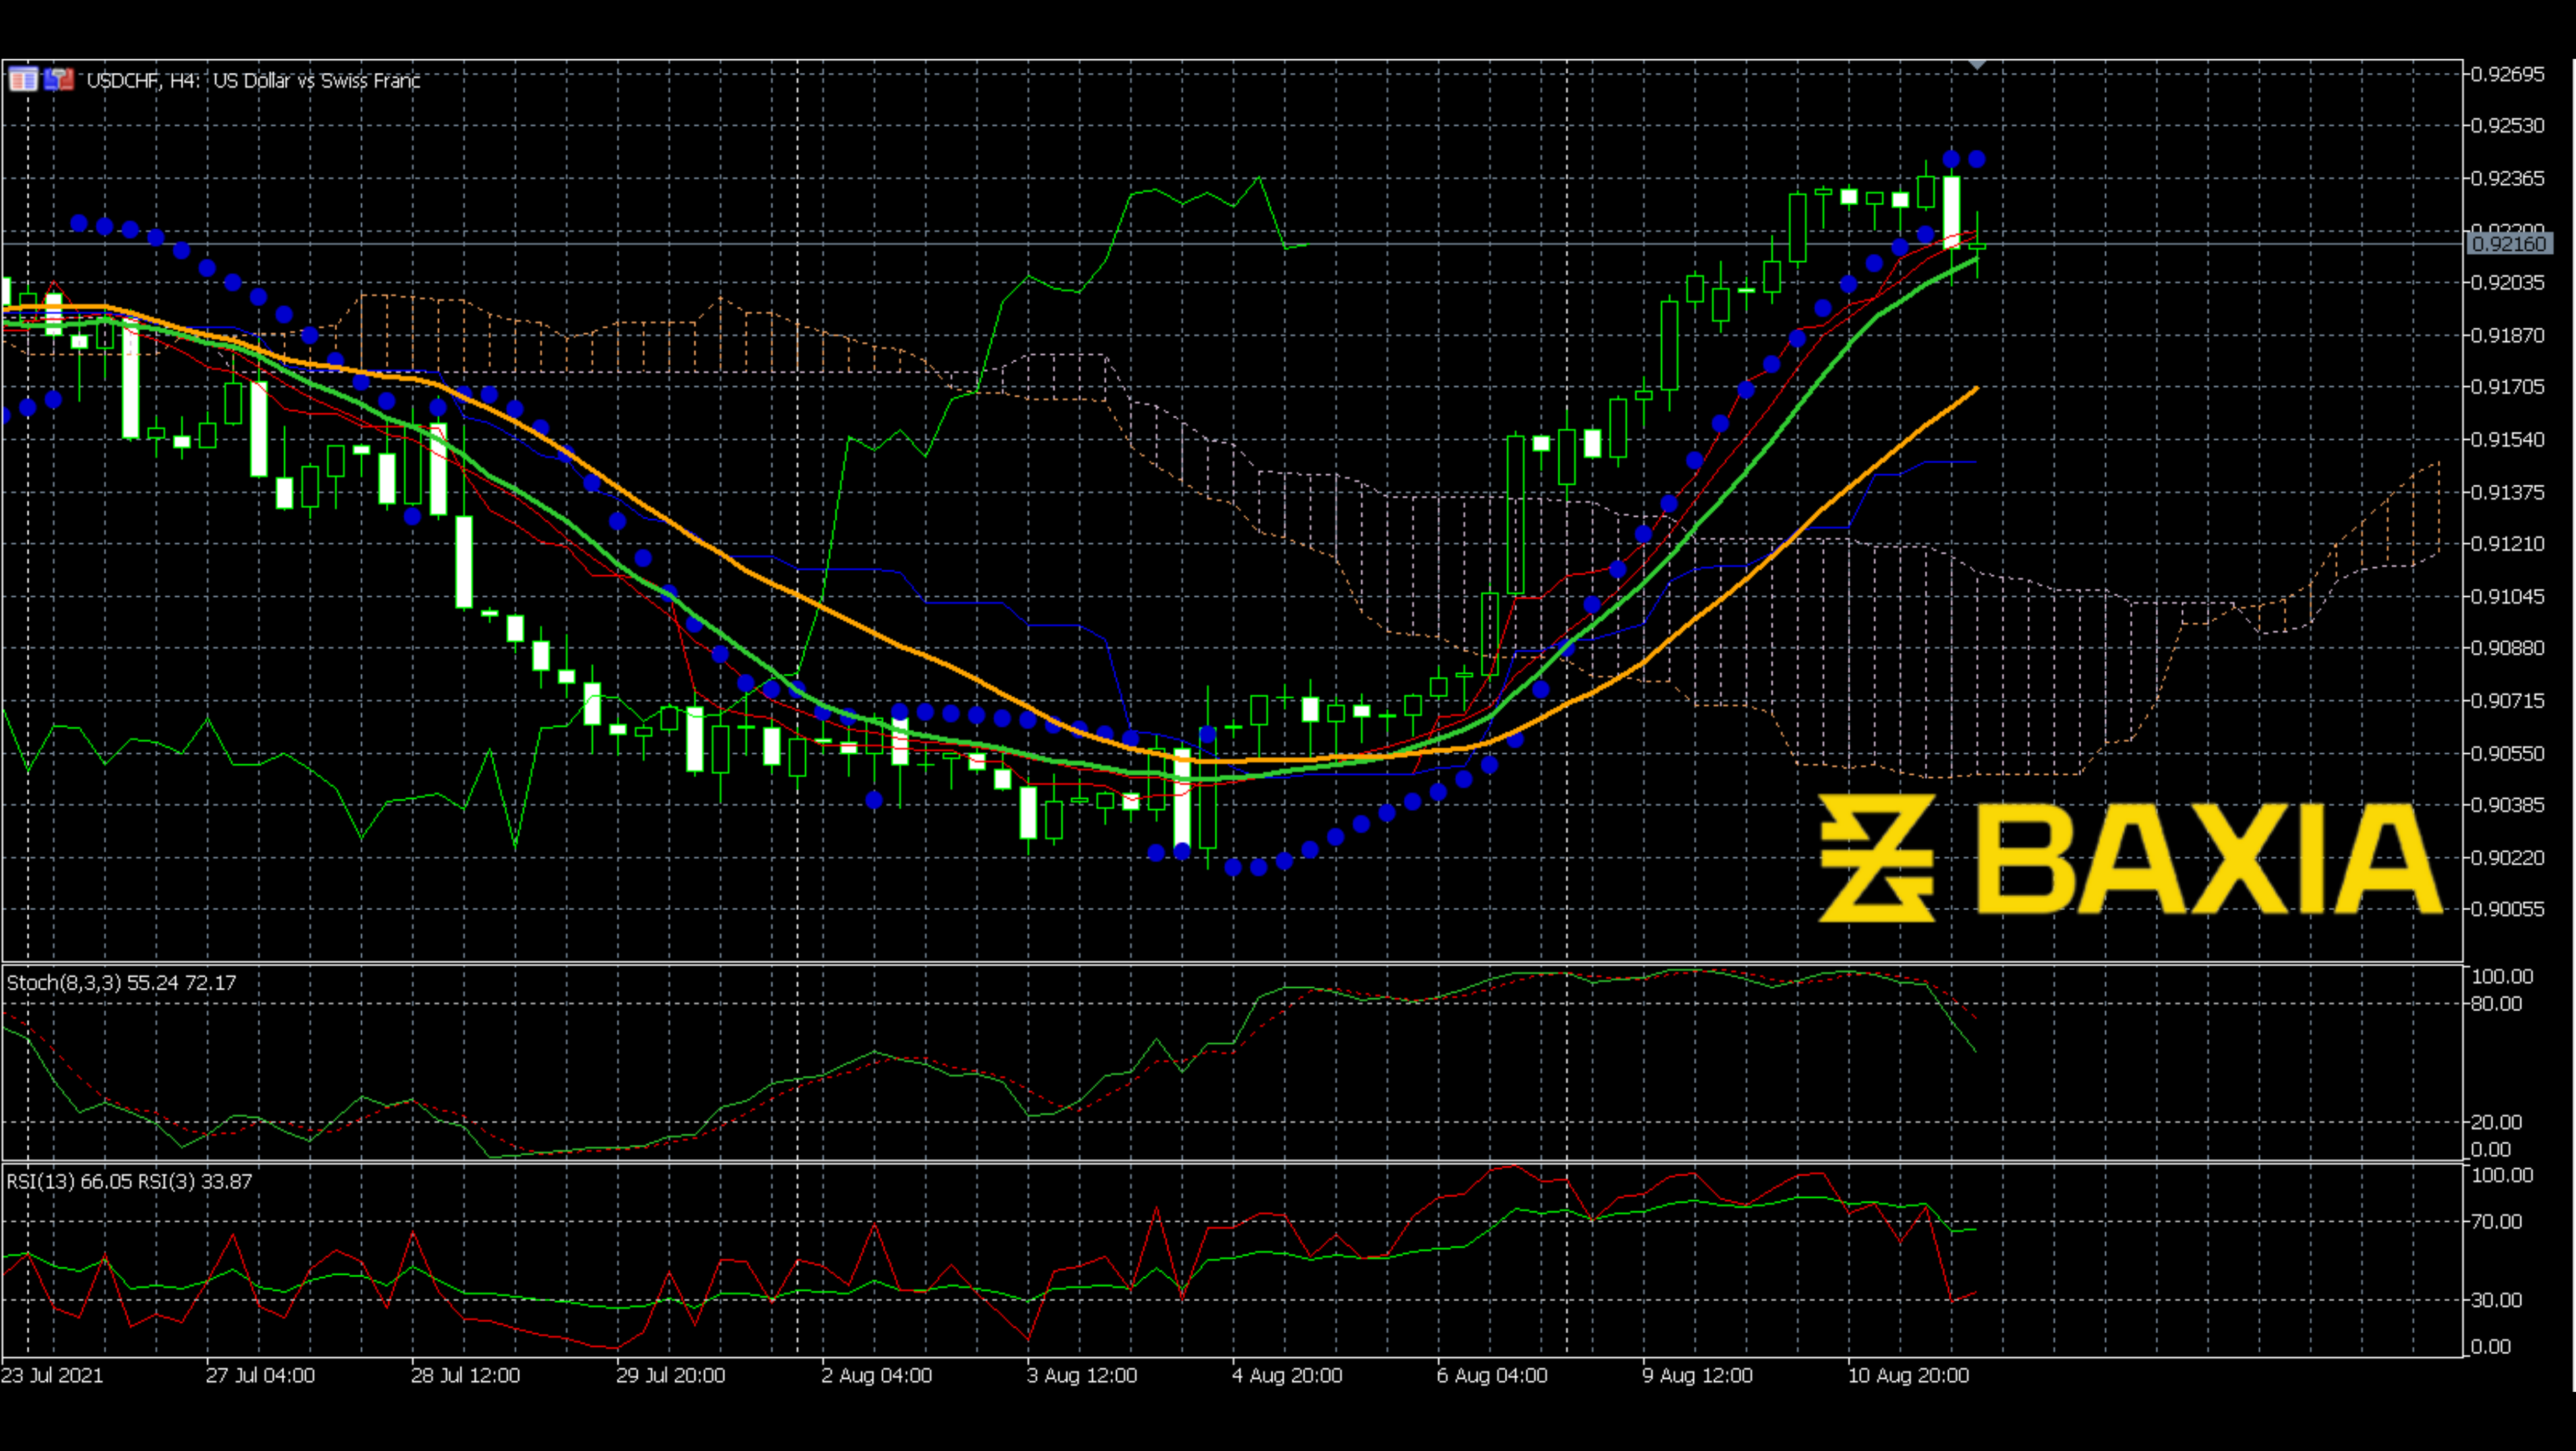
From the two moving average lines drawn, we can see that the MA15(green) has curved a little; it has already overlapped with the SAR parabola and just made a new downward trend signal. Although there are only two dots, we should consider it the beginning of a new trend; at least, it could be a resistance. The Ichimoku cloud still moves below the price line; however, we can see the cloud move up shortly. Stochastics move down from the oversold areas. The RSI has already moved into the middle zone. Although we do not have too many significant bearish signals, we do have some hints that the price could turn down soon.
We love to hear new ideas from traders and want to know what you think!
If you like this topic and want to suggest future topics that you find helpful, let us know by clicking the ‘submit your feedback’ button below.

Trading foreign exchange on margin carries a high level of risk, and may not be suitable for all investors. Before deciding to trade foreign exchange you should carefully consider your investment objectives, level of experience, and risk appetite.
Nothing contained in this website should be construed as investment advice. Any reference to an investment's past or potential performance is not, and should not be construed as, a recommendation or as a guarantee of any specific outcome or profit.