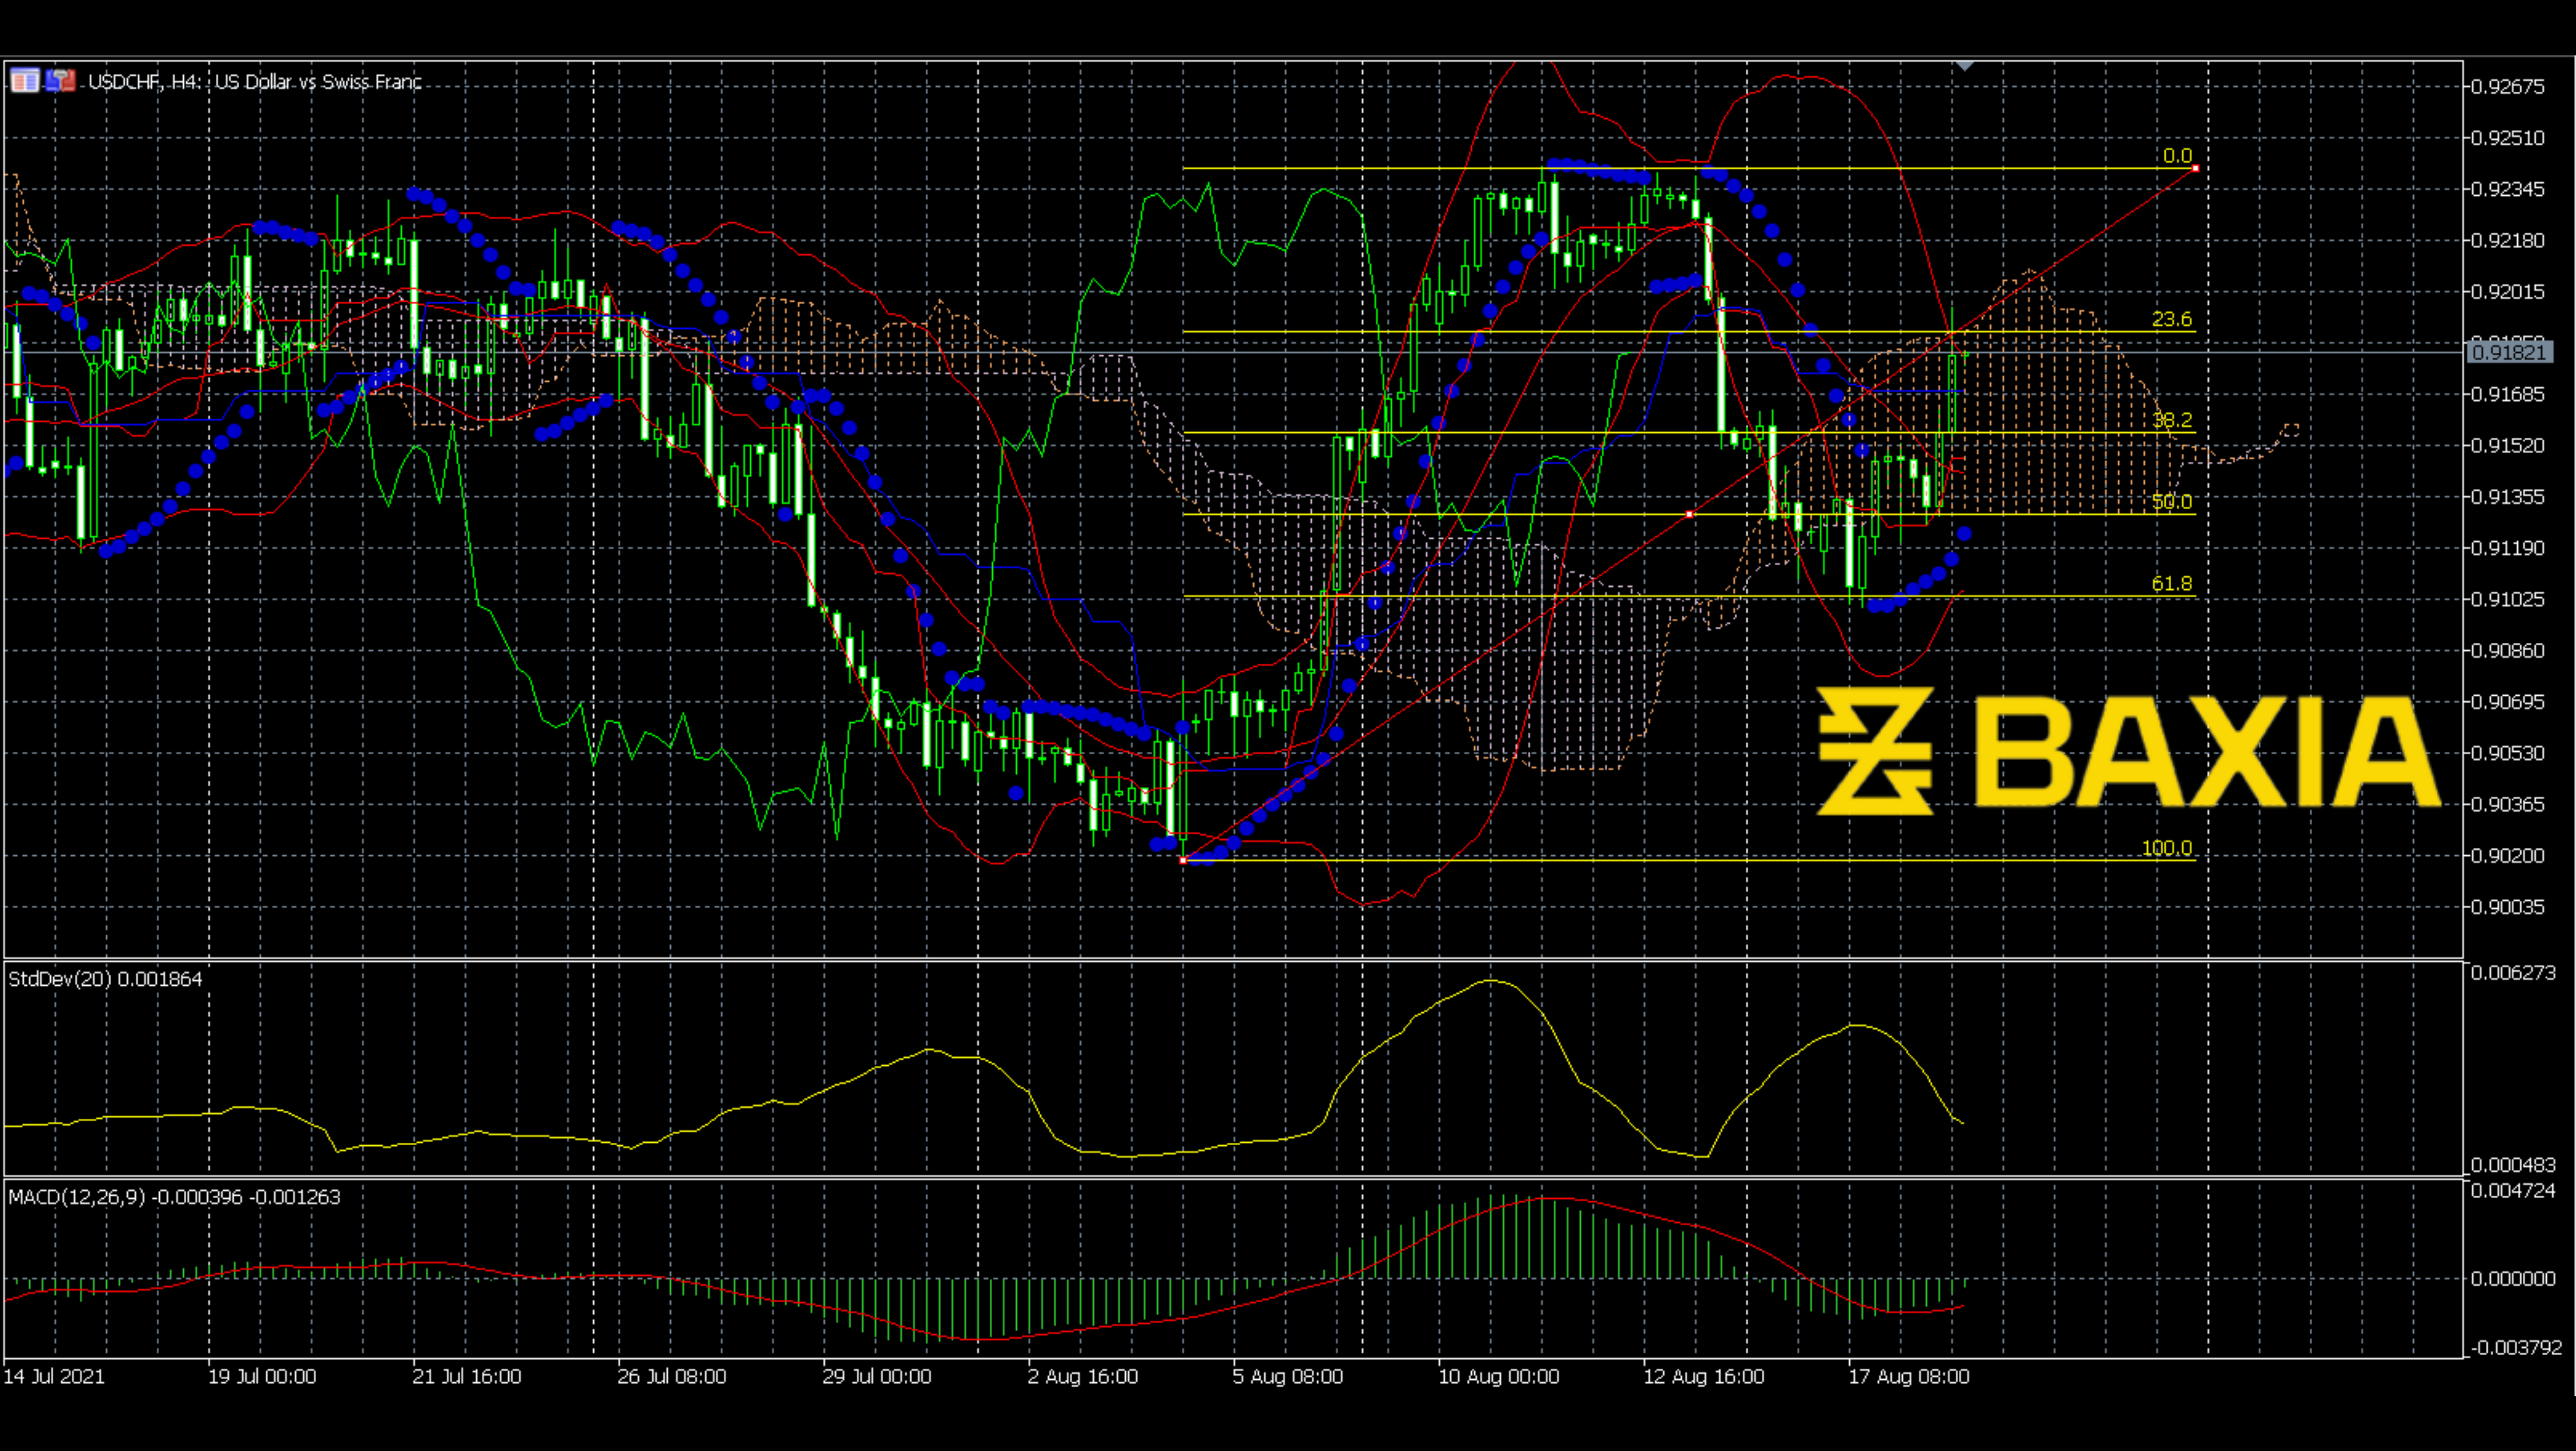

The downward trend on USDCHF had started at the beginning of April. During the next 49 days, the price went down 5.7%; we cannot say this was a sharp drop, but we can say it was a stable trend because of the long period. As we know, it is always hard to break out of a steady trend, so the support power on June 8th was strong.
The upward trend started on June 15th, and it only took ten days to reach the 61.8% Fibonacci level, which was about a 3.8% rise. Will the price break out the 61.8% level Fibonacci?
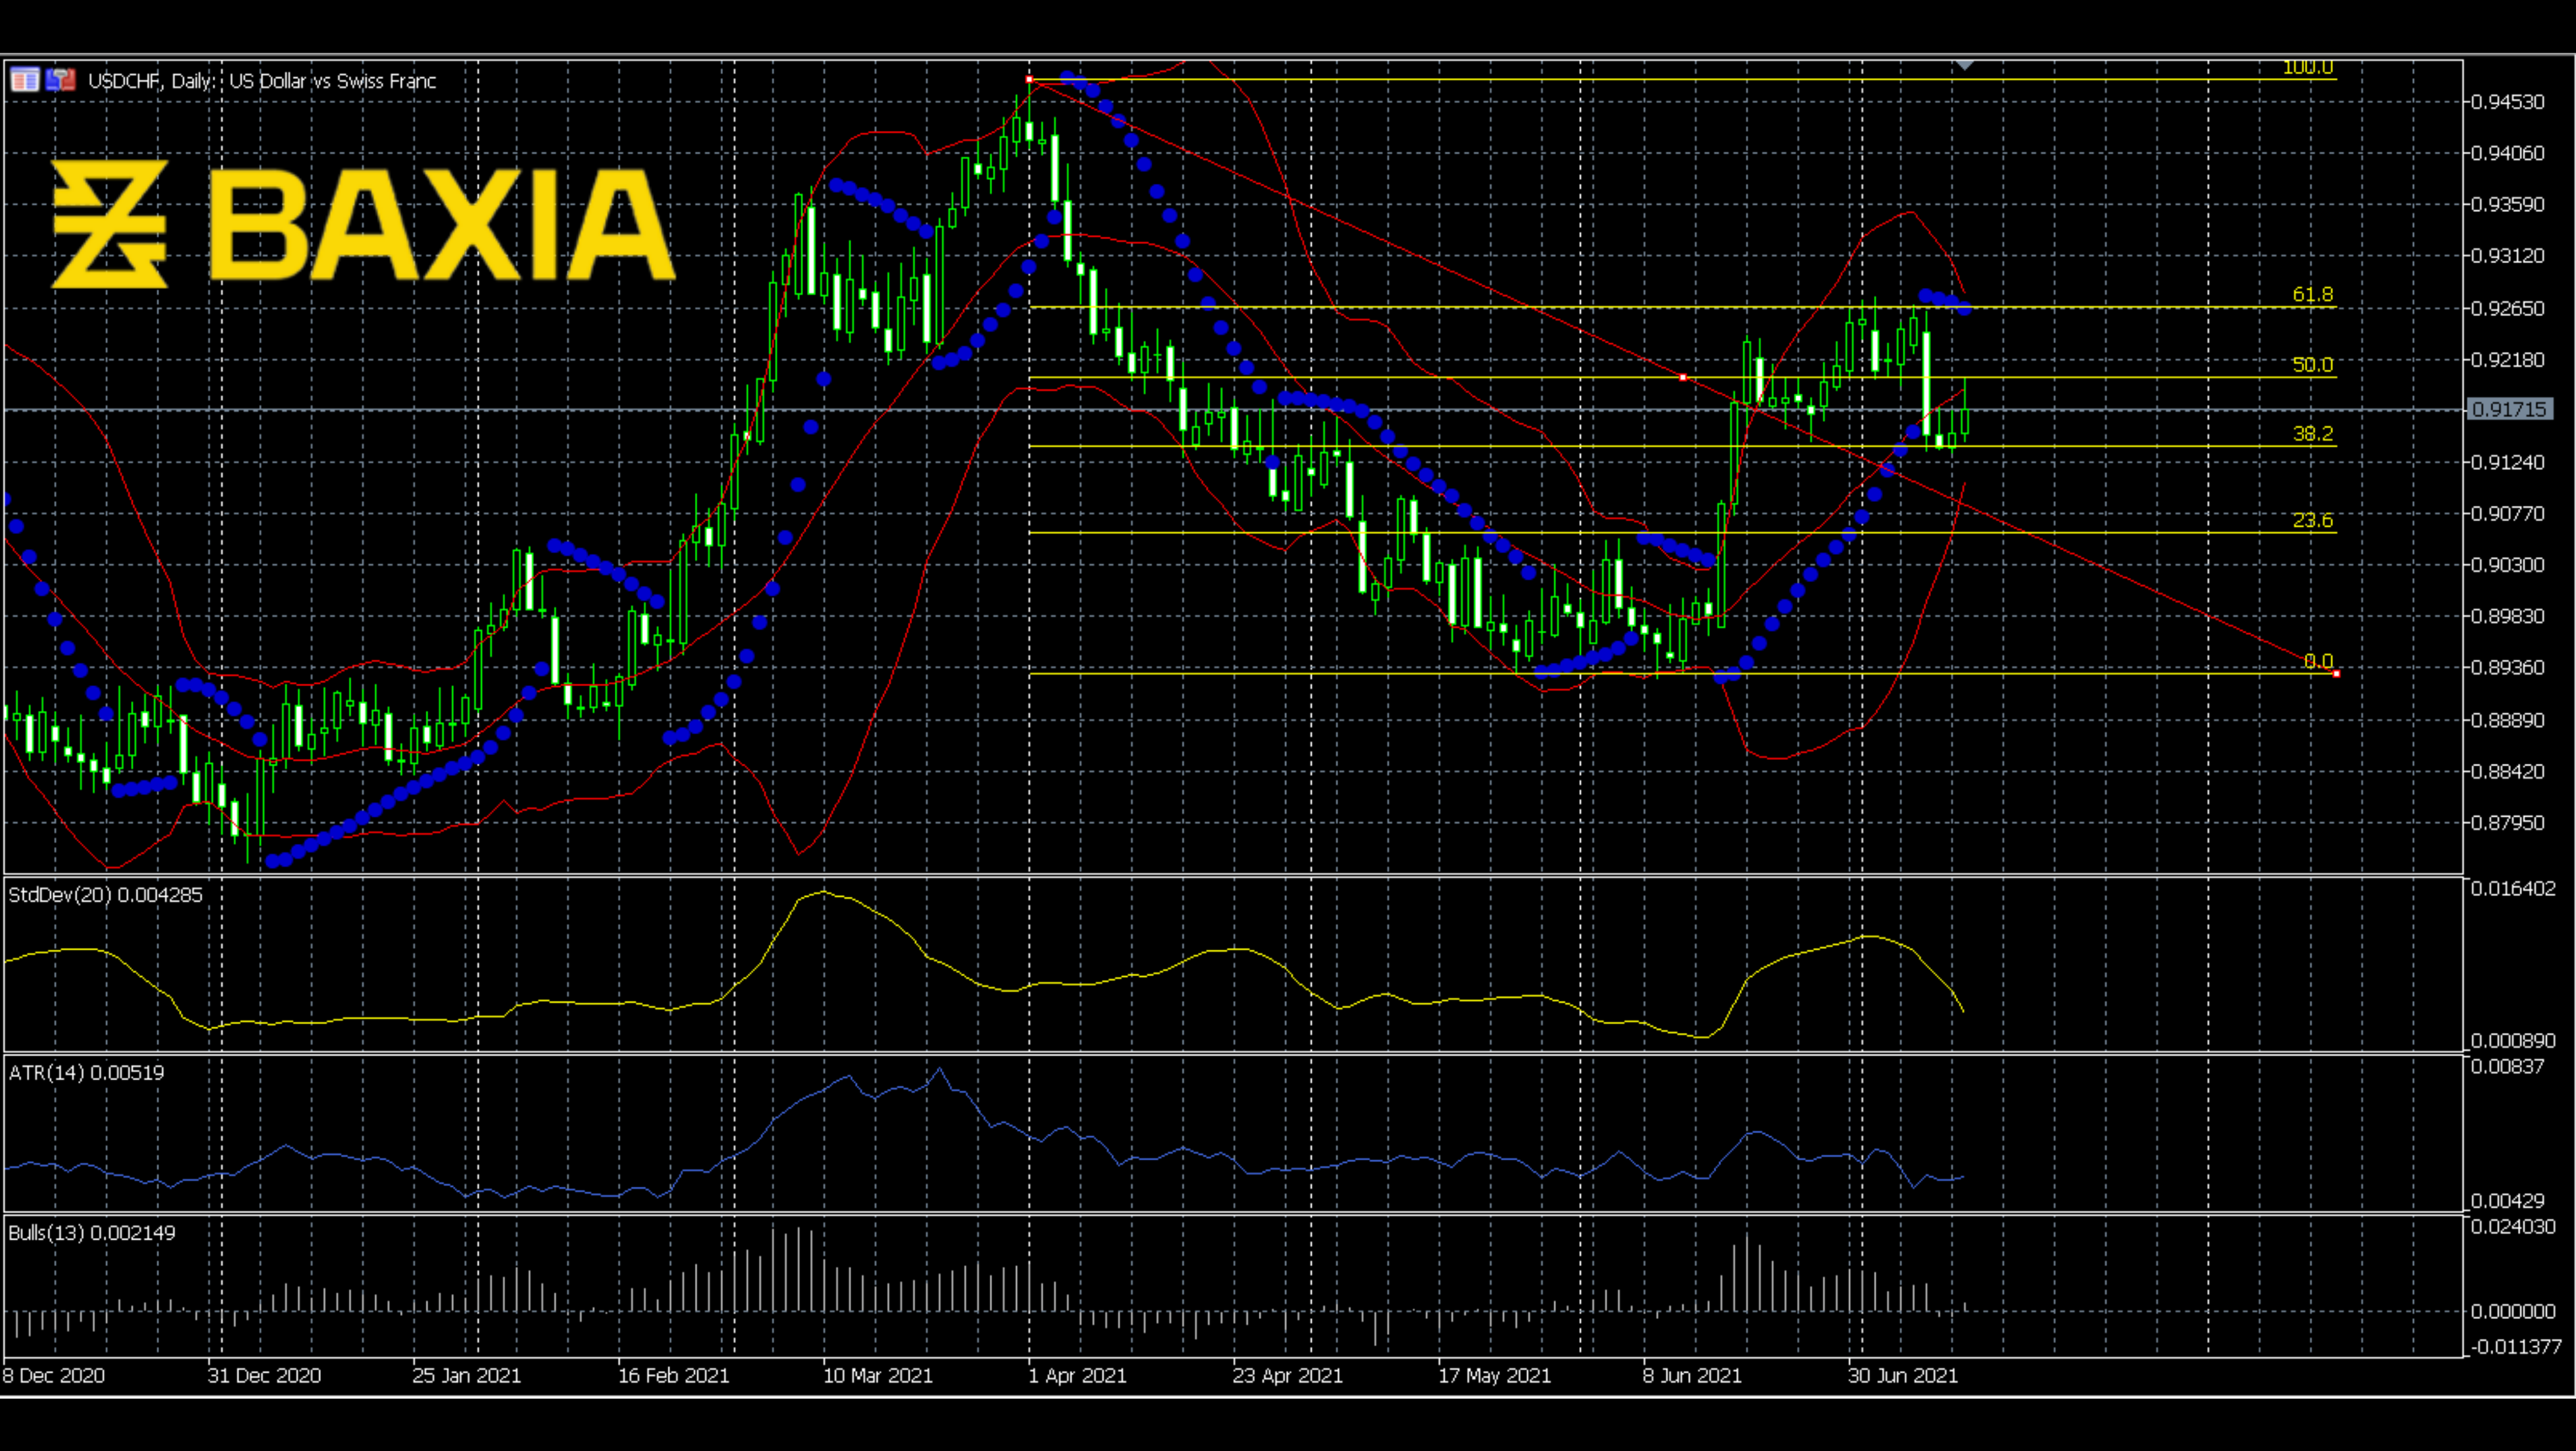
For now, we can see that the Bollinger Bands have shrunk, which was a signal of breakout. Standard deviation just comes down from a high level because the price is hovering in a small range recently. SAR Parabolic made a downward trend; this was because of the comparatively significant drop on July 8th. Although the previous movement could explain the bearish signal, the bull power indicates a diminishing support power.
We love to hear new ideas from traders and want to know what you think!
If you like this topic and want to suggest future topics that you find helpful, let us know by clicking the ‘submit your feedback’ button below.

Trading foreign exchange on margin carries a high level of risk, and may not be suitable for all investors. Before deciding to trade foreign exchange you should carefully consider your investment objectives, level of experience, and risk appetite.
Nothing contained in this website should be construed as investment advice. Any reference to an investment's past or potential performance is not, and should not be construed as, a recommendation or as a guarantee of any specific outcome or profit.