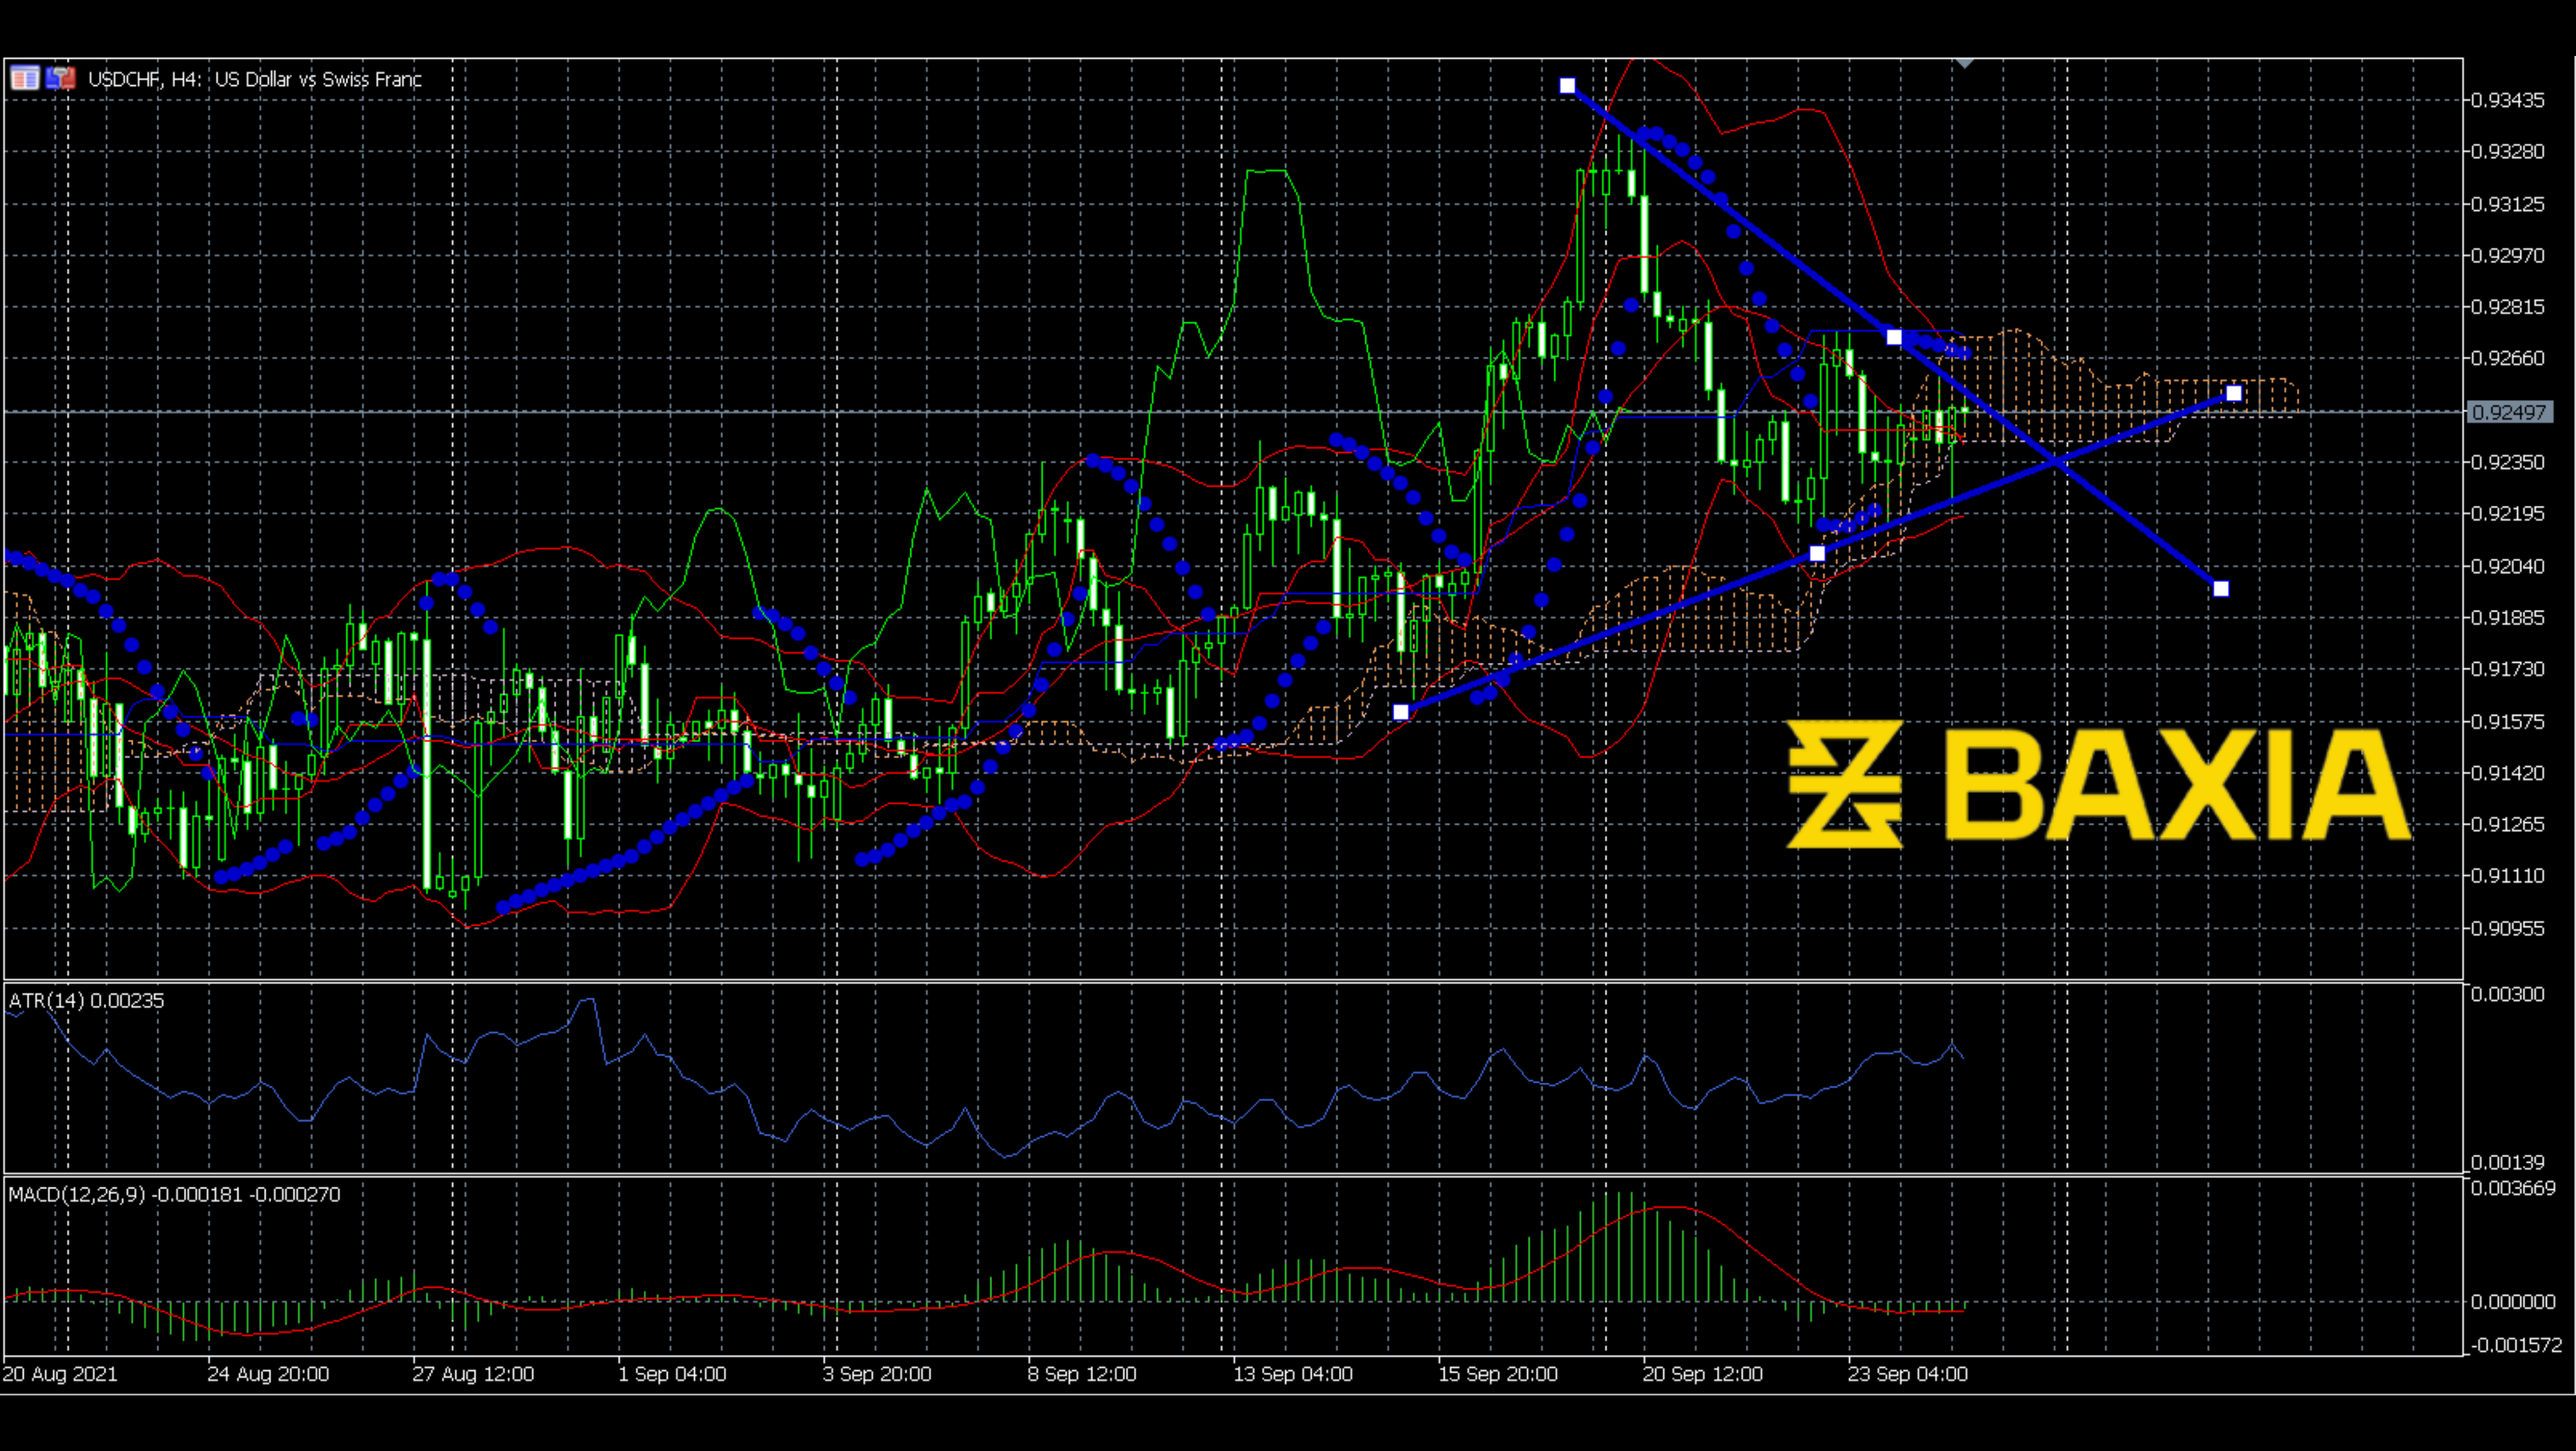

The price of USDCHF had been going down for the last four days. During these four days, the price had been down by 1.25%. Although the trend was up and down, the price turned upward on Aug 17th. The turning point was at 61.8% Fibonacci level; this point made sense because the pressure of retracement was more substantial here.
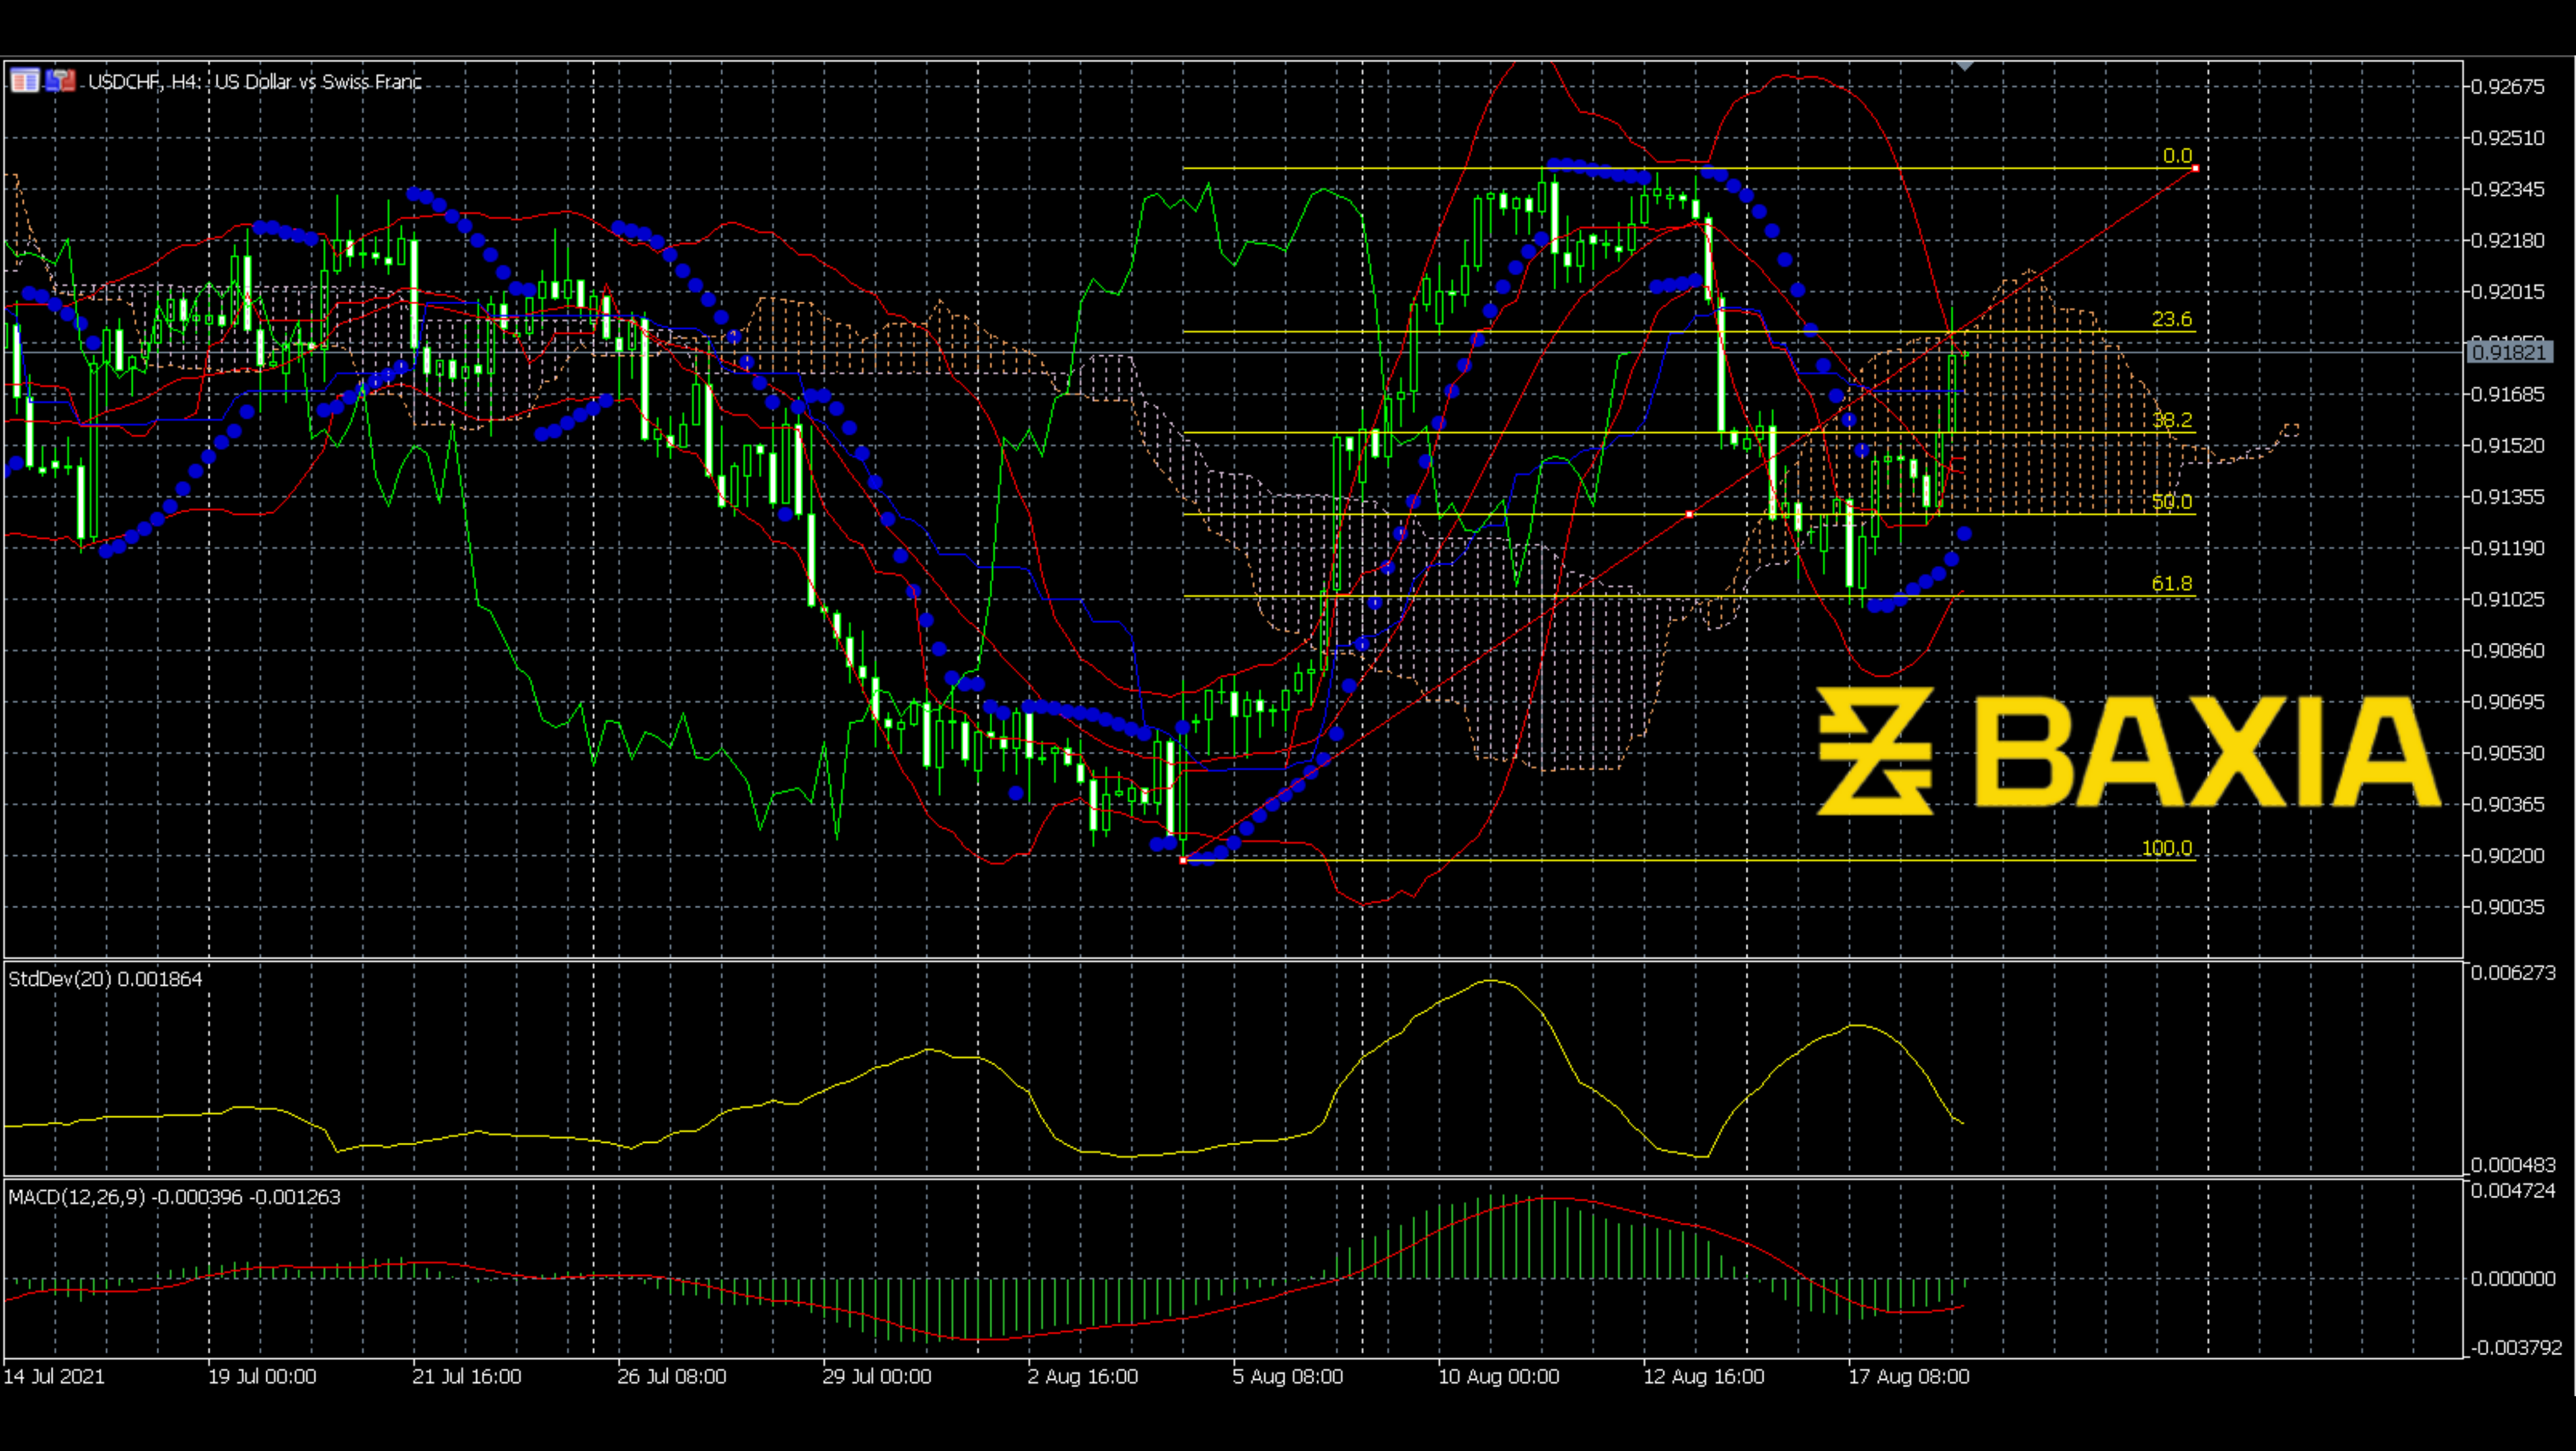
Within our expectation, the price started to go up after reaching the 61.8% Fibonacci level; the price line's slope is also sharp. How long will this strong upward trend last? The price line goes up now; however, the Ichimoku cloud also goes up at this time, which shows the opposite signal. Bollinger Bangs shrunk allowing the price to potentially break out soon, but we do not know the direction. Although the MACD still shows a bullish signal, this is a lagging indicator. So we should keep our eyes on the price and wait to see if the price meets the previous peak on Aug 12th.
We love to hear new ideas from traders and want to know what you think!
If you like this topic and want to suggest future topics that you find helpful, let us know by clicking the ‘submit your feedback’ button below.

Trading foreign exchange on margin carries a high level of risk, and may not be suitable for all investors. Before deciding to trade foreign exchange you should carefully consider your investment objectives, level of experience, and risk appetite.
Nothing contained in this website should be construed as investment advice. Any reference to an investment's past or potential performance is not, and should not be construed as, a recommendation or as a guarantee of any specific outcome or profit.