
The price line of USDJPY has made three big waves since Sep 8th. As can be seen from the chart, the three waves have made some breakouts in different directions. However, the price went in a downward trend. The price broke down the Bollinger Bands three times but only broke up once. Also, from the blue line, we can see that the downward trend is significant.
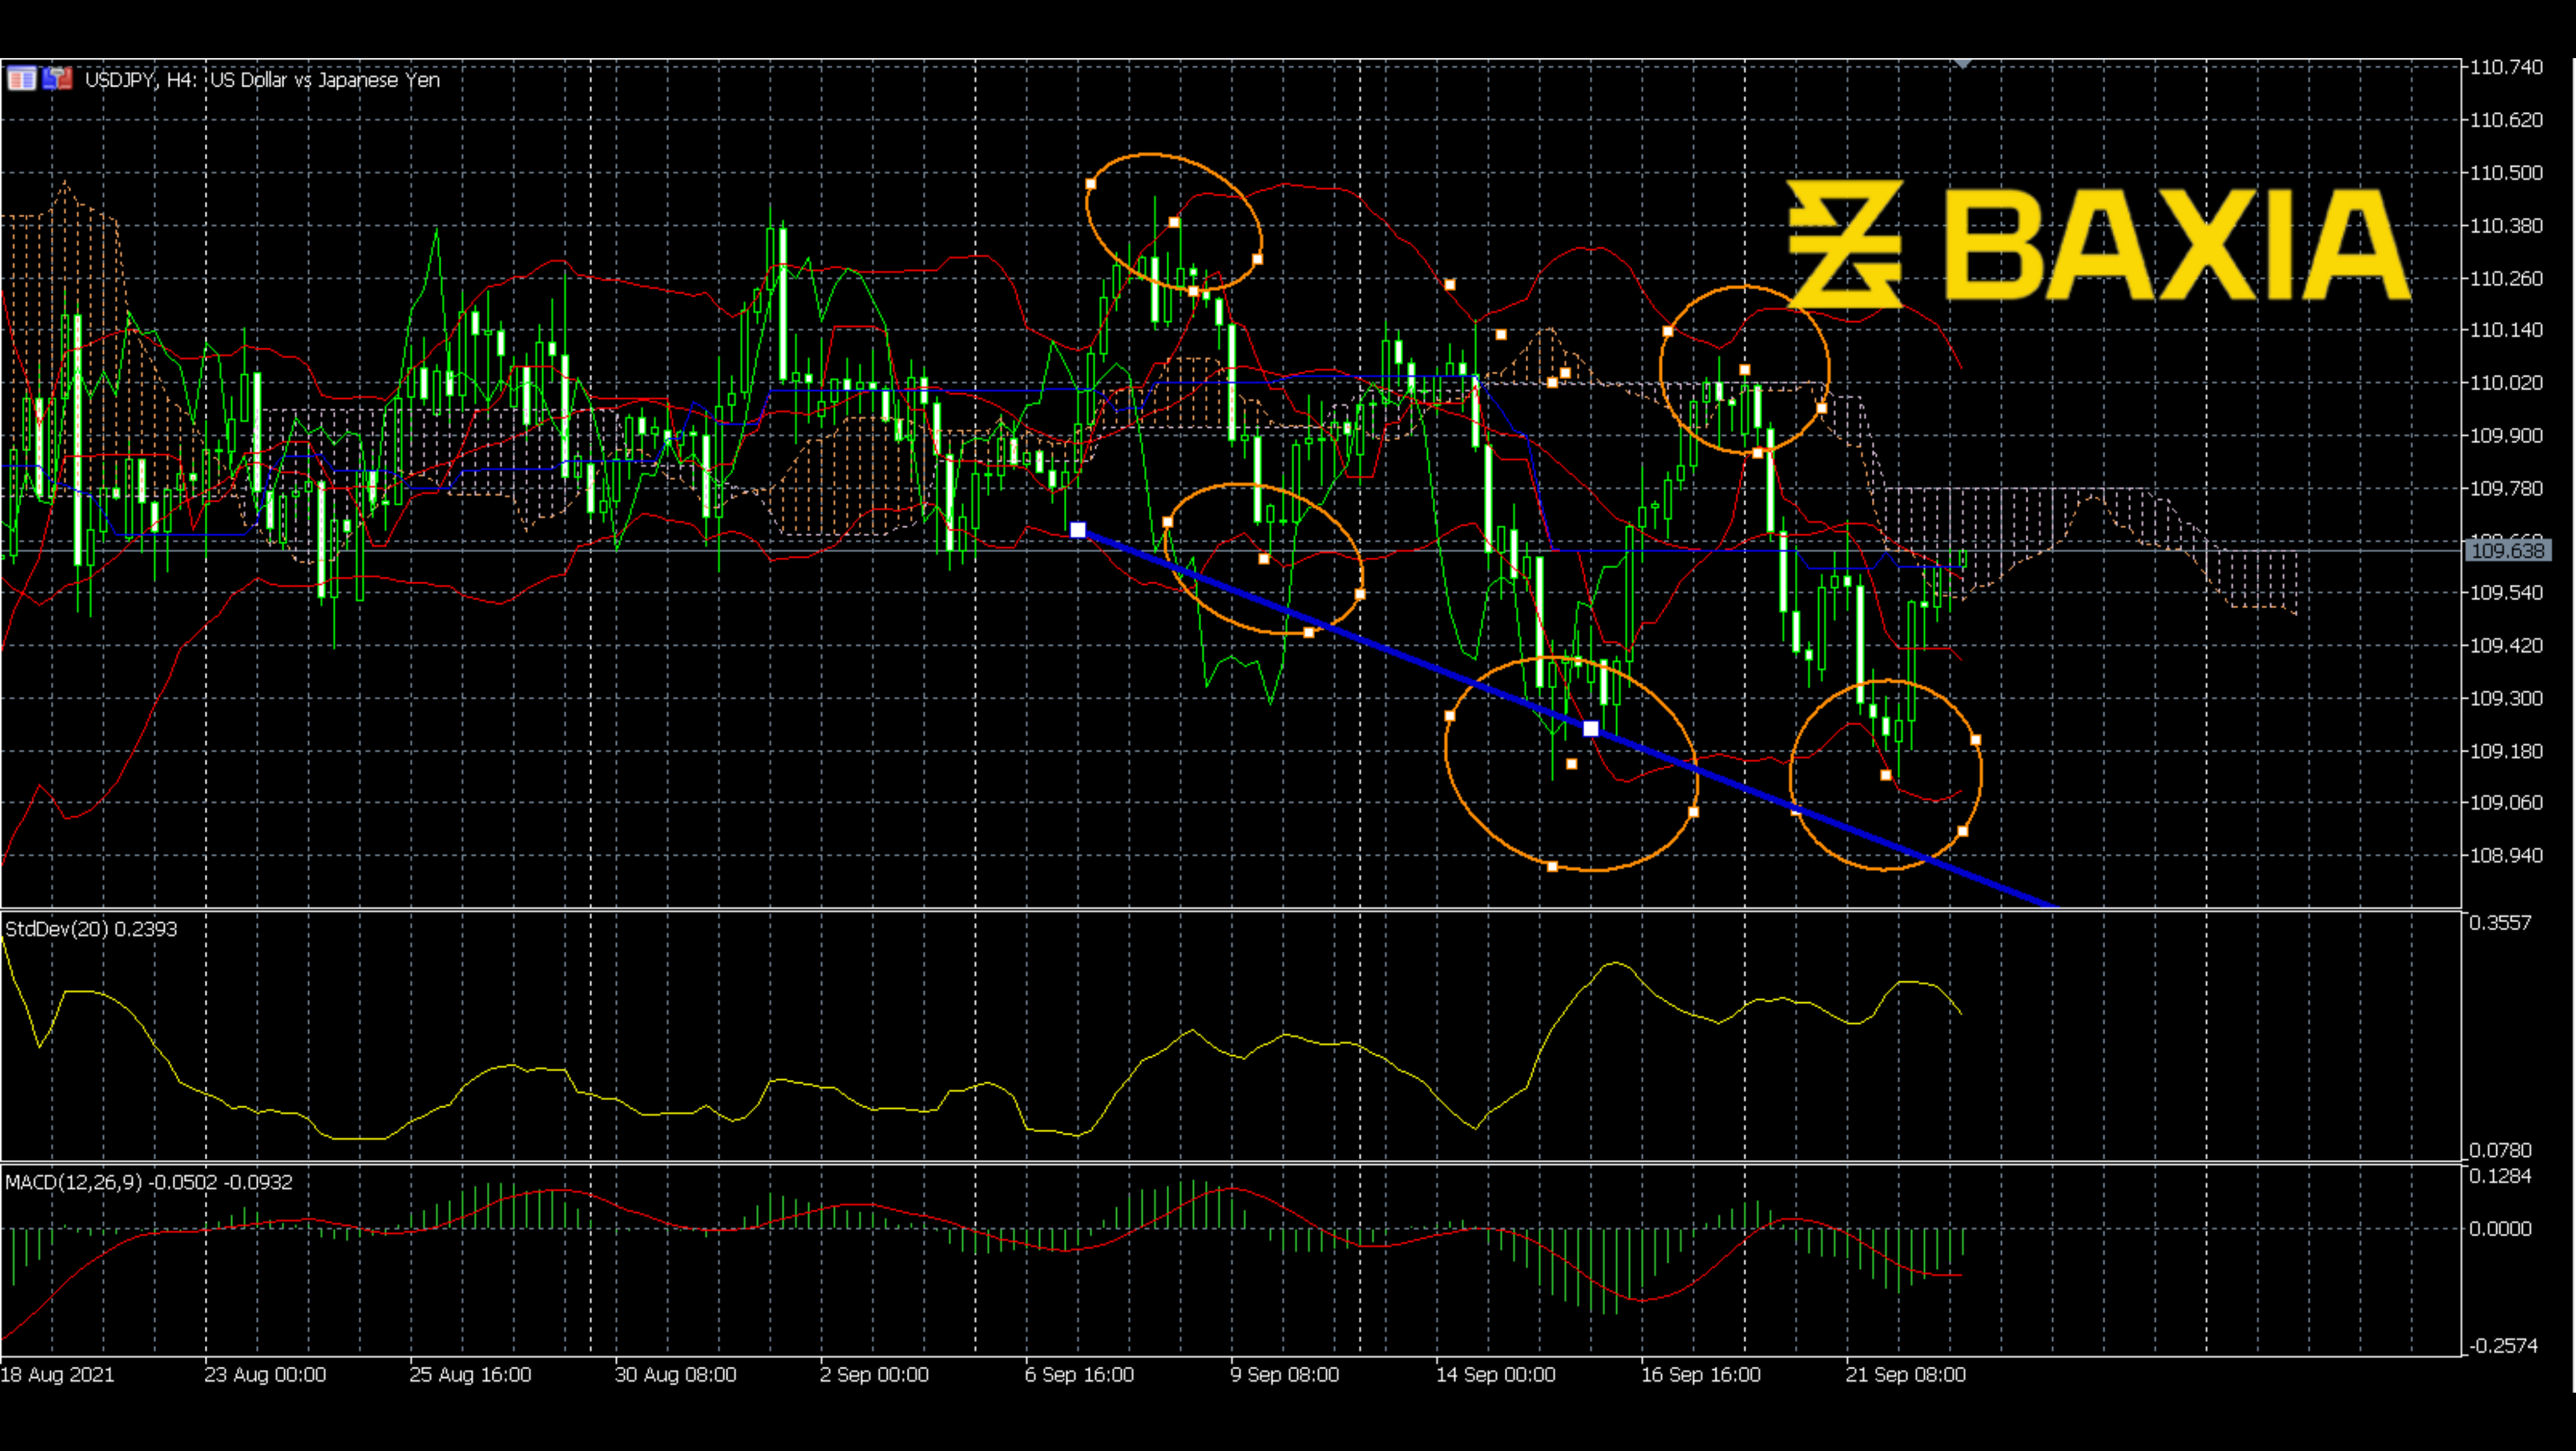
The standard deviation remains at a high level because those three waves were big fluctuations, so we don’t need to worry about that. The MACD has made a bullish cross; however, it still moves below the zero level. Also, the price moved below the Ichimoku cloud, which is a bullish signal. Recently the price touched the middle line of the Bollinger Bands; it already meets resistance here. The downward trend is still strong. Although the bearish signals are not clear, the big picture still shows a downward trend.
We love to hear new ideas from traders and want to know what you think!
If you like this topic and want to suggest future topics that you find helpful, let us know by clicking the ‘submit your feedback’ button below.

Trading foreign exchange on margin carries a high level of risk, and may not be suitable for all investors. Before deciding to trade foreign exchange you should carefully consider your investment objectives, level of experience, and risk appetite.
Nothing contained in this website should be construed as investment advice. Any reference to an investment's past or potential performance is not, and should not be construed as, a recommendation or as a guarantee of any specific outcome or profit.