
As can be seen, the downward trend on USDCHF has lasted for twenty-six days since Sep 30. However, recently, the price seemed to meet support here. Does this mean the end of the downward trend here on USDCHF? The movement was unstable; as can be seen, the fluctuations were full of the trend. So, this could be another fluctuation.
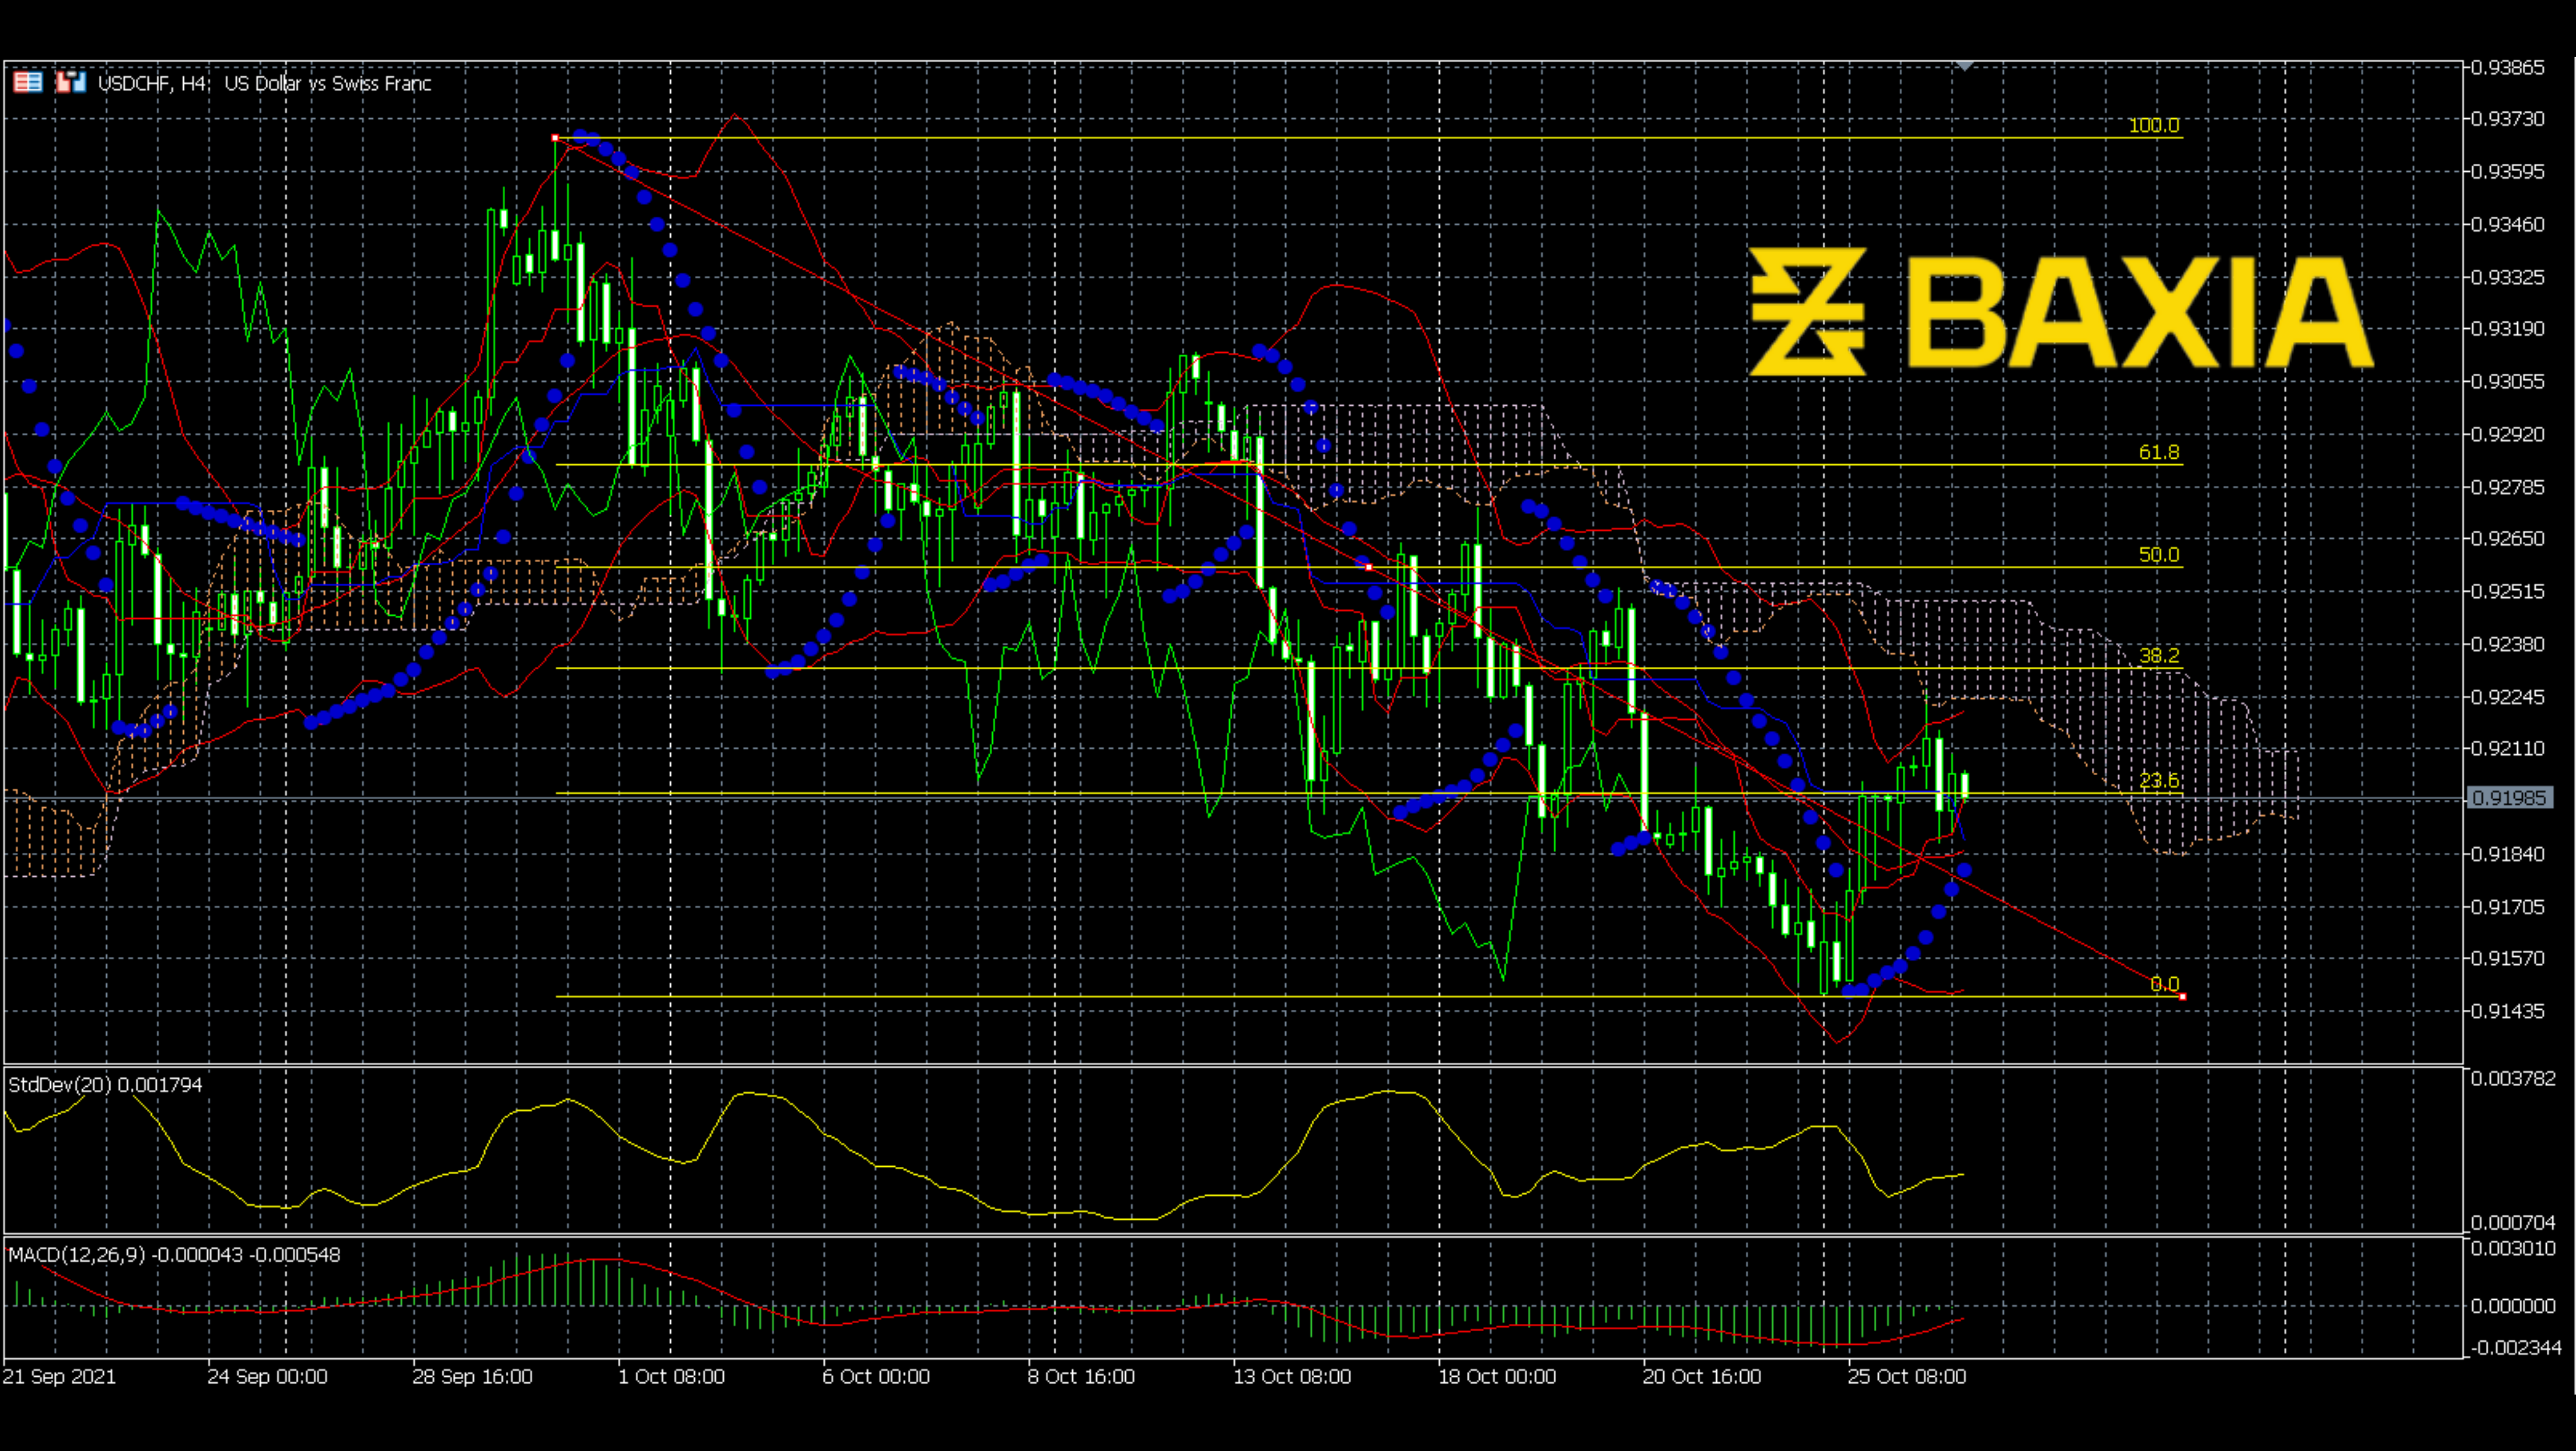
I know traders may worry that the price line touched the upper Bollinger Band and the Ichimoku cloud. However, as I said before, the price has fluctuated for a long time; during the trend, every fluctuation pushed the price line to touch the Ichimoku cloud and upper Bollinger Band; we do not have to worry about that. Although the MACD made a bullish cross, it does not mean that the upward trend could last; the MACD still moves below the zero level. If we consider this fluctuation a Fibonacci retracement, it could be a time to turn back to the downward trend. I do not think the price could go beyond the 38.2% level Fibonacci.
We love to hear new ideas from traders and want to know what you think!
If you like this topic and want to suggest future topics that you find helpful, let us know by clicking the ‘submit your feedback’ button below.

Trading foreign exchange on margin carries a high level of risk, and may not be suitable for all investors. Before deciding to trade foreign exchange you should carefully consider your investment objectives, level of experience, and risk appetite.
Nothing contained in this website should be construed as investment advice. Any reference to an investment's past or potential performance is not, and should not be construed as, a recommendation or as a guarantee of any specific outcome or profit.