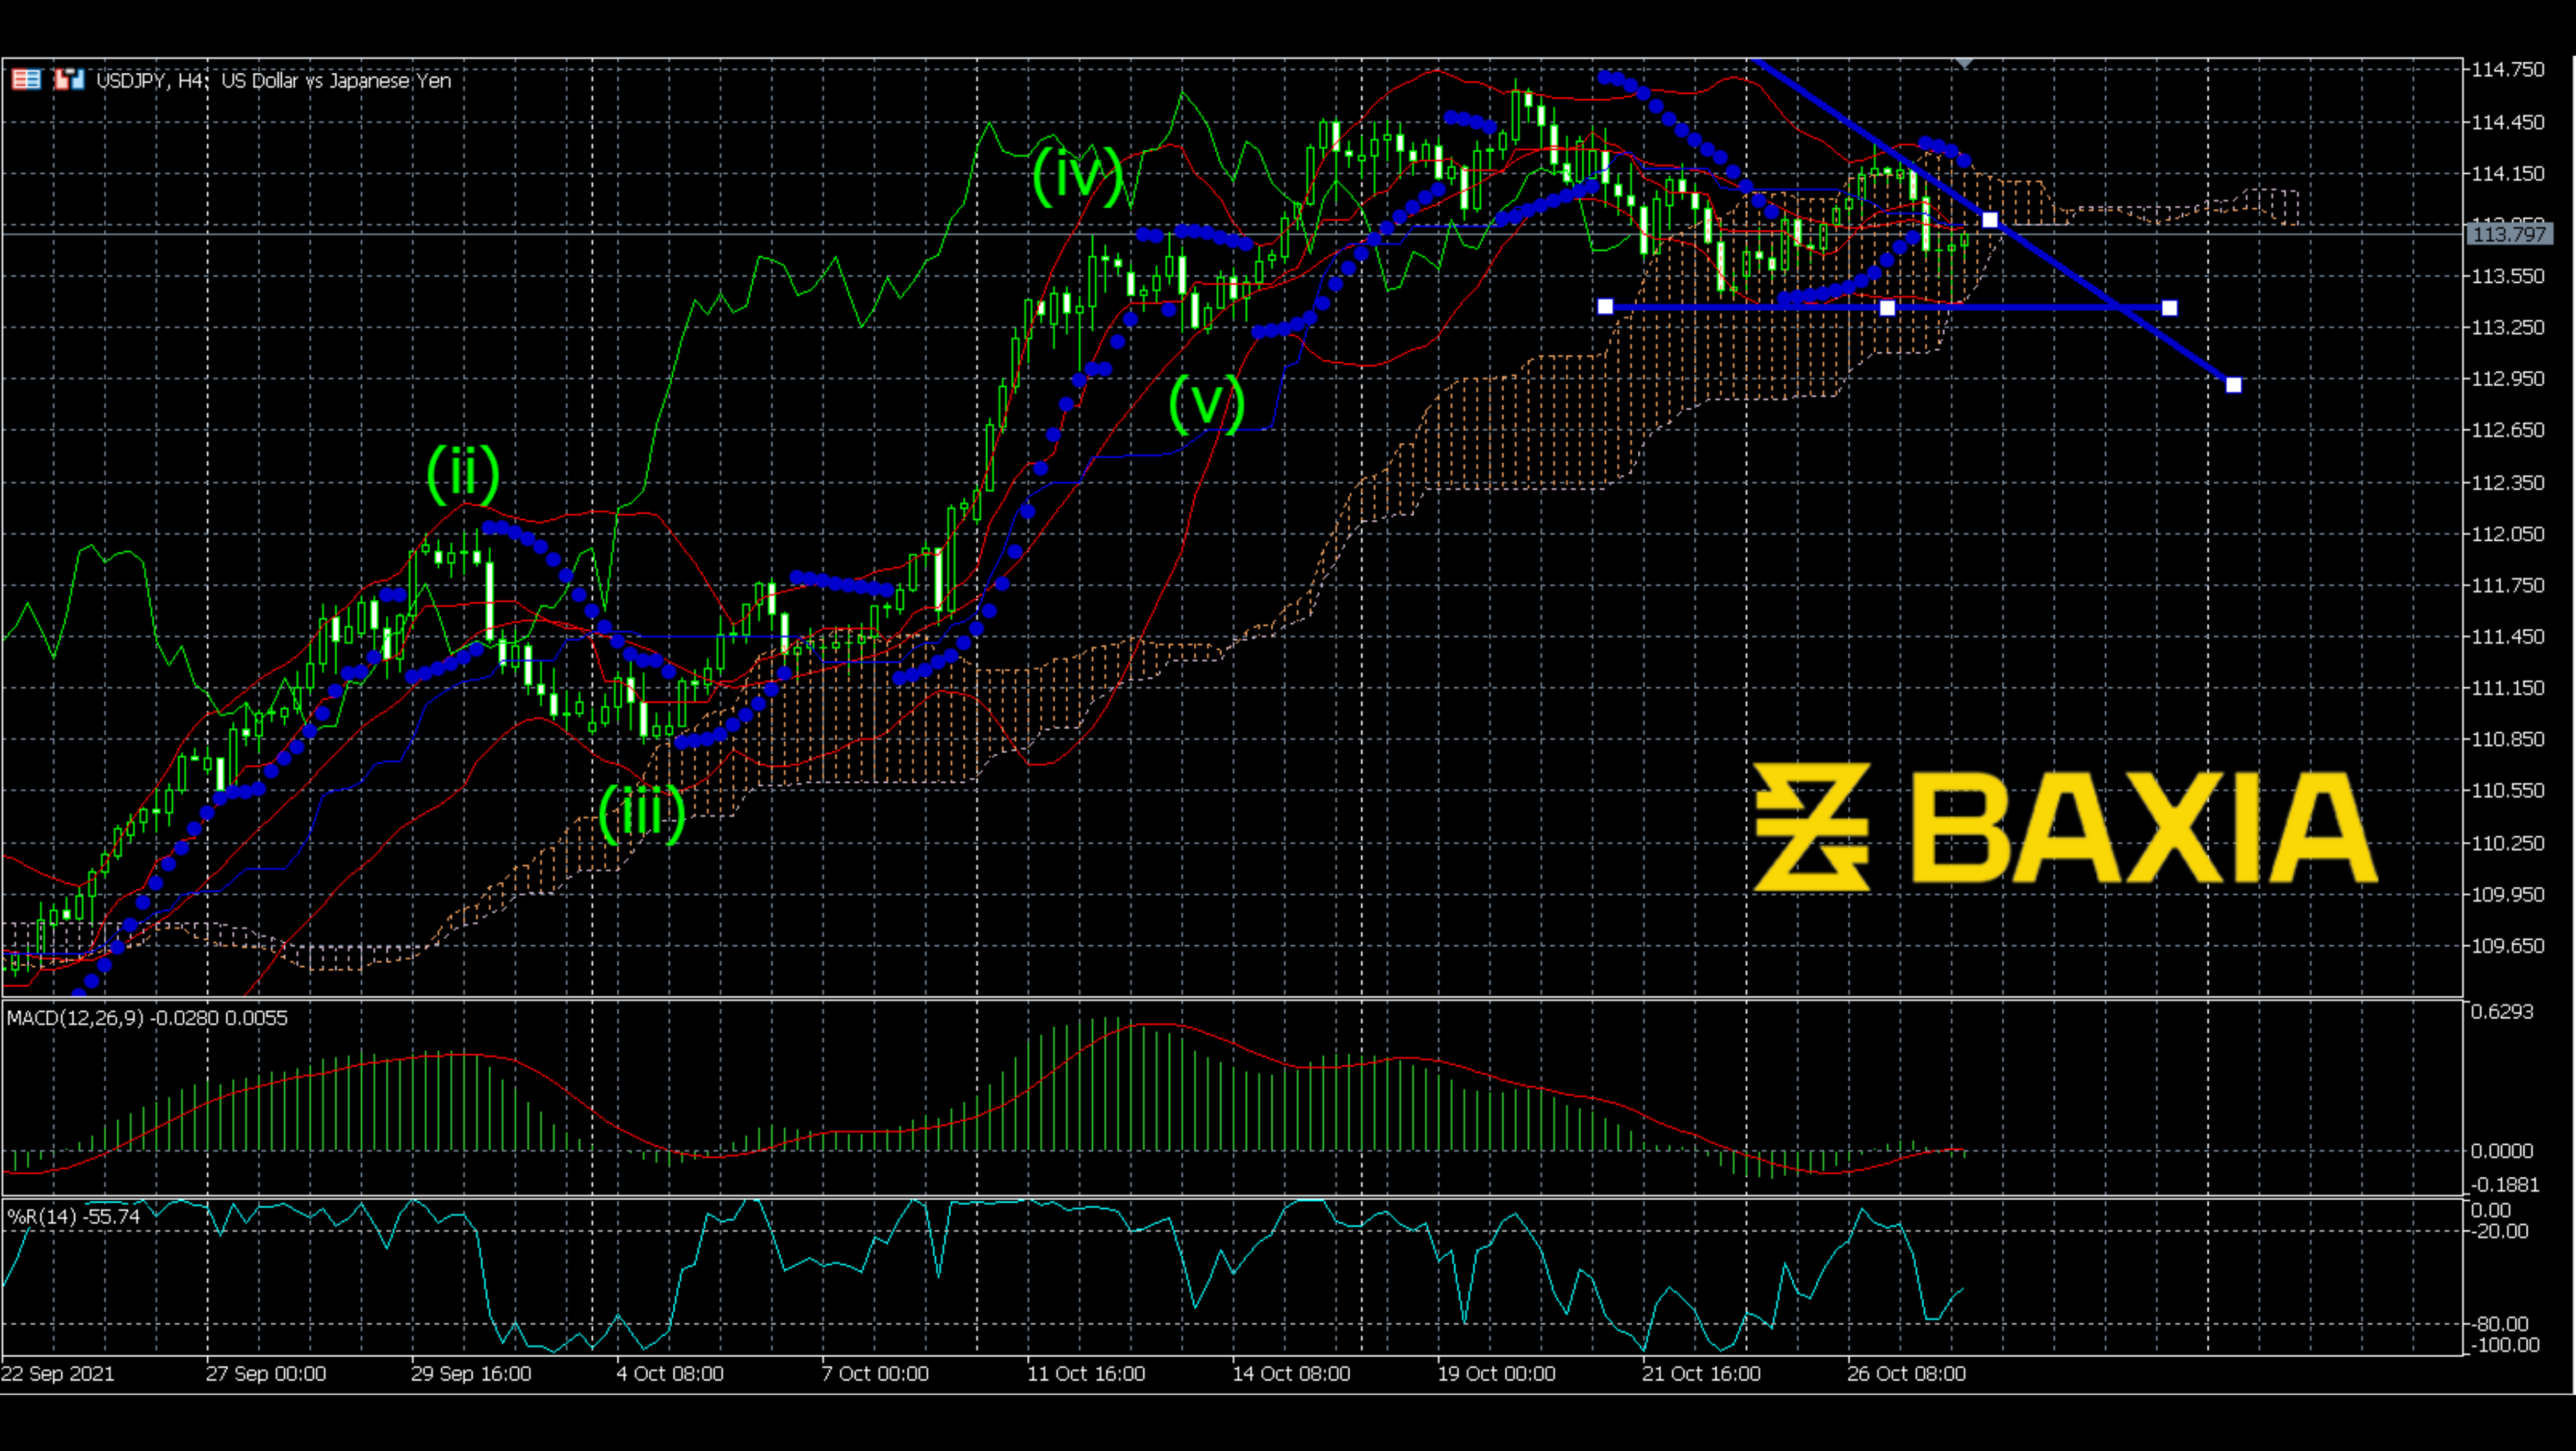

As can be seen, the price of USDJPY has been moving up for almost a month. The upward trend looks solid and significant. However, recently, the price line seemed to get tired of going up. The slope of the price line becomes mild. Will the price continue to go up? I don’t think so. The price has been making the Elliott Motive wave since the beginning of the upward trend. Now, the wave has almost finished. The Elliott Motive wave usually meets resistance at the end, and then a correct wave shows. So, I would consider the end of the wave a bearish signal.
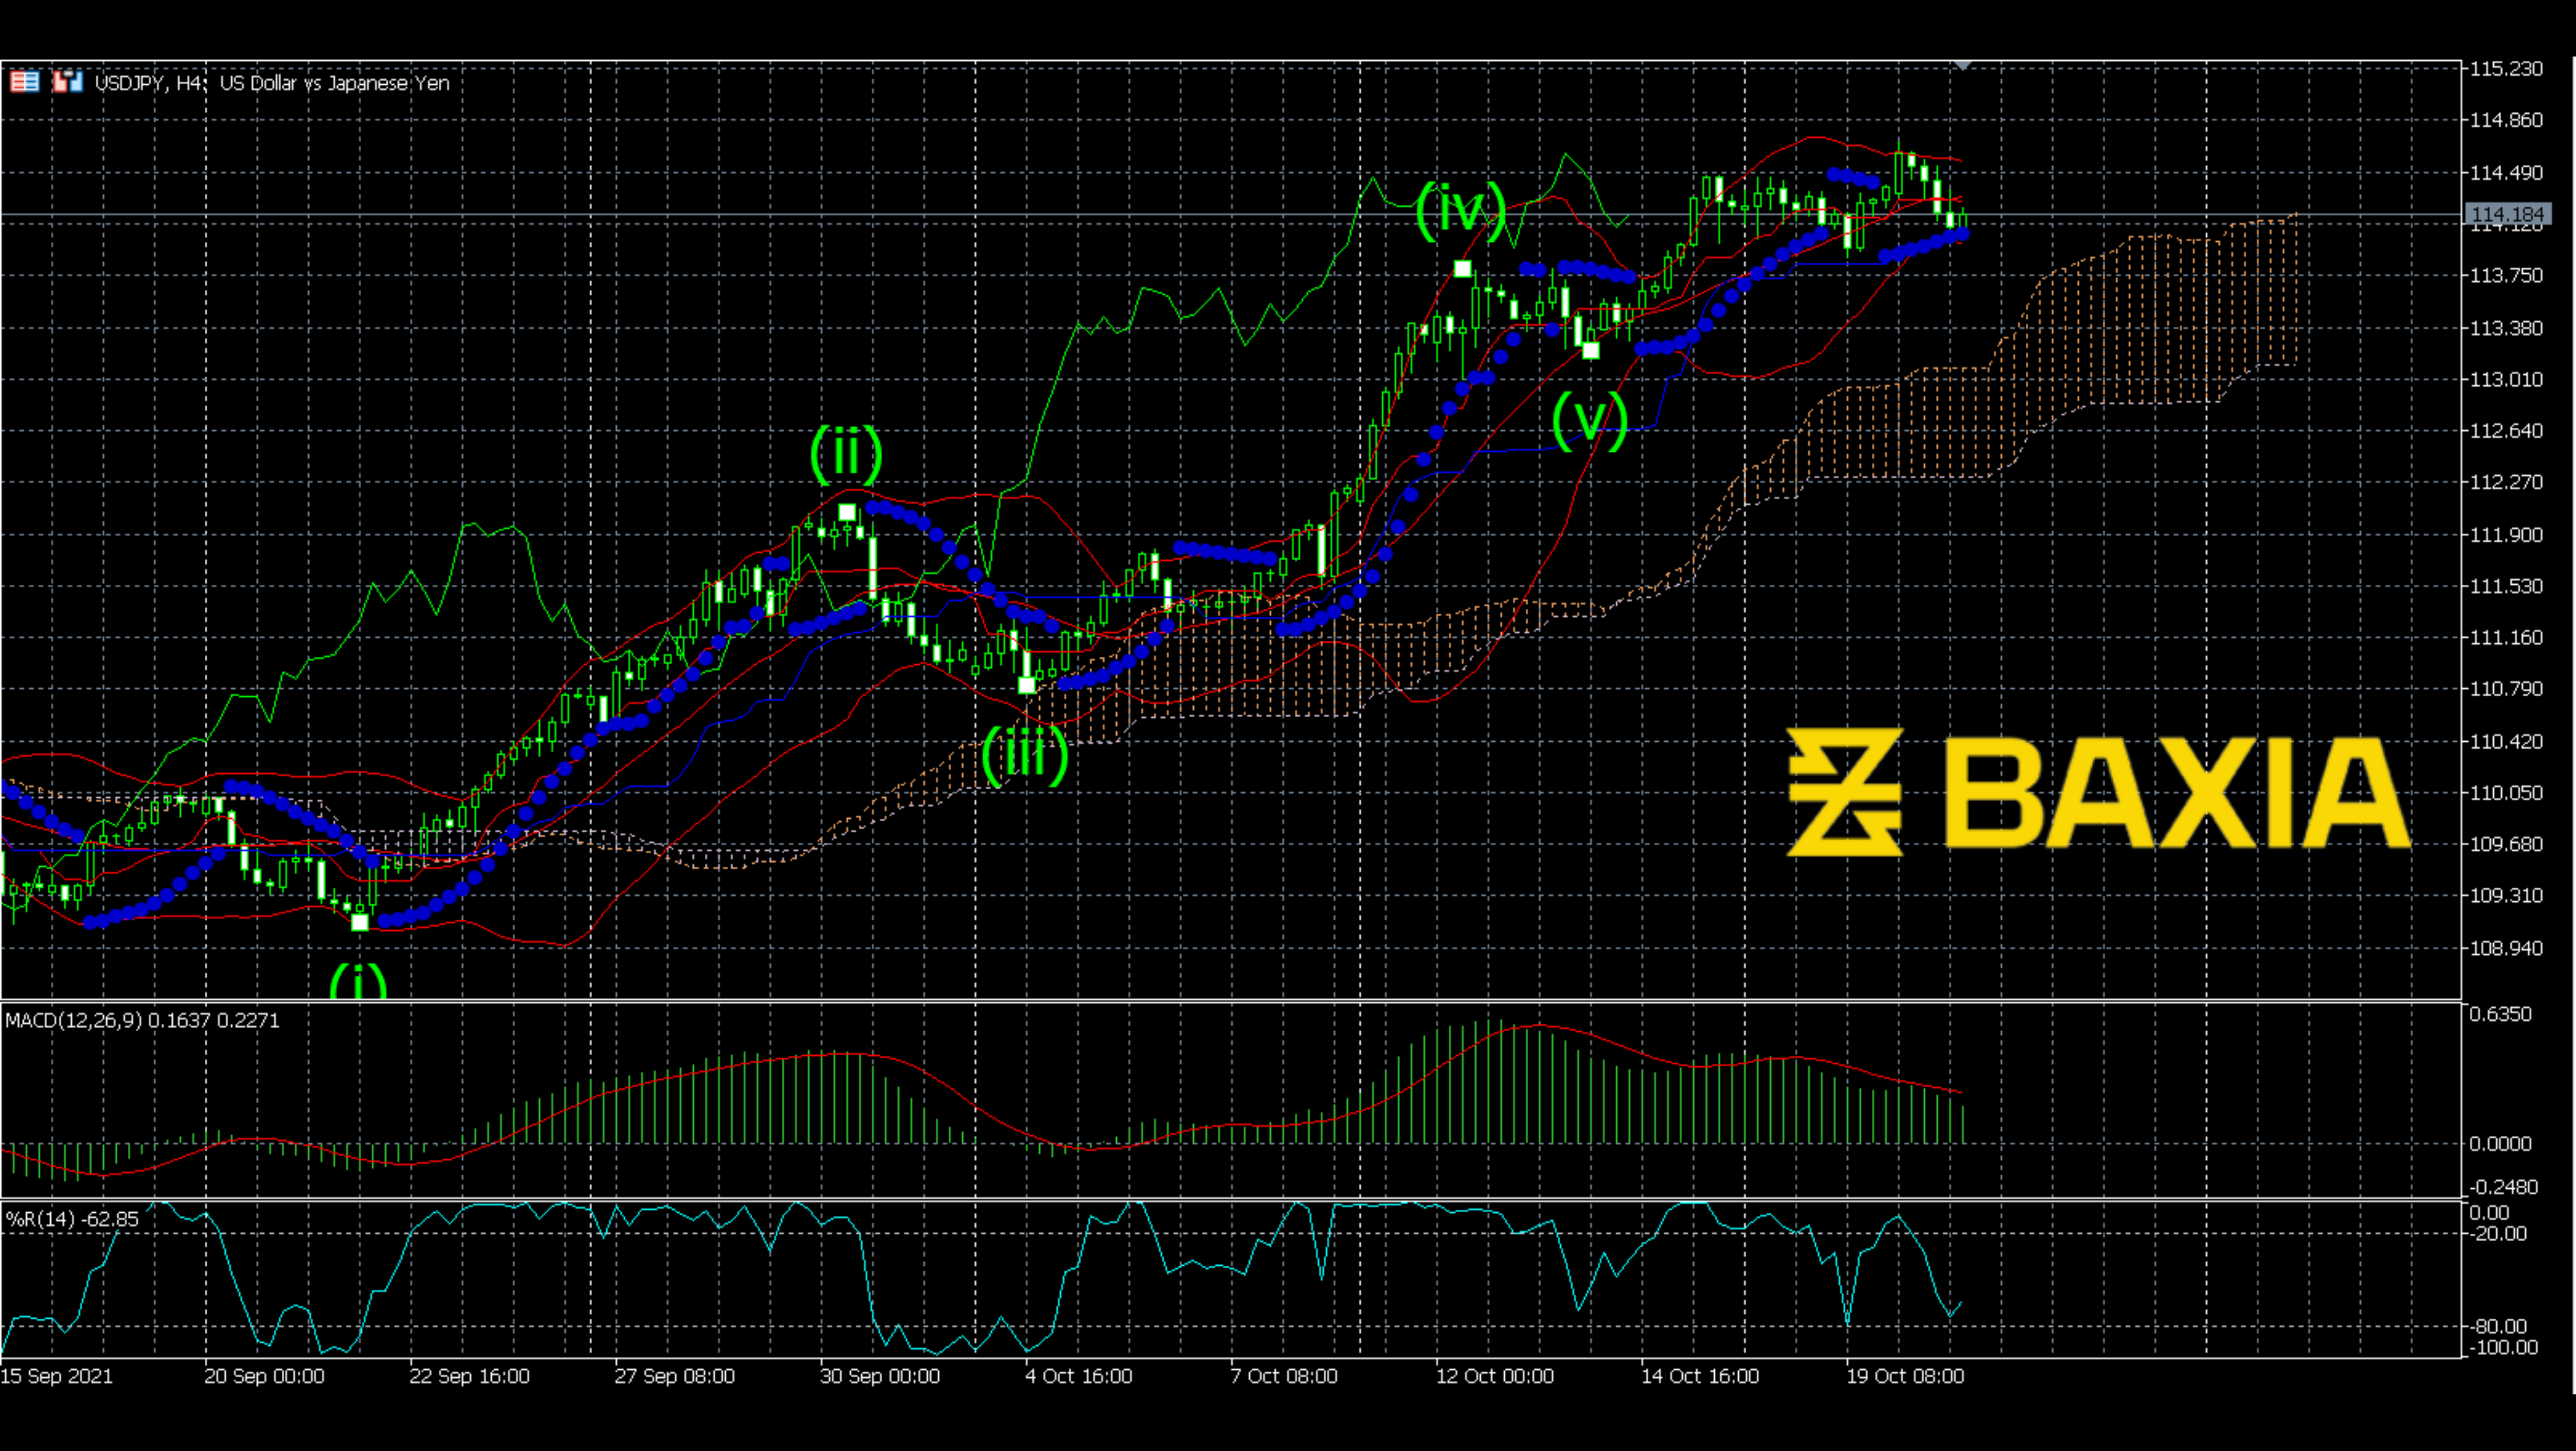
MACD already made a bearish cross; the downward trend has been moving for six days. The Bollinger Bands shrink again, which is a breakout signal. The price may crash down at any time. Although the price line still moves above the Ichimoku cloud, the cloud has already stopped moving. The price line could move down to the cloud soon. Parabolic SAR points are squeezed together, which is also a breakout signal. Let’s wait for the correct wave to come.
We love to hear new ideas from traders and want to know what you think!
If you like this topic and want to suggest future topics that you find helpful, let us know by clicking the ‘submit your feedback’ button below.

Trading foreign exchange on margin carries a high level of risk, and may not be suitable for all investors. Before deciding to trade foreign exchange you should carefully consider your investment objectives, level of experience, and risk appetite.
Nothing contained in this website should be construed as investment advice. Any reference to an investment's past or potential performance is not, and should not be construed as, a recommendation or as a guarantee of any specific outcome or profit.