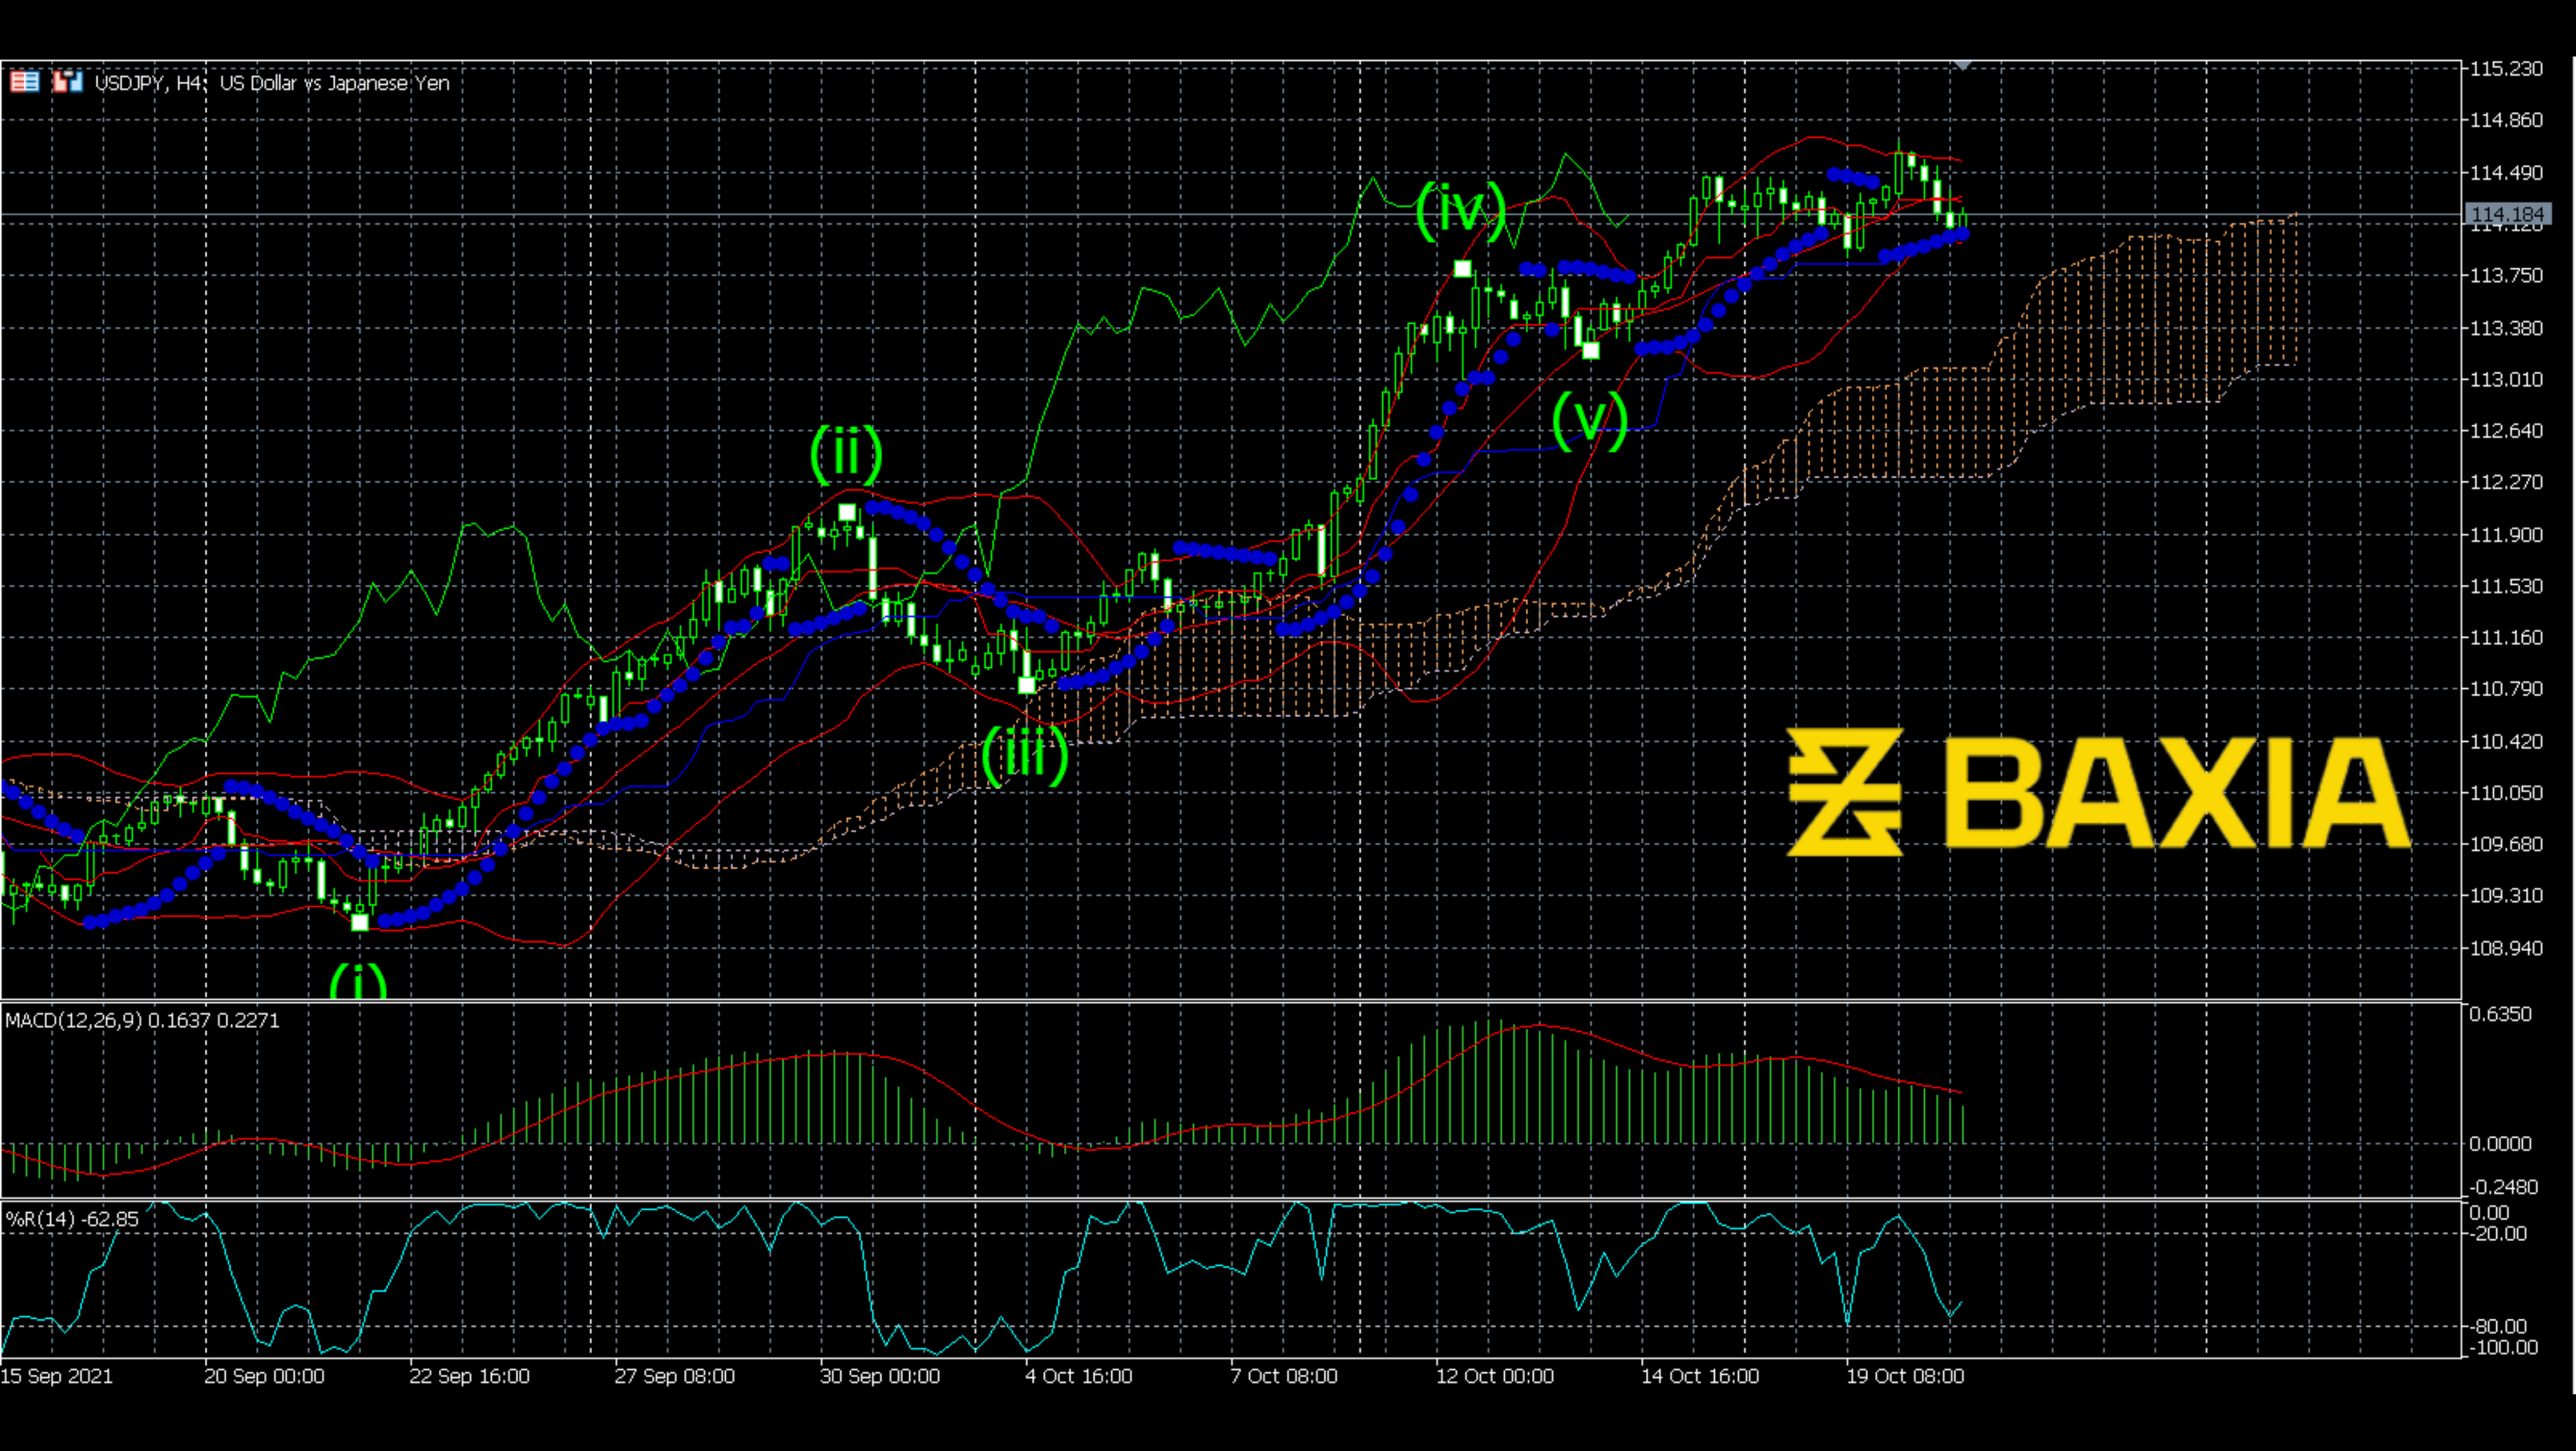

As can be seen, after the Elliott imposed wave, the price line stopped going up on Oct 10, which was expected because we assumed that a correct wave would come after that. The correct wave usually comes after Elliott imposes a wave; this correct wave would draw the price down from the high-level step by step. So, will the correct wave show up this time?
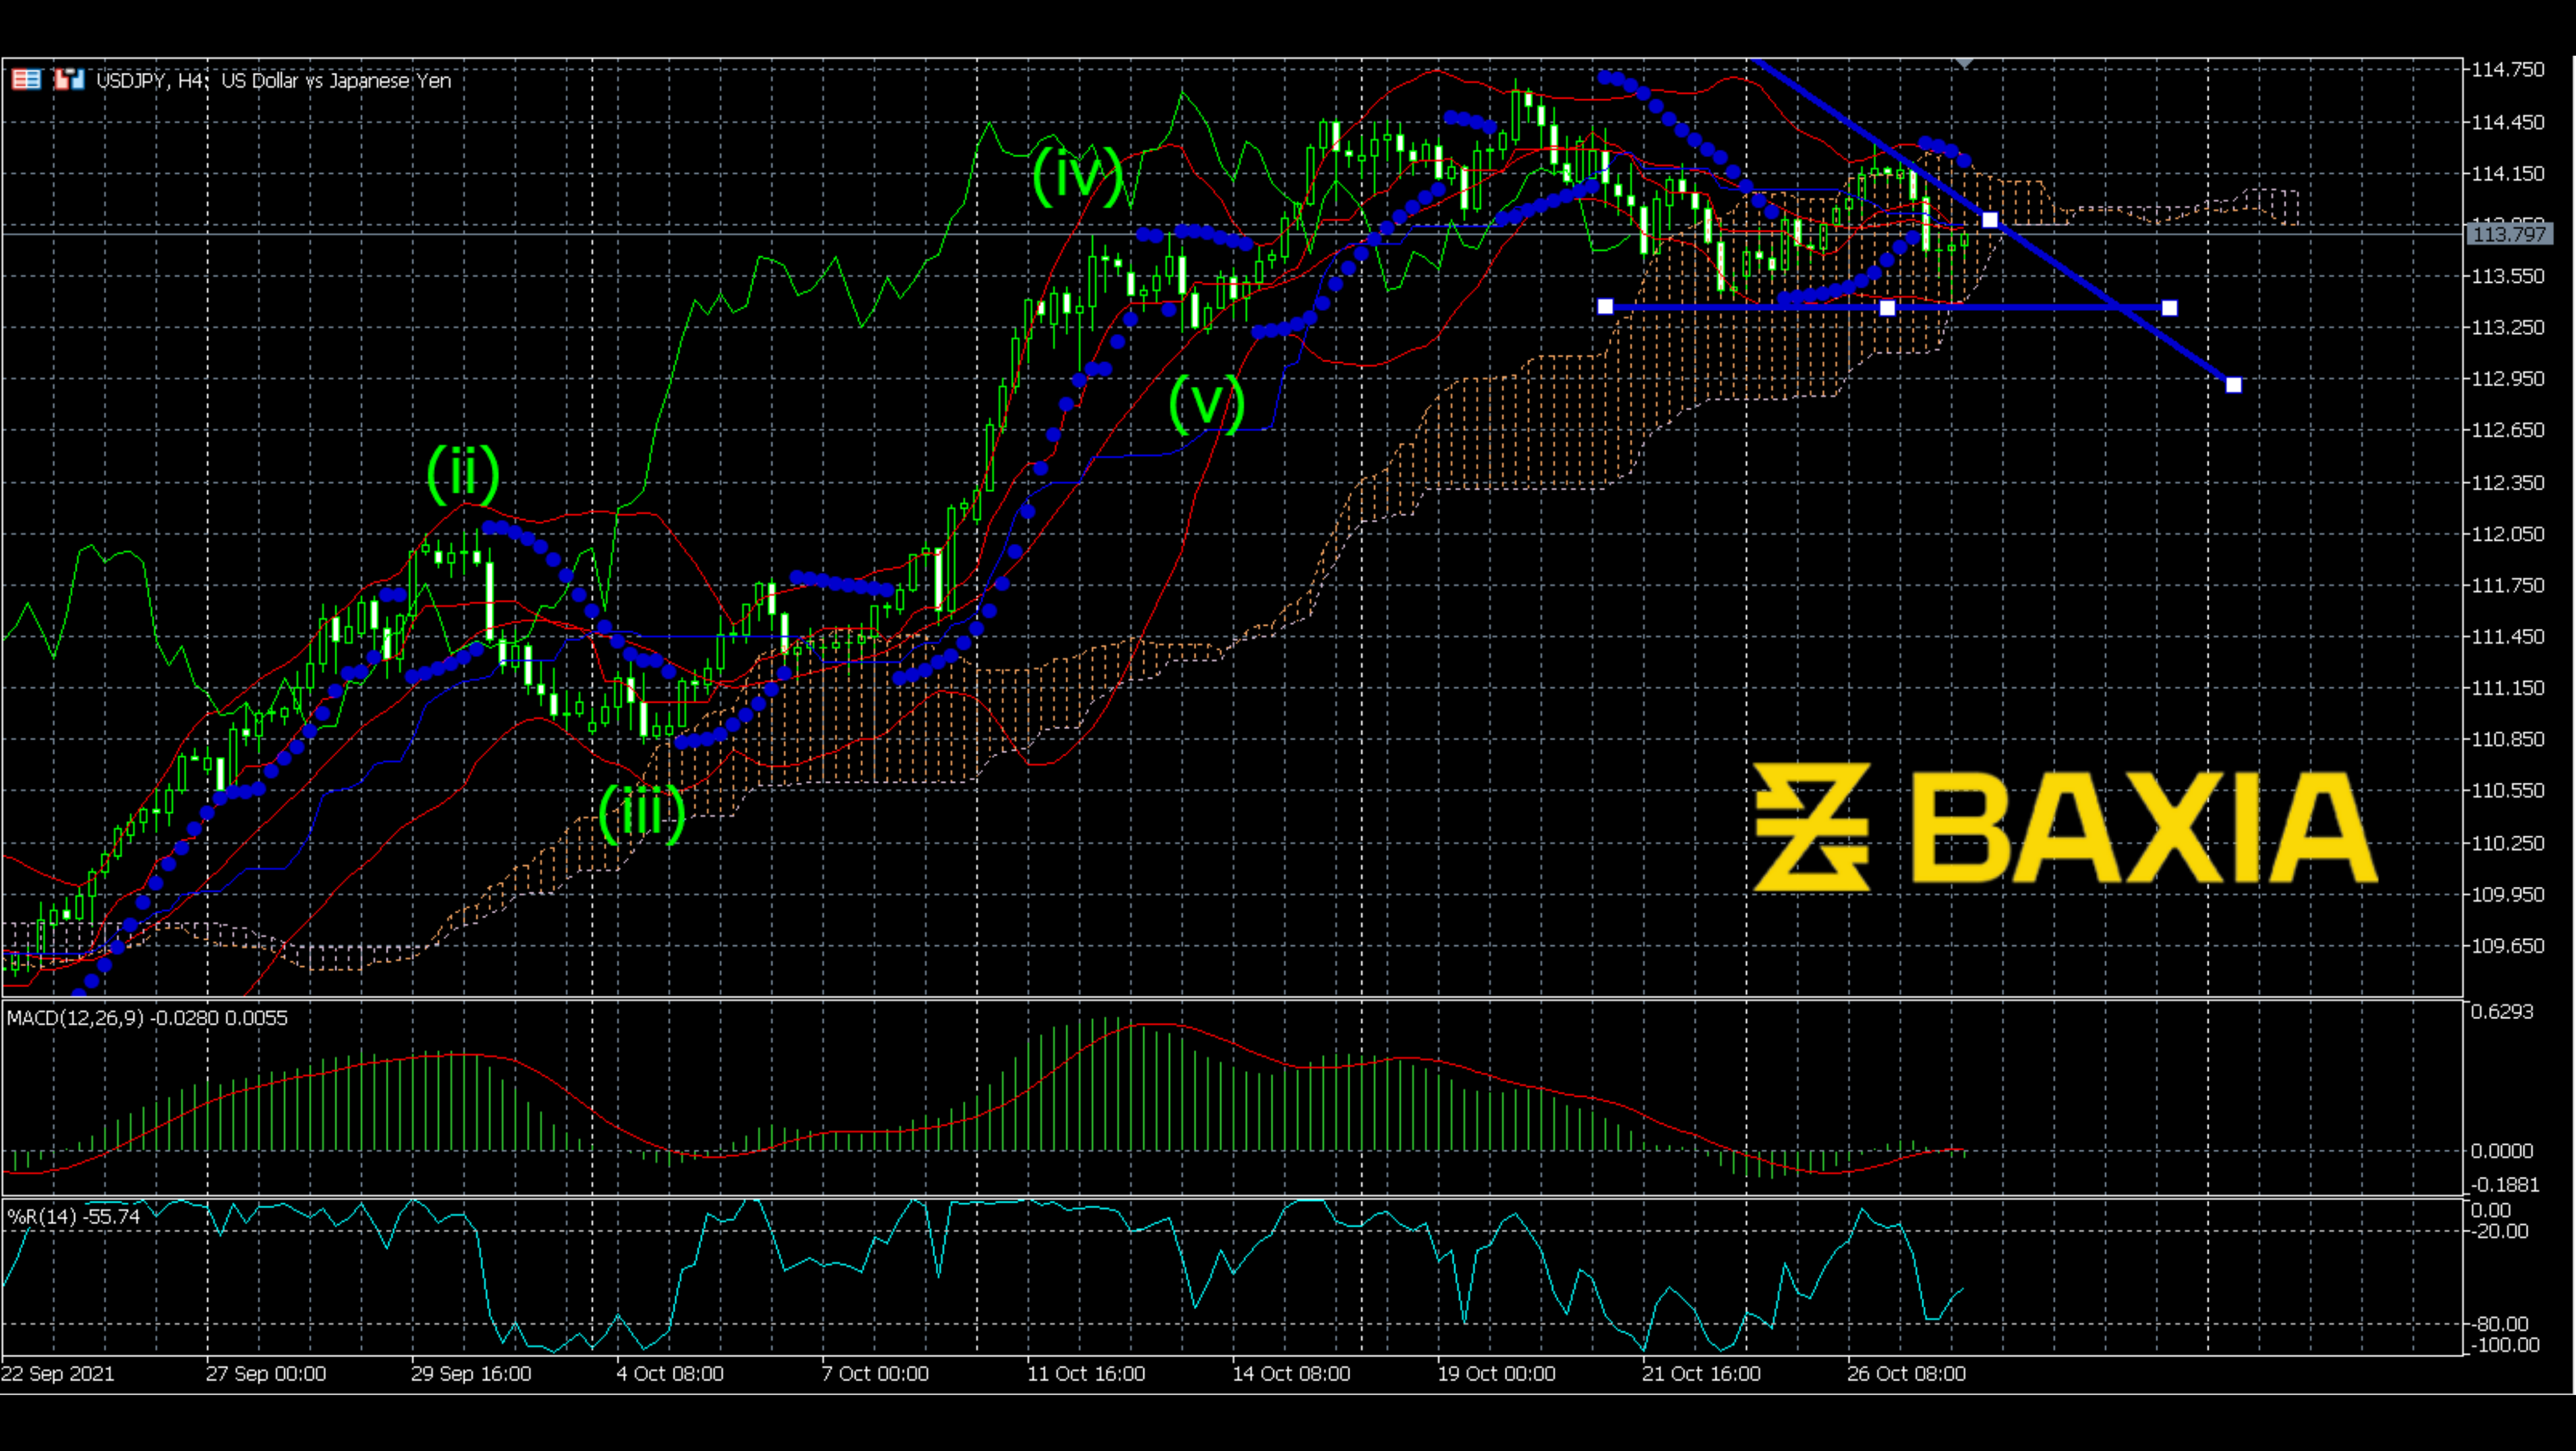
We already have some signals right now. The price line entered the Ichimoku cloud; the cloud became thinner. This was a breakout signal that the price could move below the cloud soon. Also, we can see that the price just made a small descending triangle there, which was considered a bearish signal too. Although the MACD twisted around the zero level, it showed a bearish cross recently. Williams R% moved down from the overbought level; now it moves below 40 level, which means a bearish signal. We have such a few bearish signals, let’s wait for the downward trend to come.
We love to hear new ideas from traders and want to know what you think!
If you like this topic and want to suggest future topics that you find helpful, let us know by clicking the ‘submit your feedback’ button below.

Trading foreign exchange on margin carries a high level of risk, and may not be suitable for all investors. Before deciding to trade foreign exchange you should carefully consider your investment objectives, level of experience, and risk appetite.
Nothing contained in this website should be construed as investment advice. Any reference to an investment's past or potential performance is not, and should not be construed as, a recommendation or as a guarantee of any specific outcome or profit.