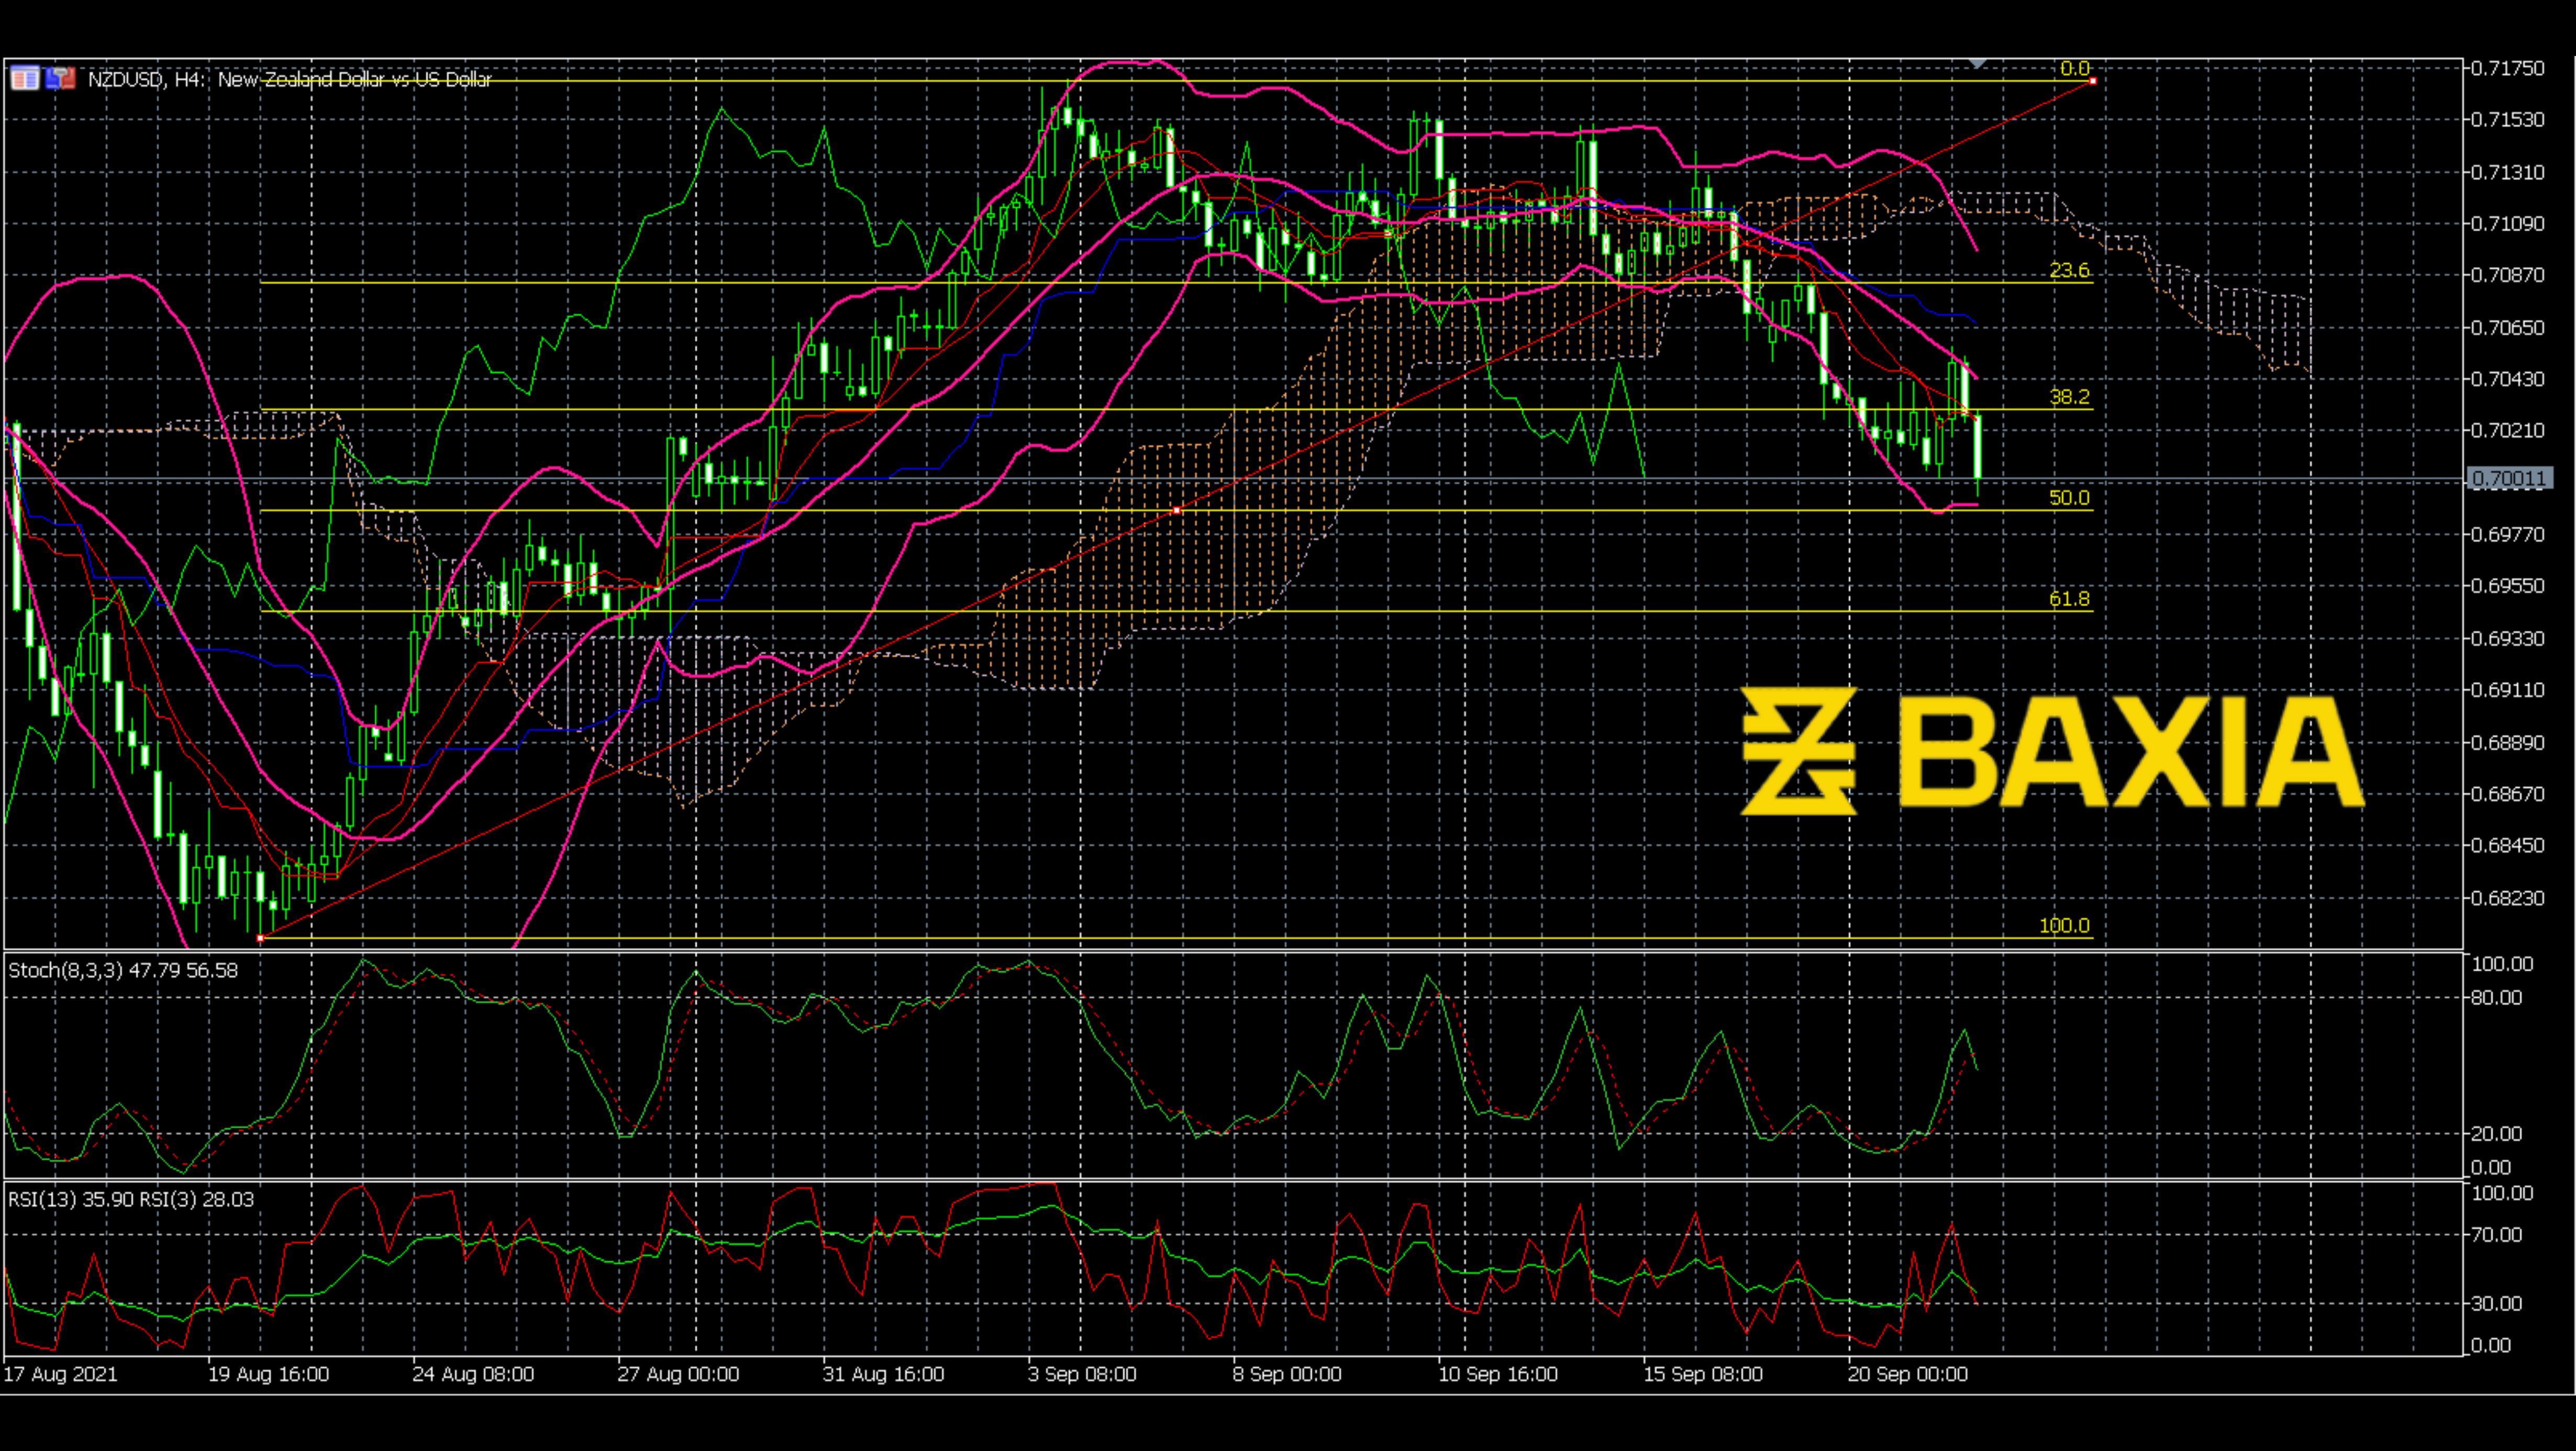

After eight days of upward movement, the price met the resistance on Sep 30th. As can be seen from the 4-hour chart, the upward trend was comparatively solid and had lasted for a long time; it moved in almost the same slope and same fluctuation, which was supposed to be hard to stop; however, it still met resistance now.
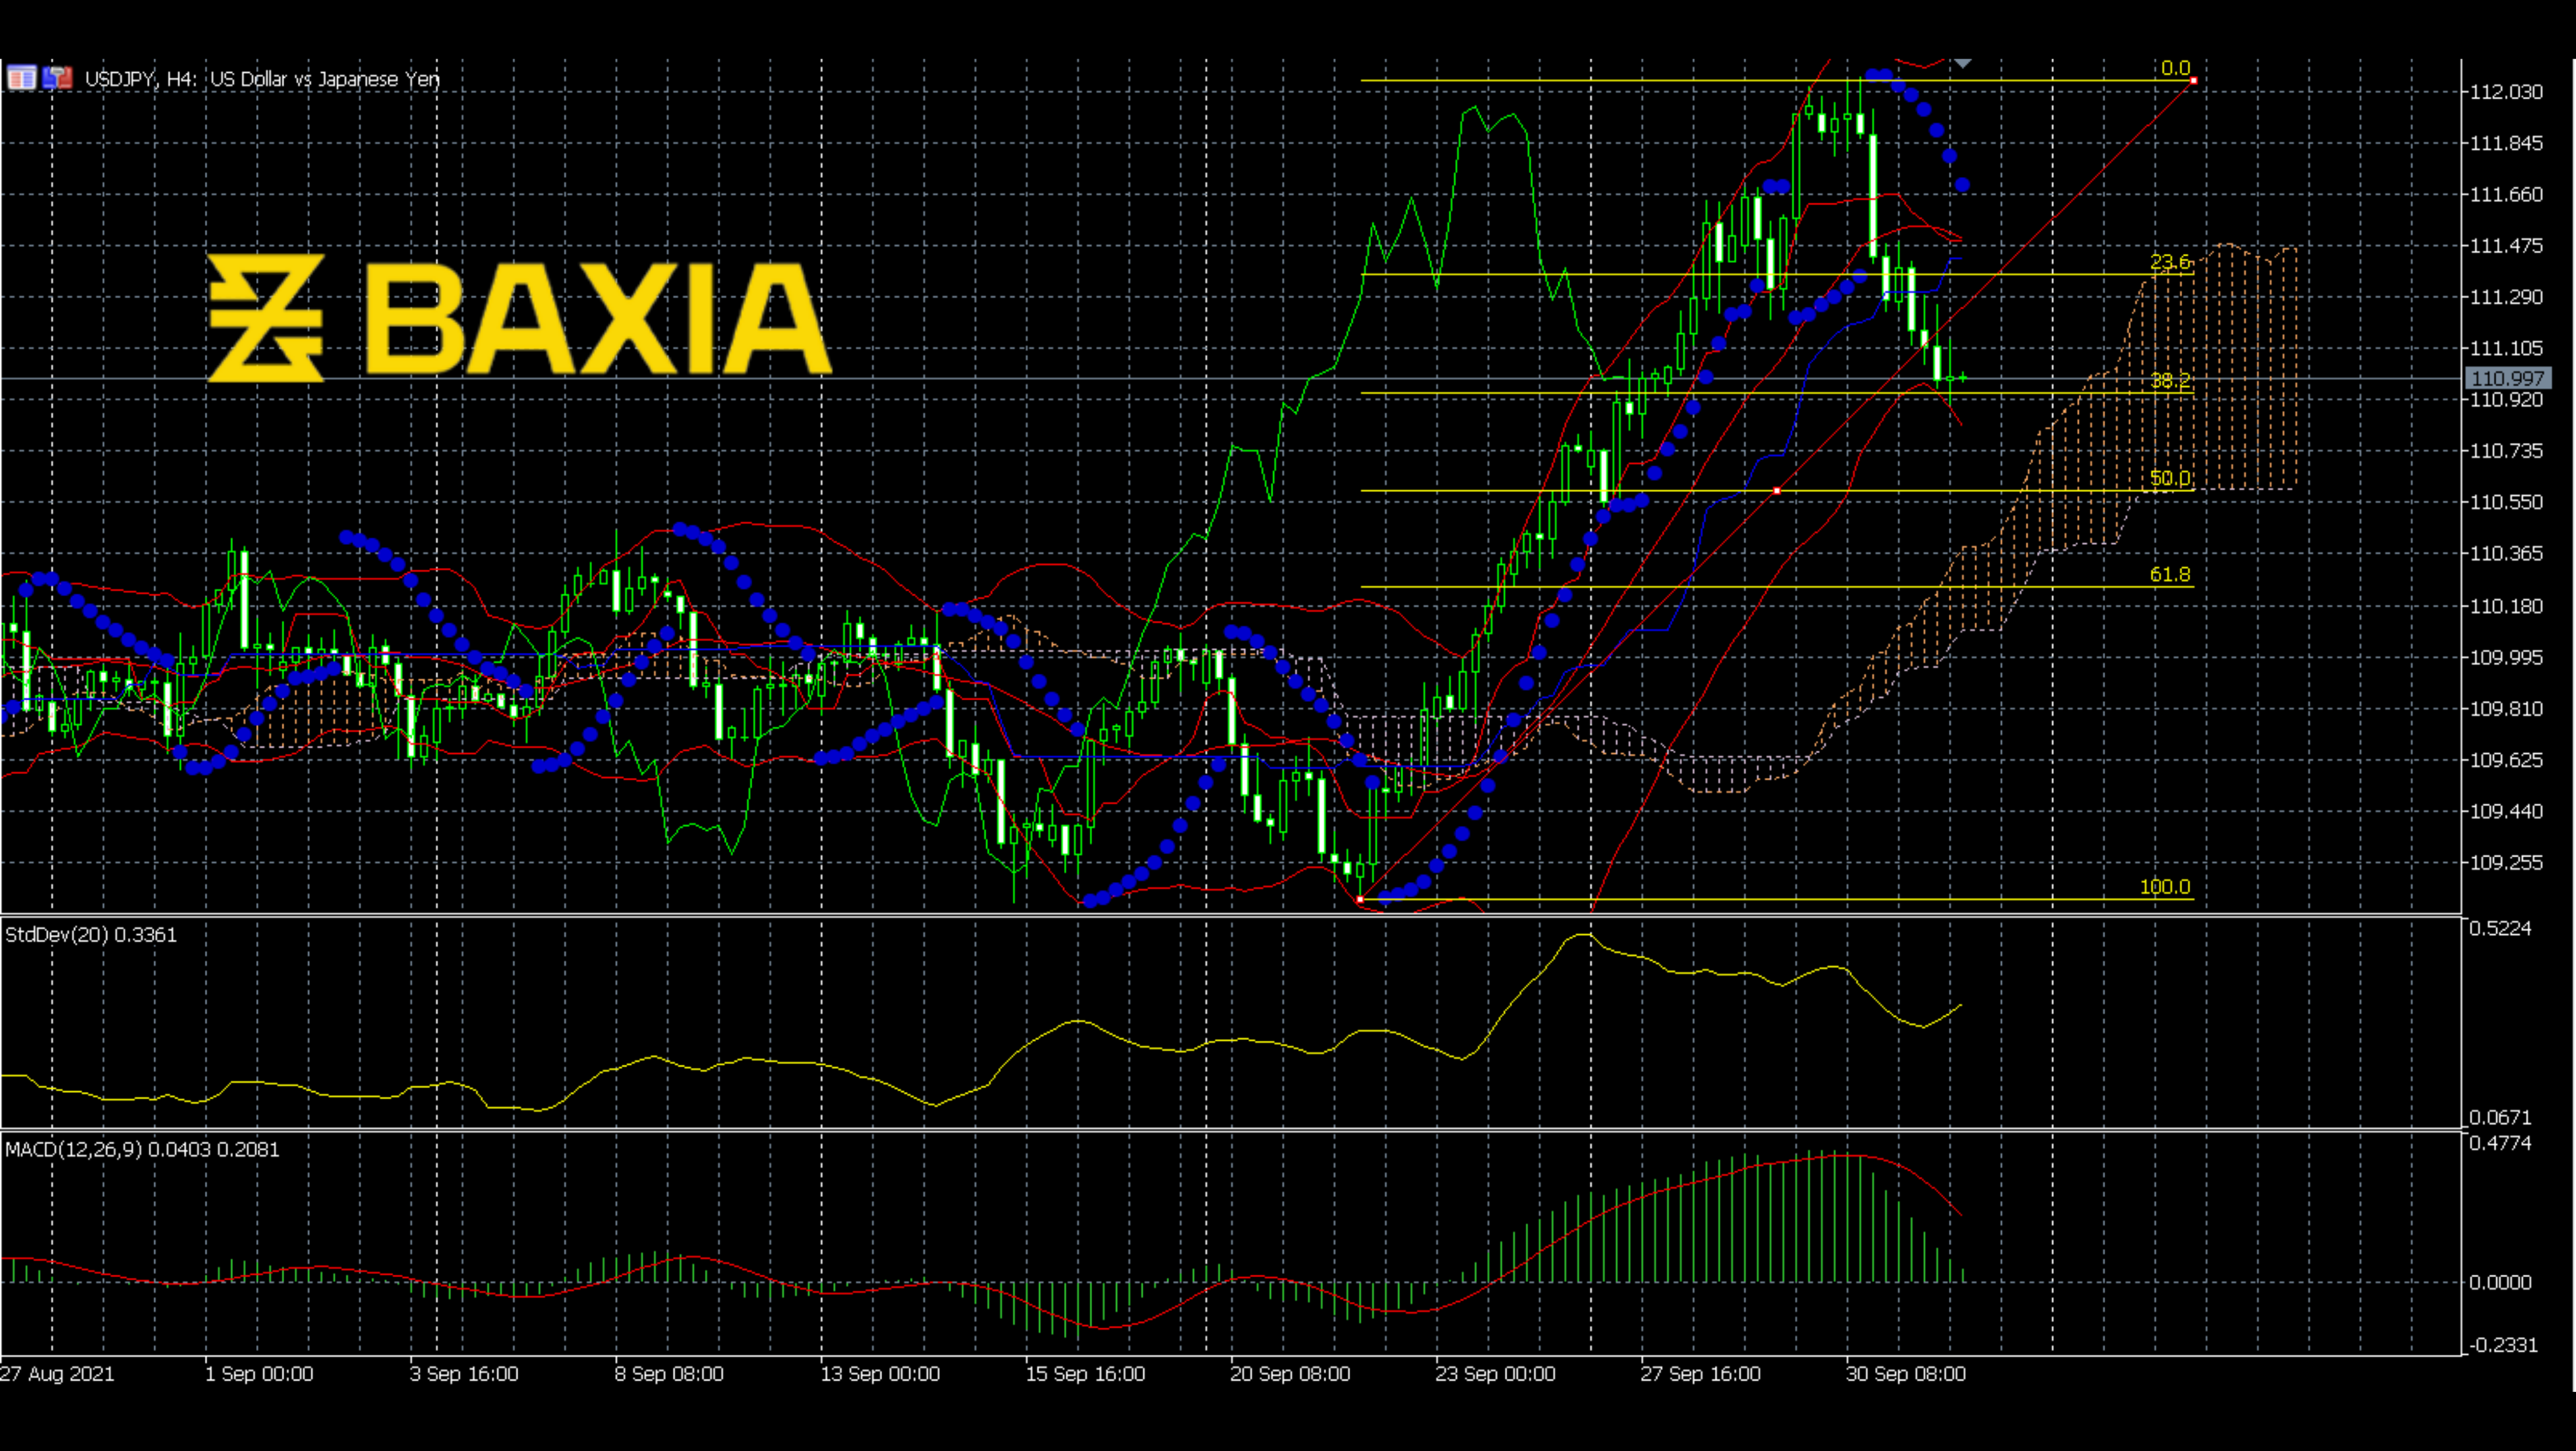
Recently, the price has dropped to the 38.2% level Fibonacci, which was commonly considered a pressure point; however, I would say that the price may not meet support here. The Ichimoku has already become thick, which means the trend of the price could be solid. Also, the cloud still goes up now. The standard deviation goes down a little, which means the trend could become solid here. The MACD already made a dead cross and went down. The long trend cannot be seen from just one fluctuation; however, the downward trend could continue.
We love to hear new ideas from traders and want to know what you think!
If you like this topic and want to suggest future topics that you find helpful, let us know by clicking the ‘submit your feedback’ button below.

Trading foreign exchange on margin carries a high level of risk, and may not be suitable for all investors. Before deciding to trade foreign exchange you should carefully consider your investment objectives, level of experience, and risk appetite.
Nothing contained in this website should be construed as investment advice. Any reference to an investment's past or potential performance is not, and should not be construed as, a recommendation or as a guarantee of any specific outcome or profit.