
The upward trend that took place on Aug 4th was sharp. The slope was steep. And it happened abruptly, so not many traders were prepared. The upward trend had lasted for seven days; recently, it met resistance. Although the upward trend was sharp, it only tested the upper Bollinger Bands once. So, the Bollinger Bands did not bother the price too much. Even the resistance stopped the upward trend, and the price still moves within the Bollinger Bands.
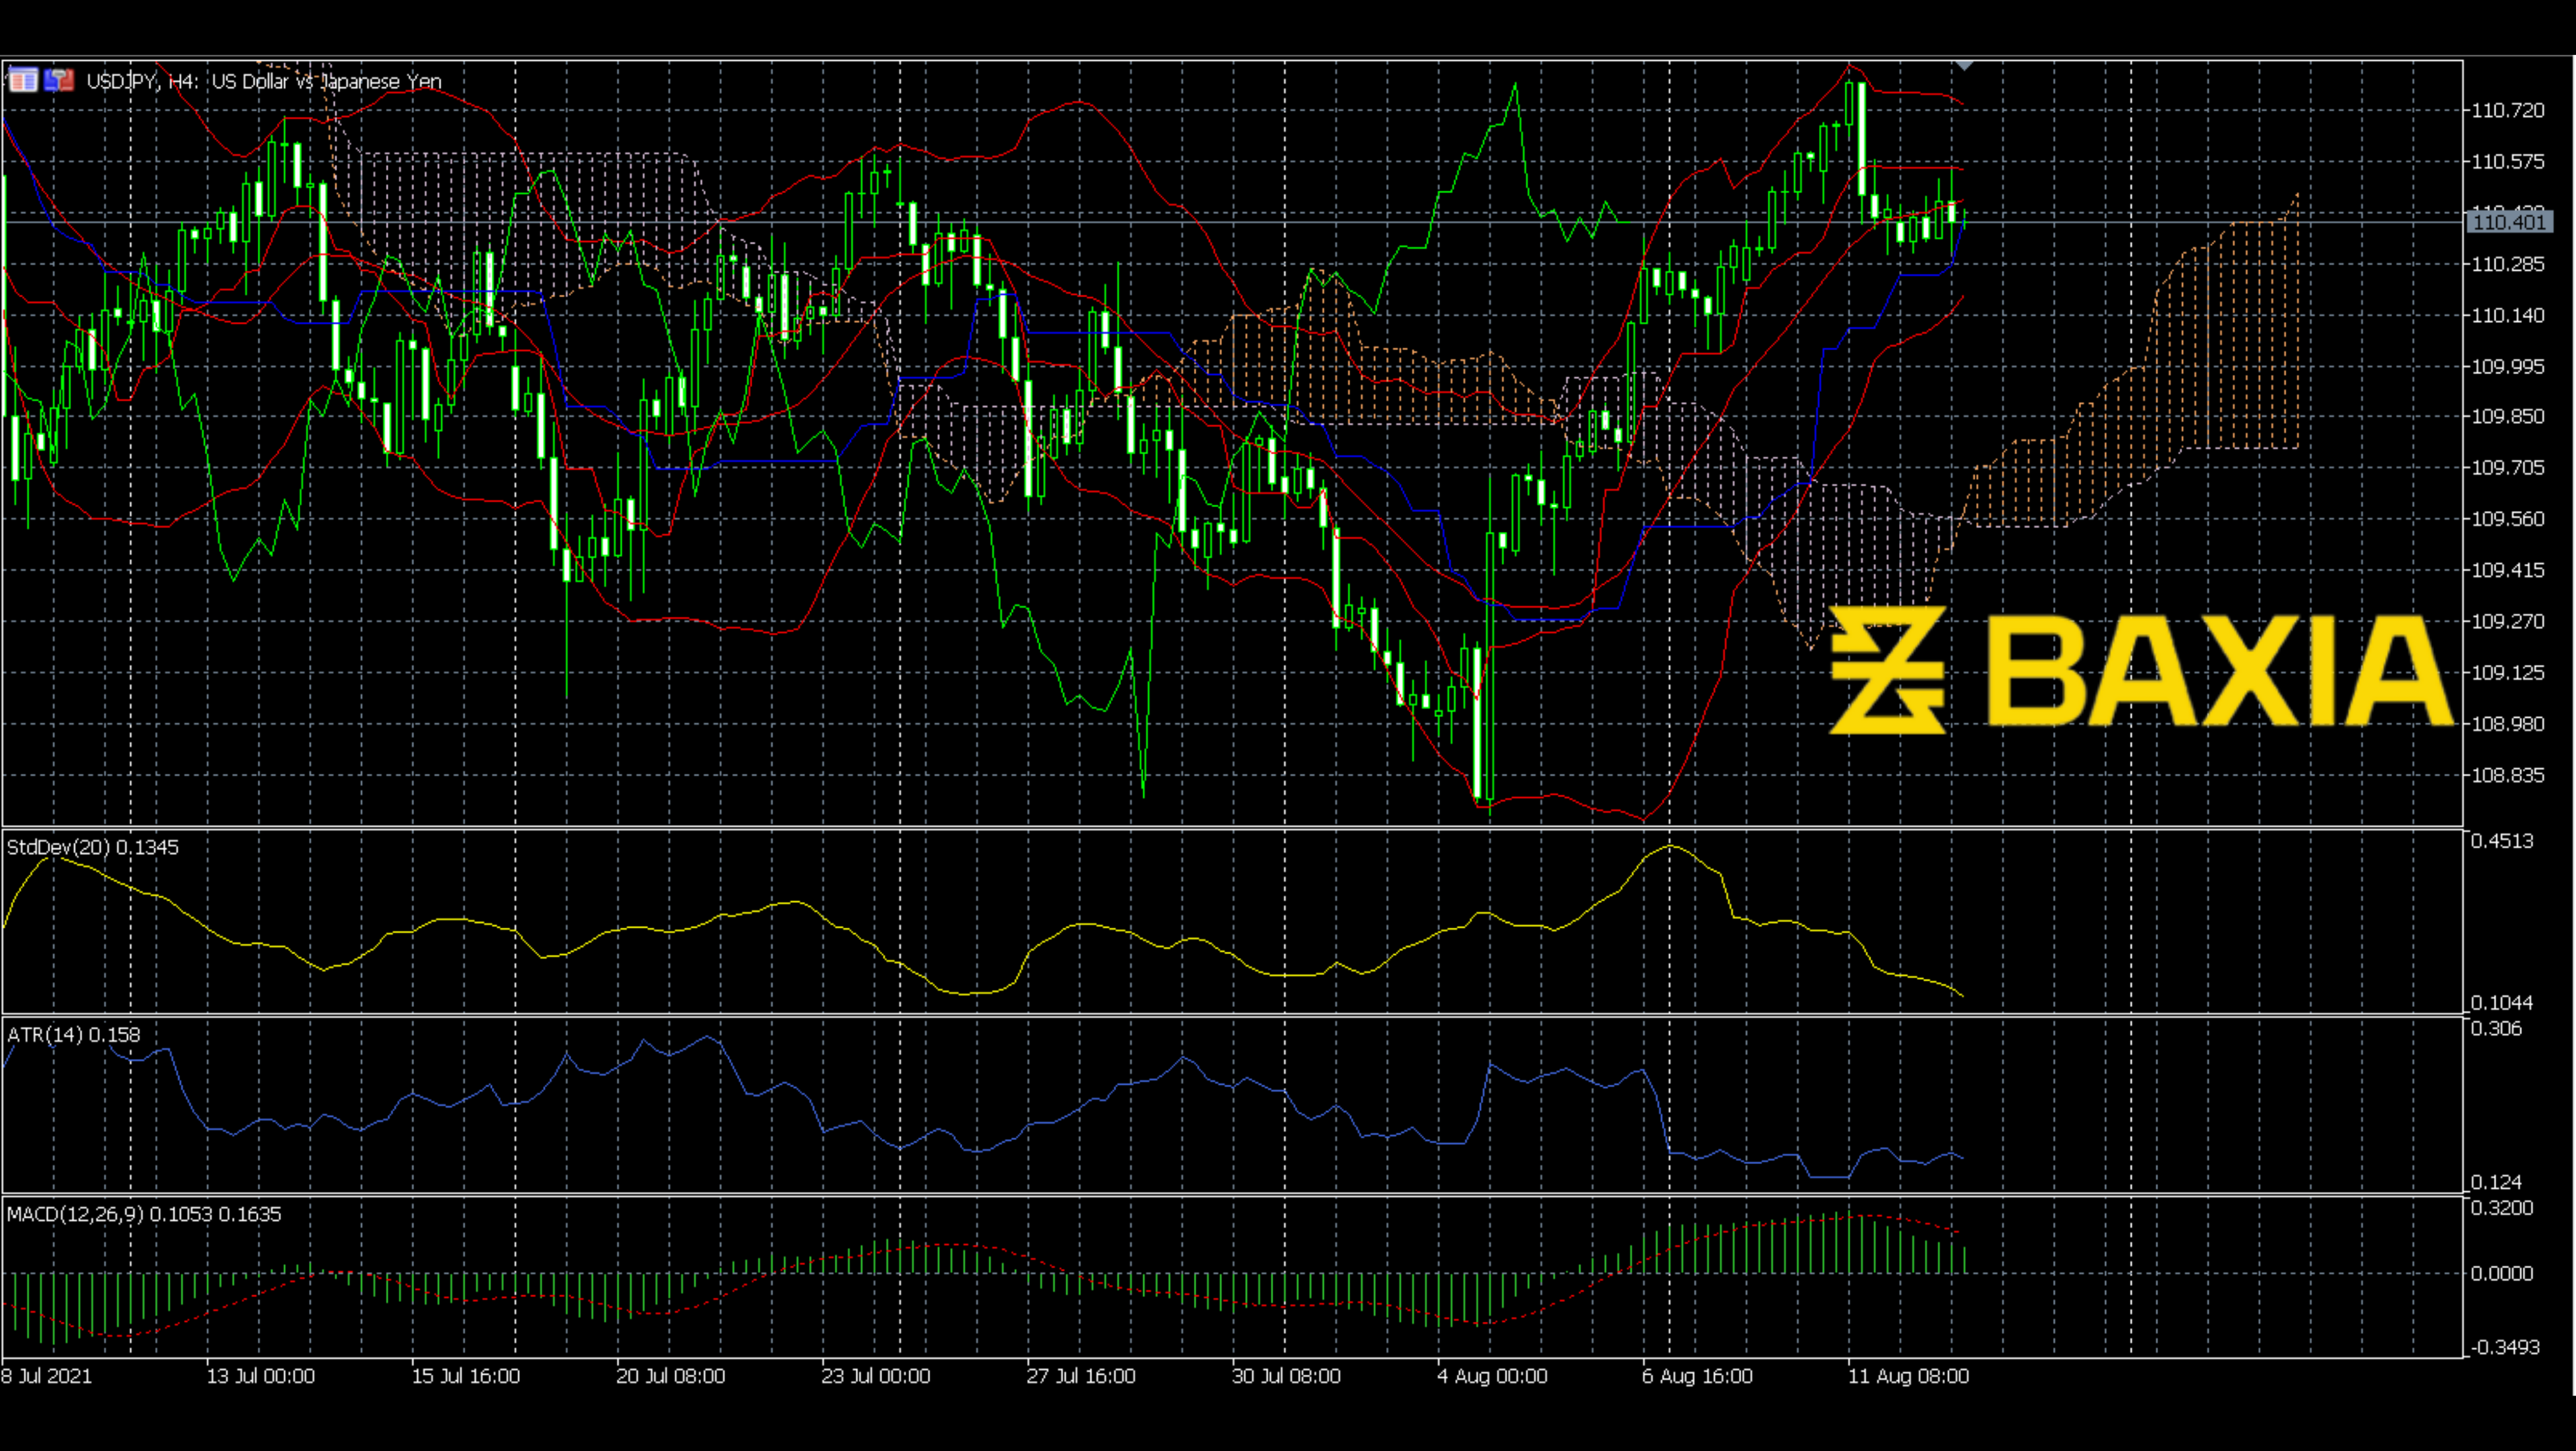
We do not know whether the resisting power is strong enough to change the direction. However, it slows down the momentum; does this mean it is the end of the resistance? Ichimoku is now below the price line; however, it could turn up soon, which is a bearish signal. The Standard Deviation and ATR both show that the price line would stay flat for a while. I understand that the price would struggle here so that the price line would not fluctuate too much. The MACD still moves down, and the downward trend on MACD seems to continue.
We love to hear new ideas from traders and want to know what you think!
If you like this topic and want to suggest future topics that you find helpful, let us know by clicking the ‘submit your feedback’ button below.

Trading foreign exchange on margin carries a high level of risk, and may not be suitable for all investors. Before deciding to trade foreign exchange you should carefully consider your investment objectives, level of experience, and risk appetite.
Nothing contained in this website should be construed as investment advice. Any reference to an investment's past or potential performance is not, and should not be construed as, a recommendation or as a guarantee of any specific outcome or profit.