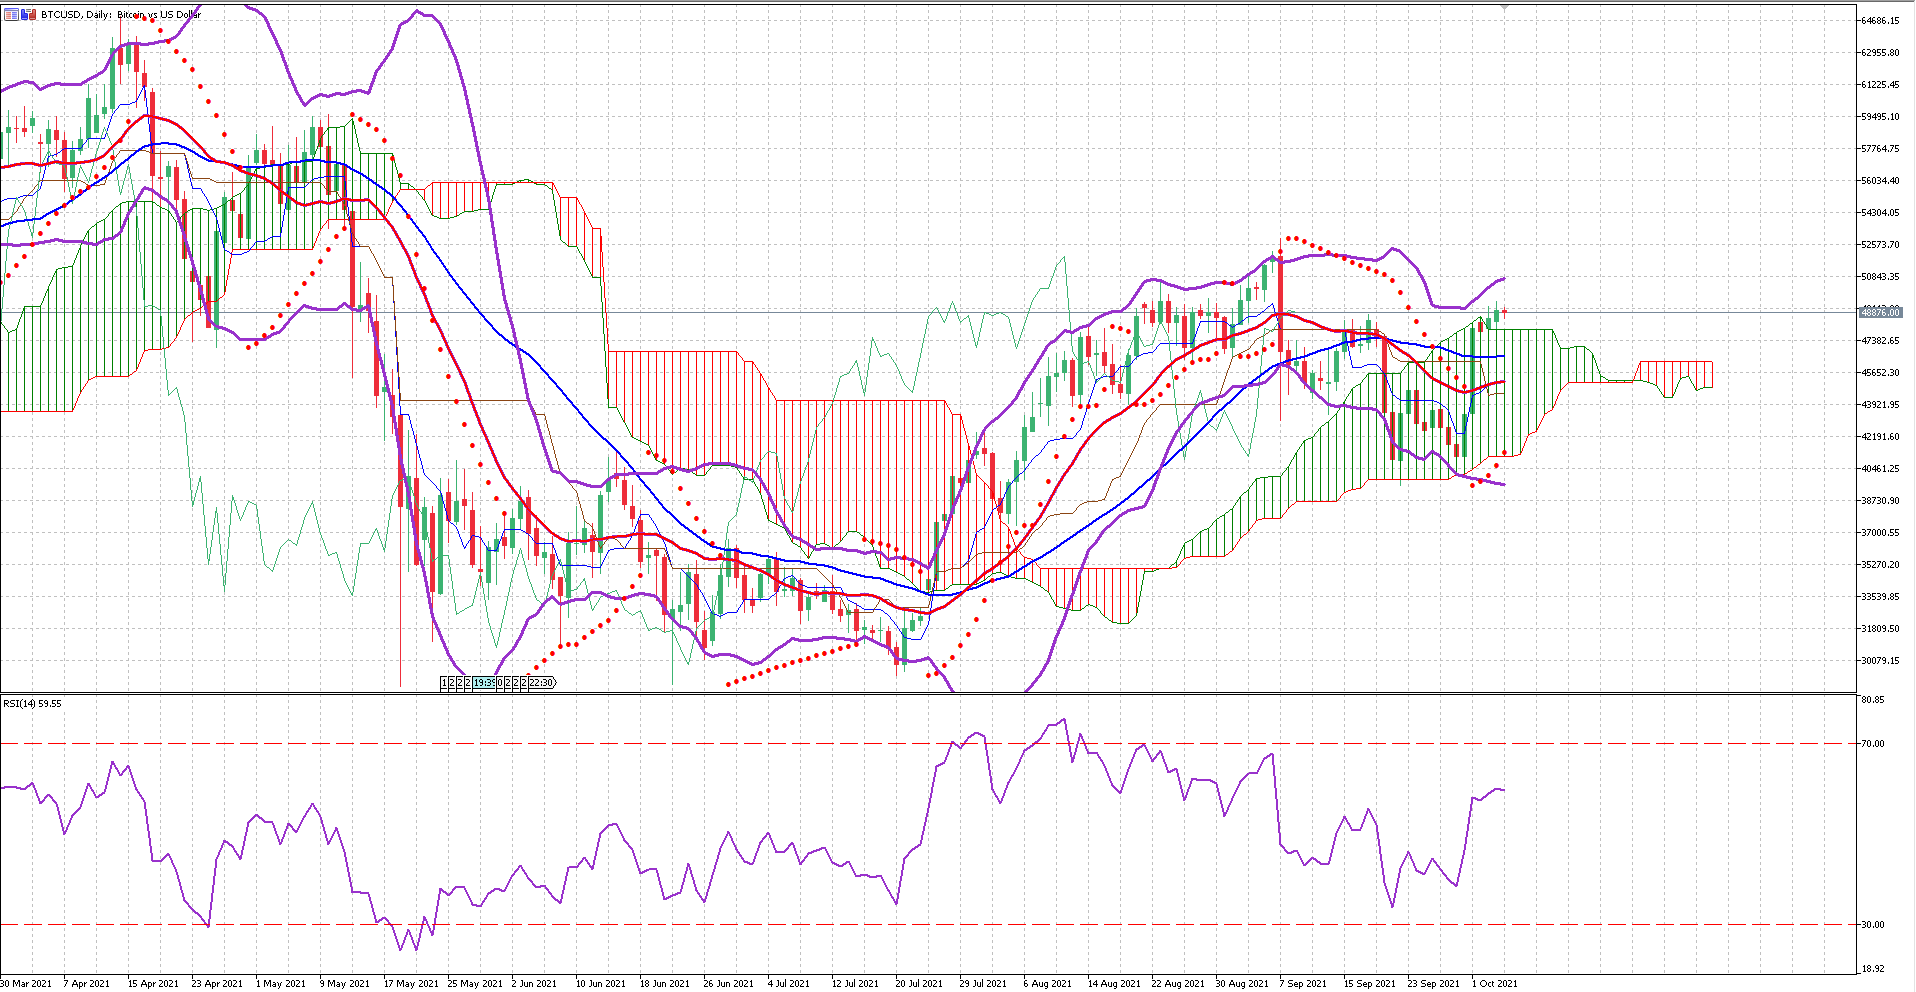

The significant drop on July 8th was a shock to a lot of traders. Although the price was in a downward trend, the sharp drop took place after a minor retracement. This huge drop pushed the price down and broke out the lower Bollinger Band. Even the SAR Parabolic could not catch the price line.
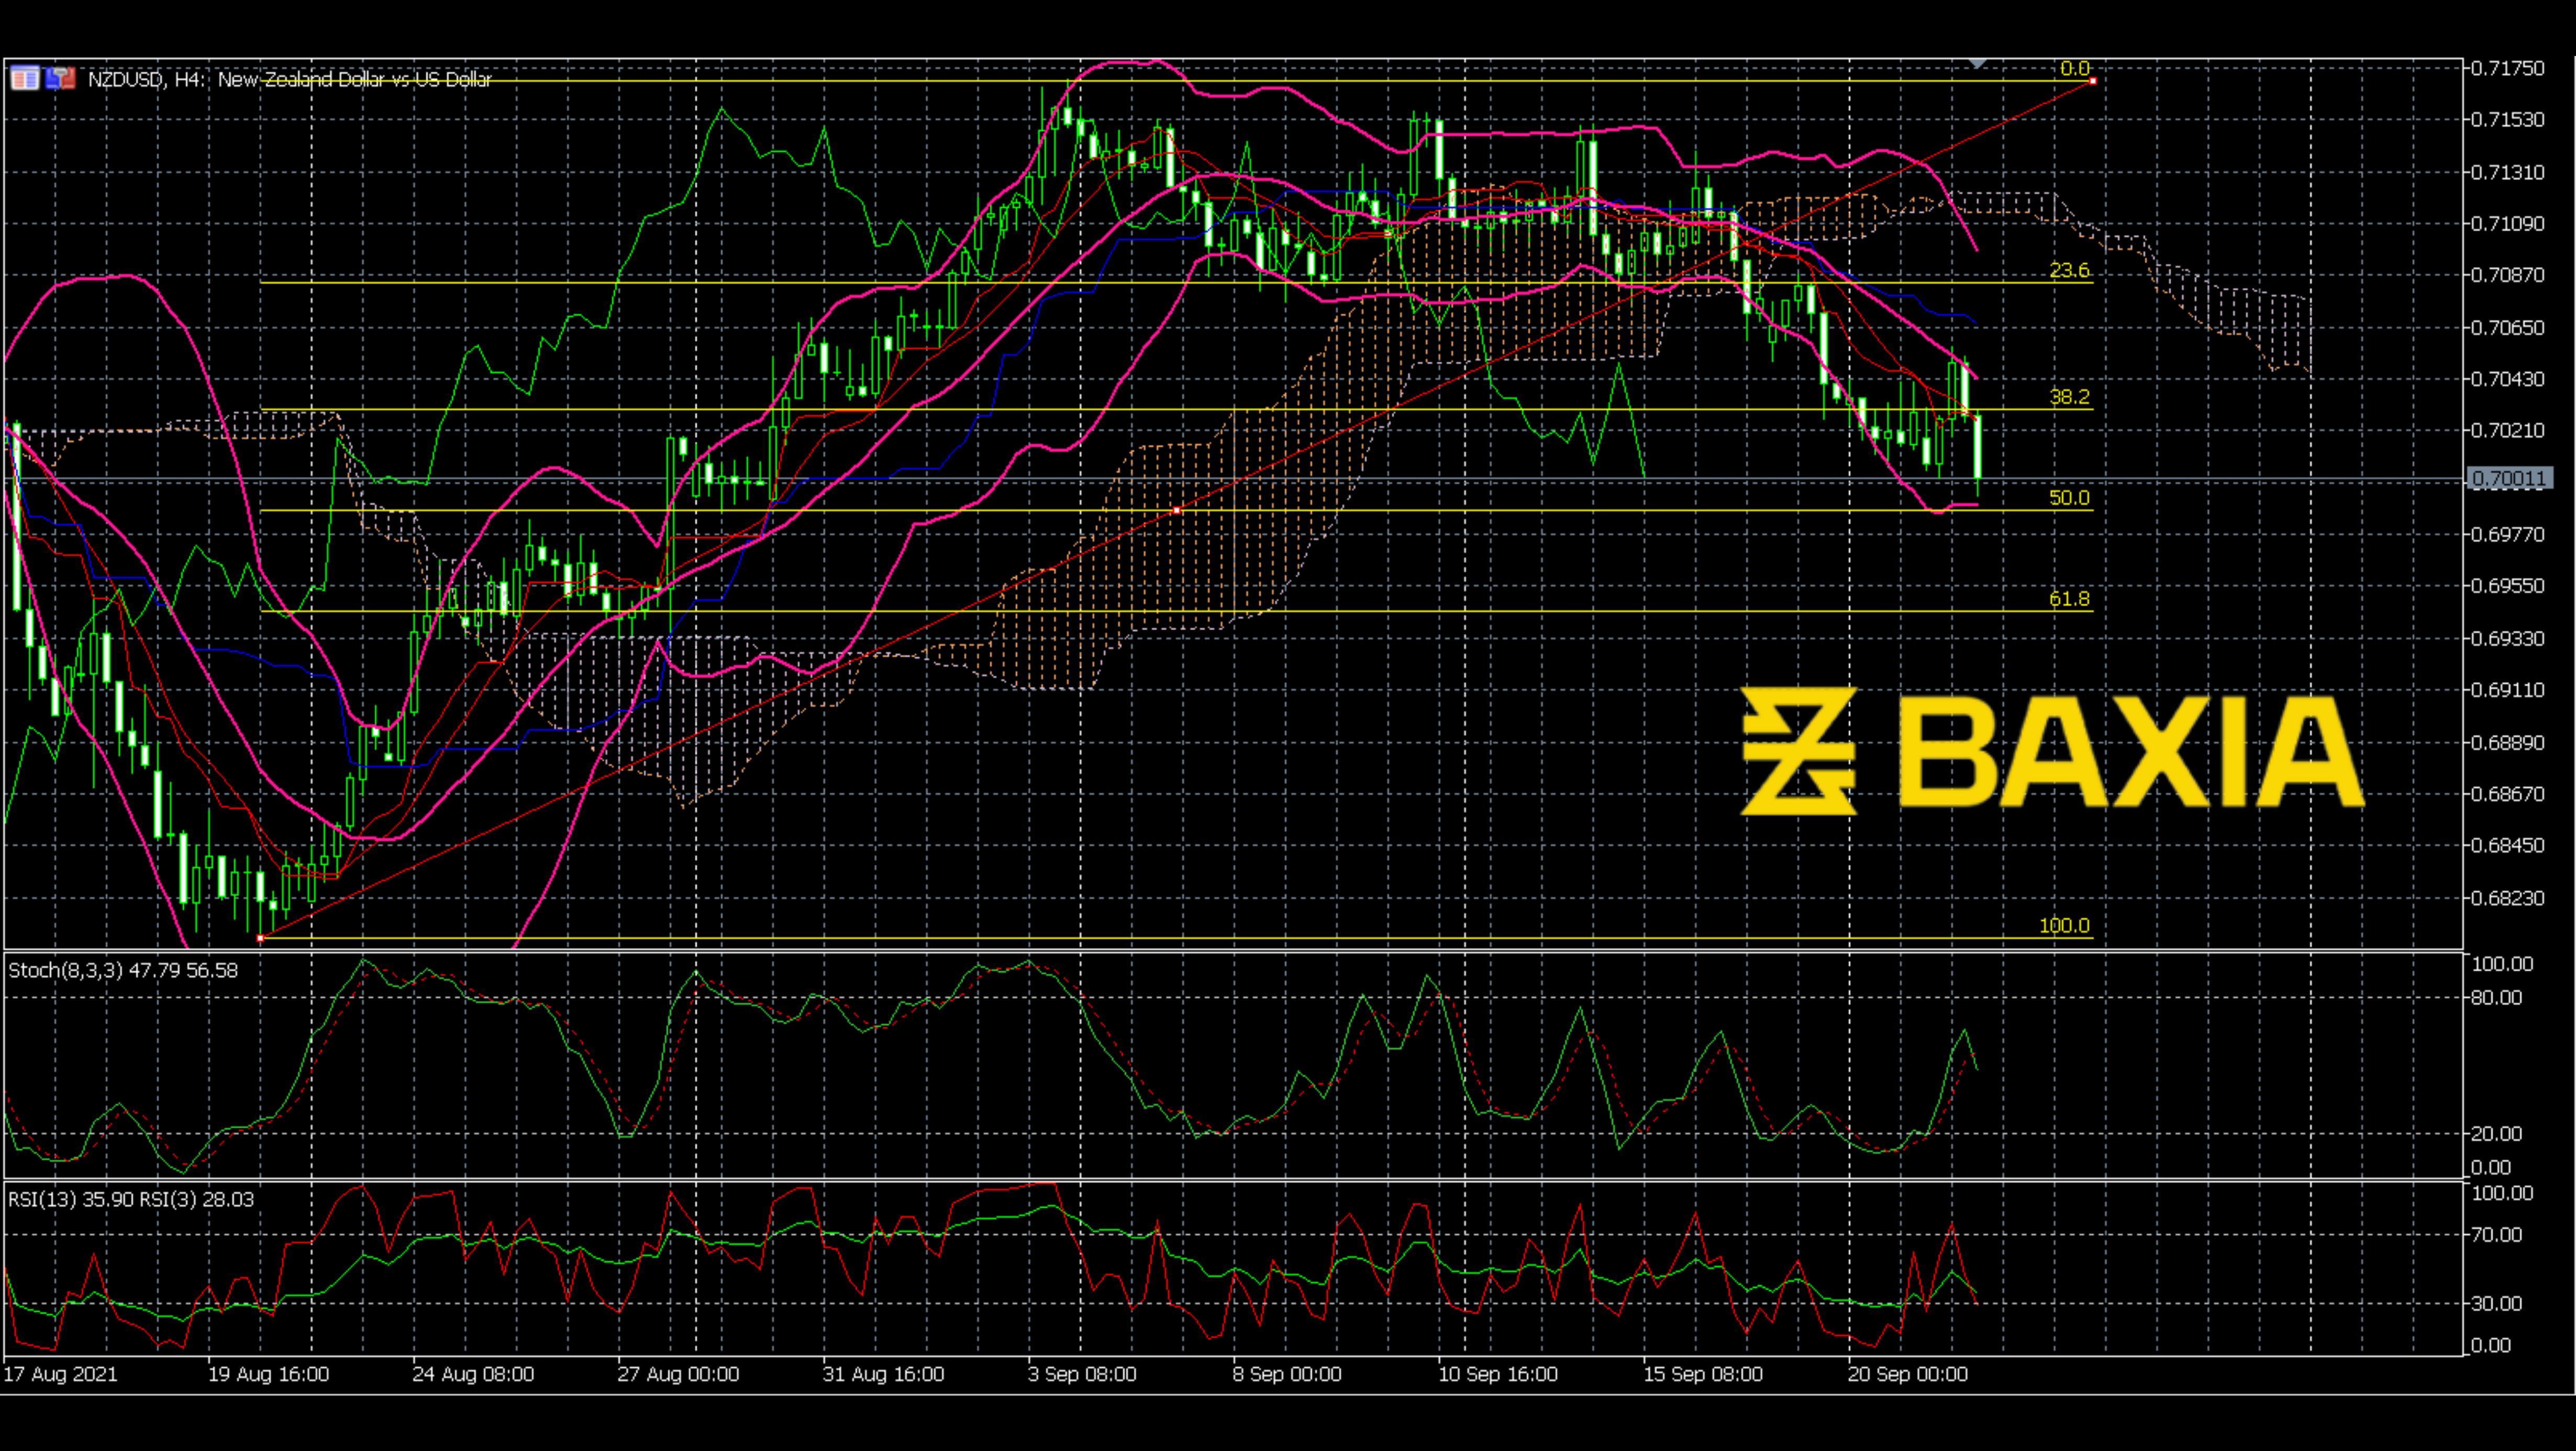
The price started to bounce back when it touched the lower Bollinger Band; it reached the 38.2% Fibonacci level recently. As we know, the 38.2% level Fibonacci is a resistant level with pressure power; could this resistance stop the price?
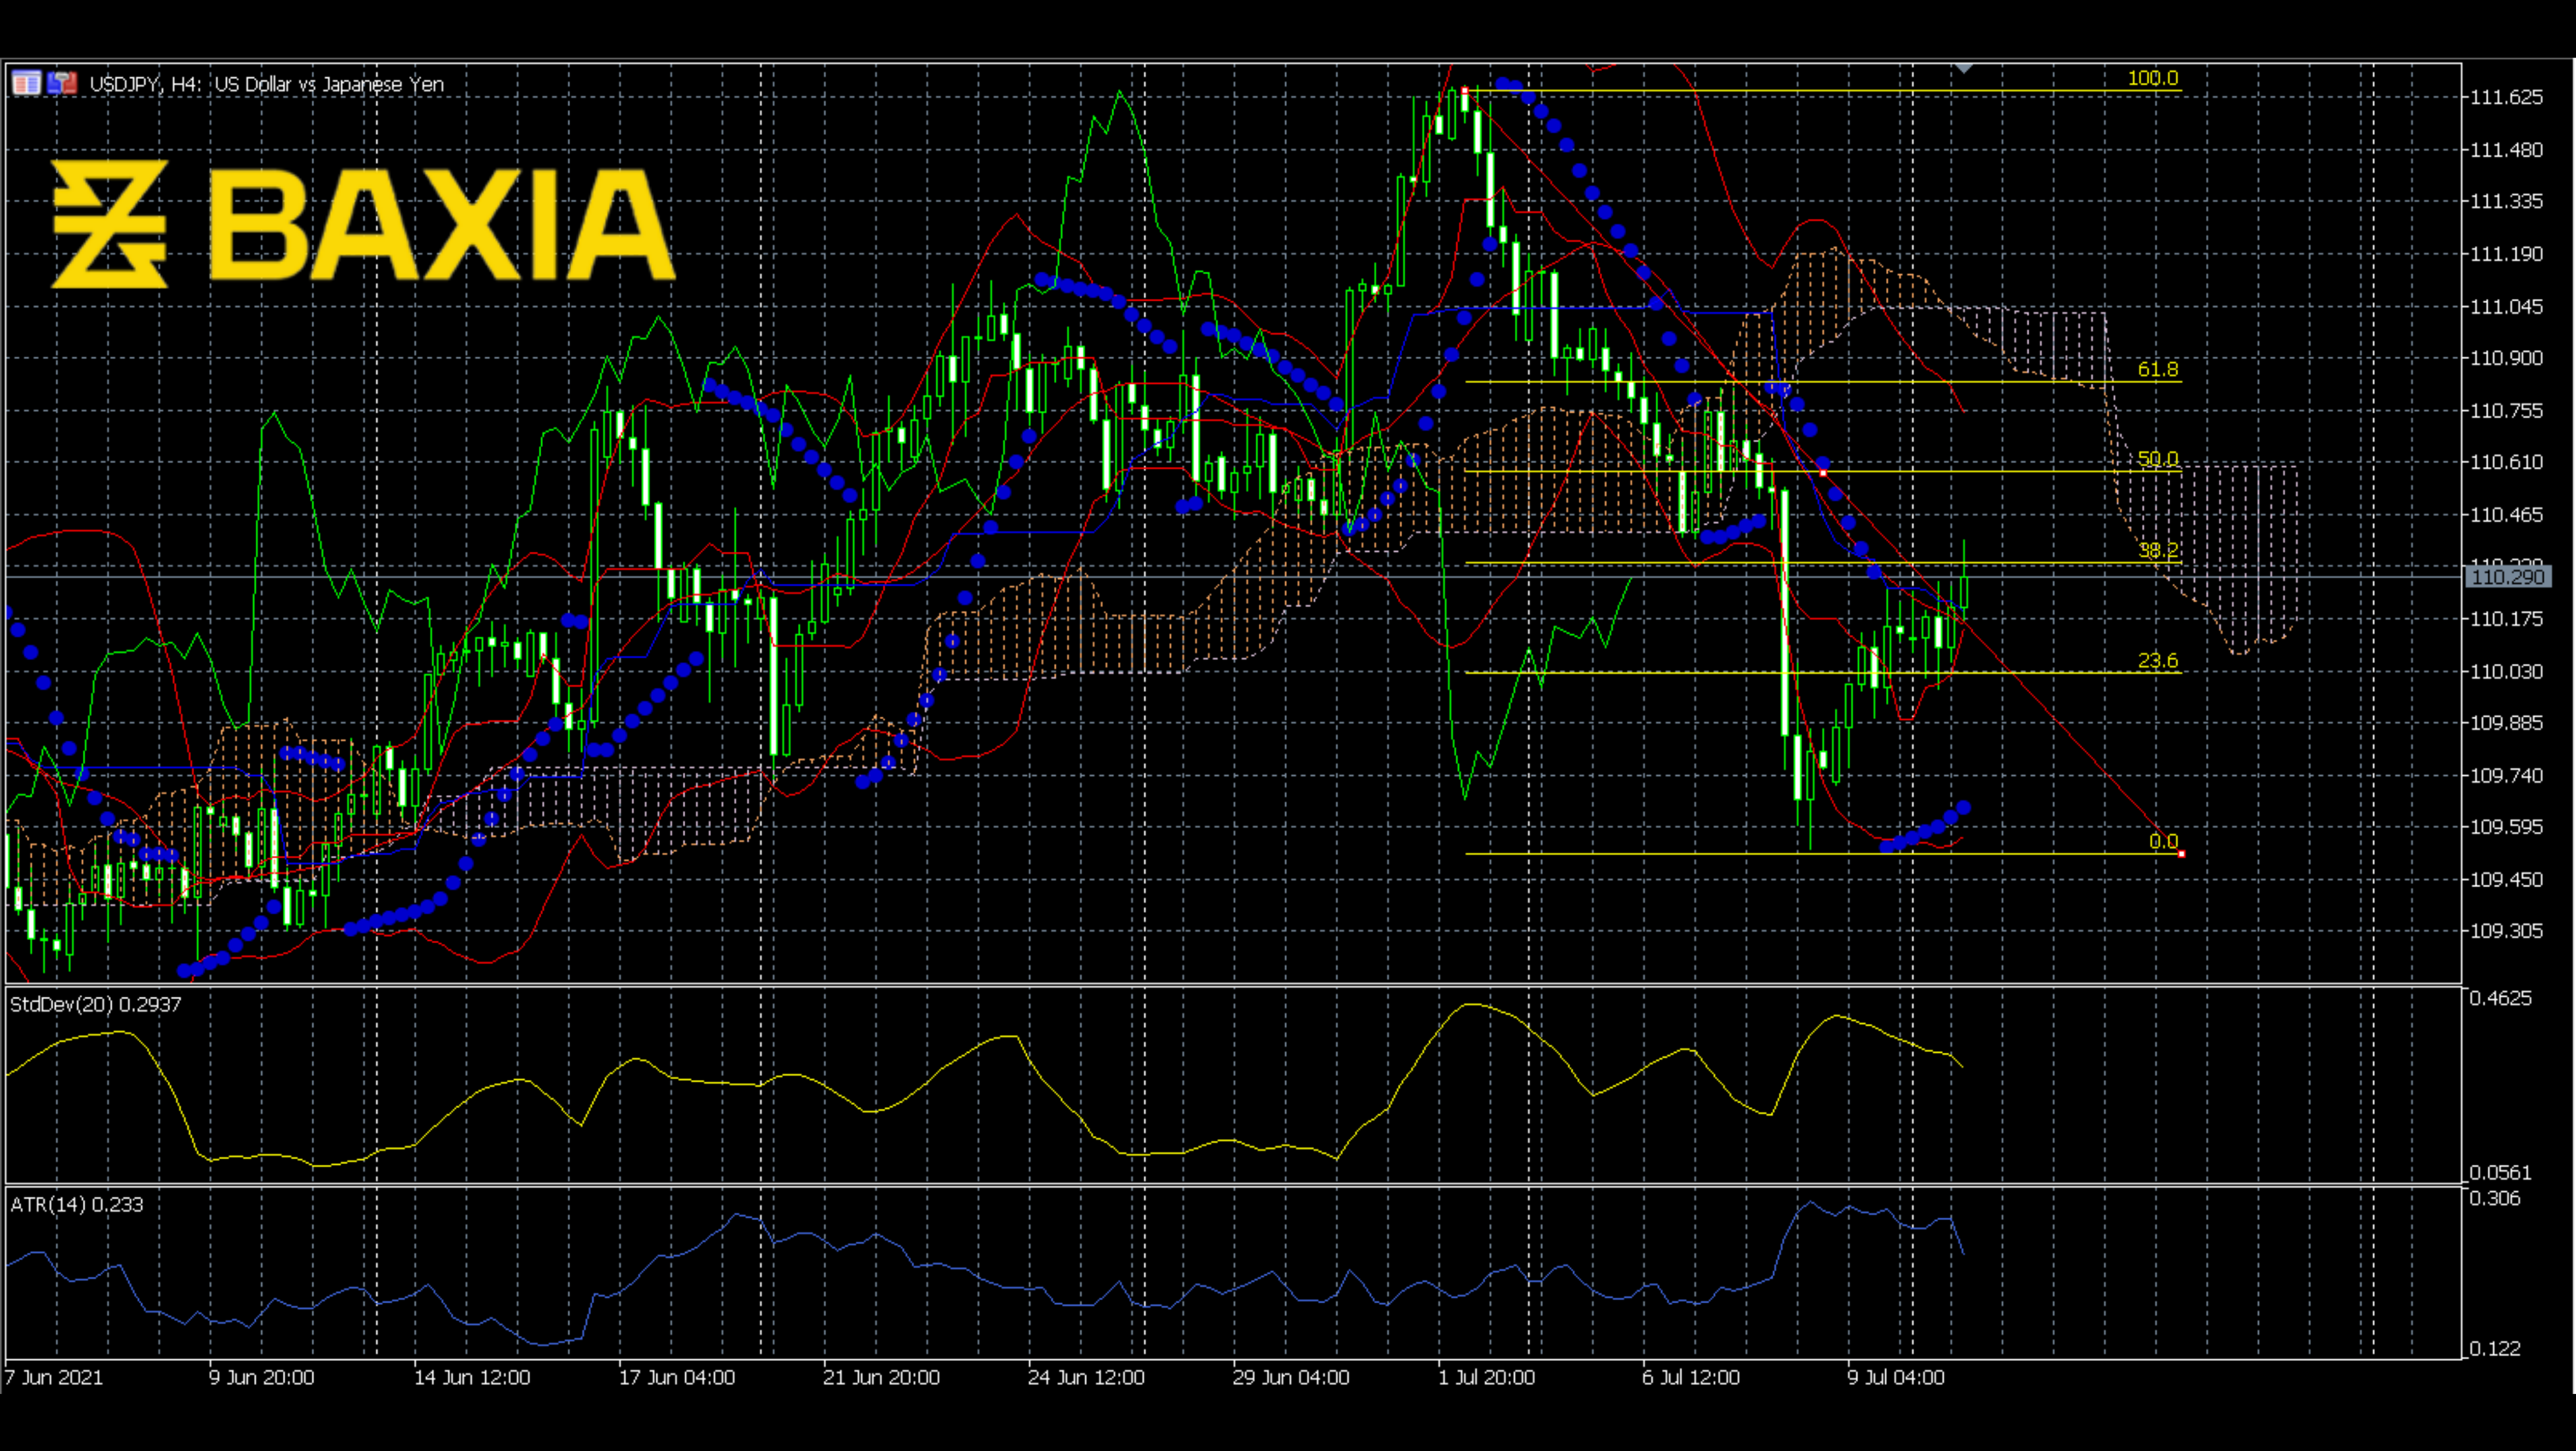
Standard deviation and the average true range are both going down from a high level; this means that the price is getting to a comparatively stable trend. SAR parabolic shows a new upward trend. Ichimoku cloud is going down in a mild slope, which is also a bullish signal.
We love to hear new ideas from traders and want to know what you think!
If you like this topic and want to suggest future topics that you find helpful, let us know by clicking the ‘submit your feedback’ button below.

Trading foreign exchange on margin carries a high level of risk, and may not be suitable for all investors. Before deciding to trade foreign exchange you should carefully consider your investment objectives, level of experience, and risk appetite.
Nothing contained in this website should be construed as investment advice. Any reference to an investment's past or potential performance is not, and should not be construed as, a recommendation or as a guarantee of any specific outcome or profit.