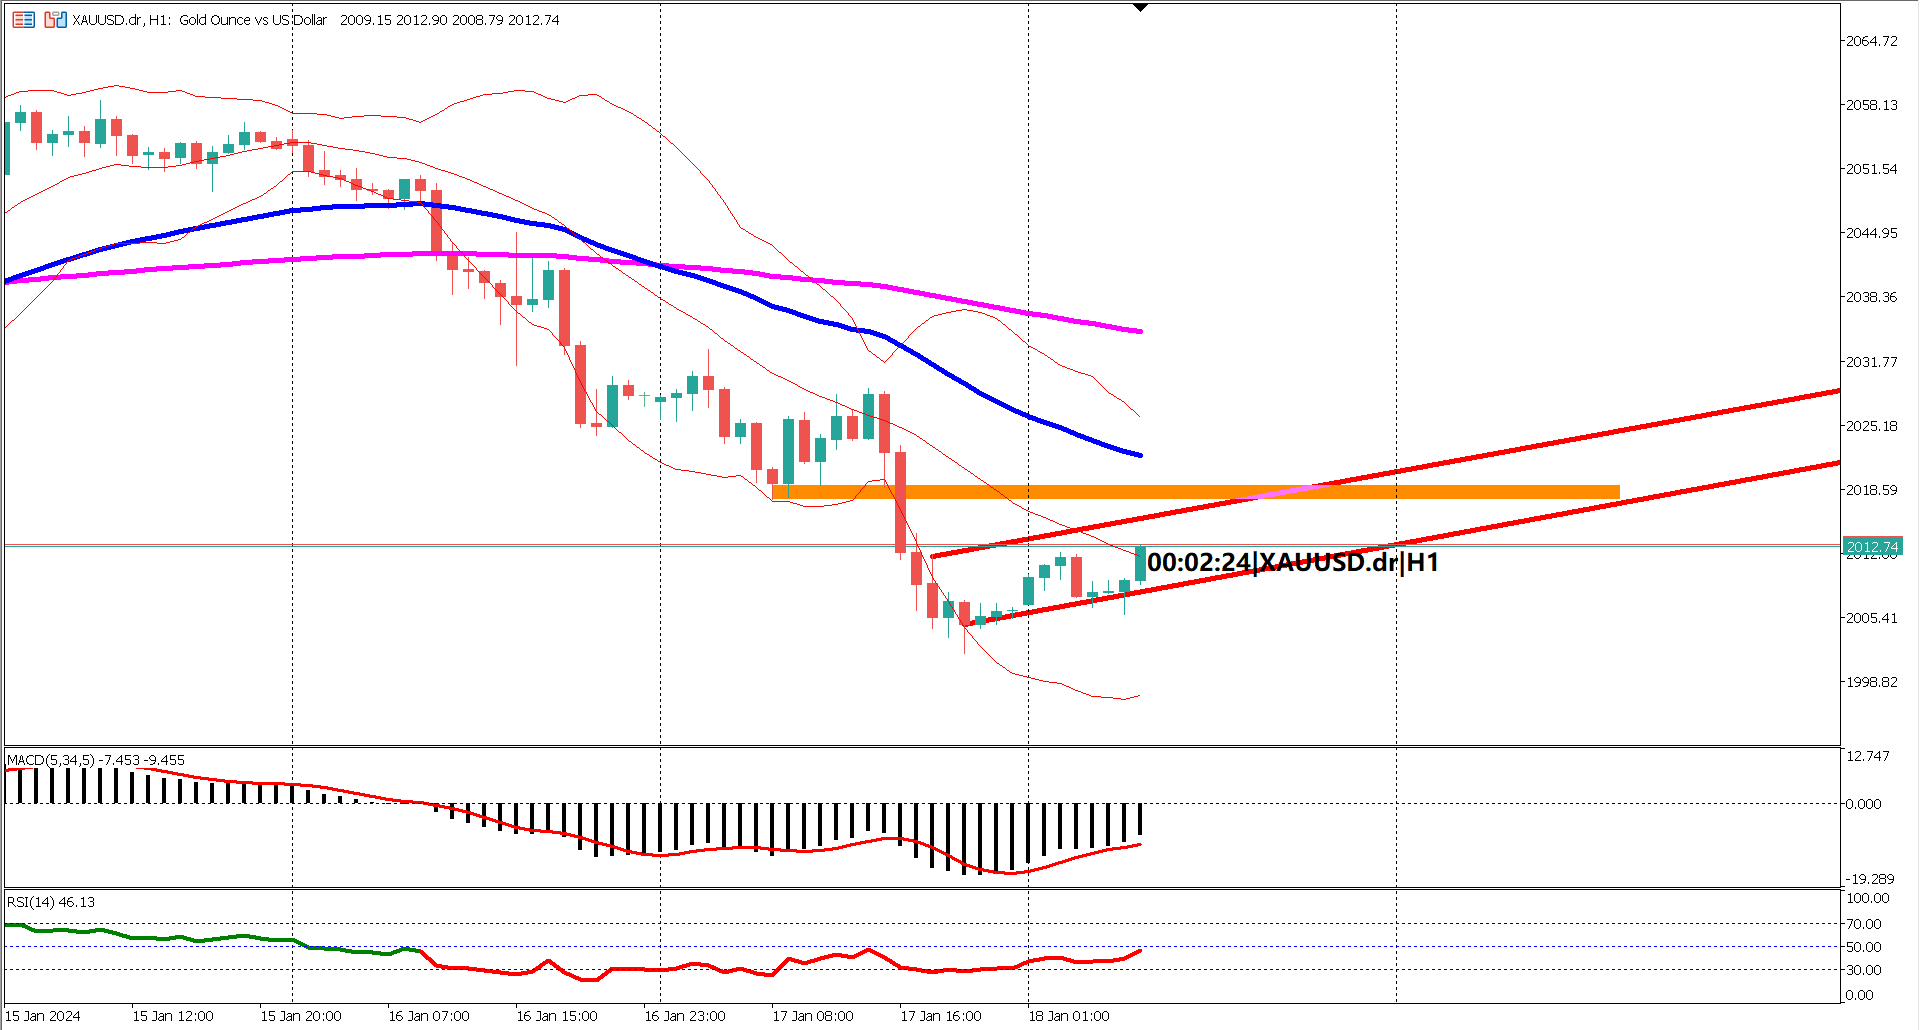

XAUUSD, the trading pair representing the price of gold in US dollars, has recently experienced a notable drop, breaking the symmetrical triangle chart pattern. This movement occurred in response to the release of Consumer Price Index (CPI) data that beat forecasts, sparking a shift in market sentiment.
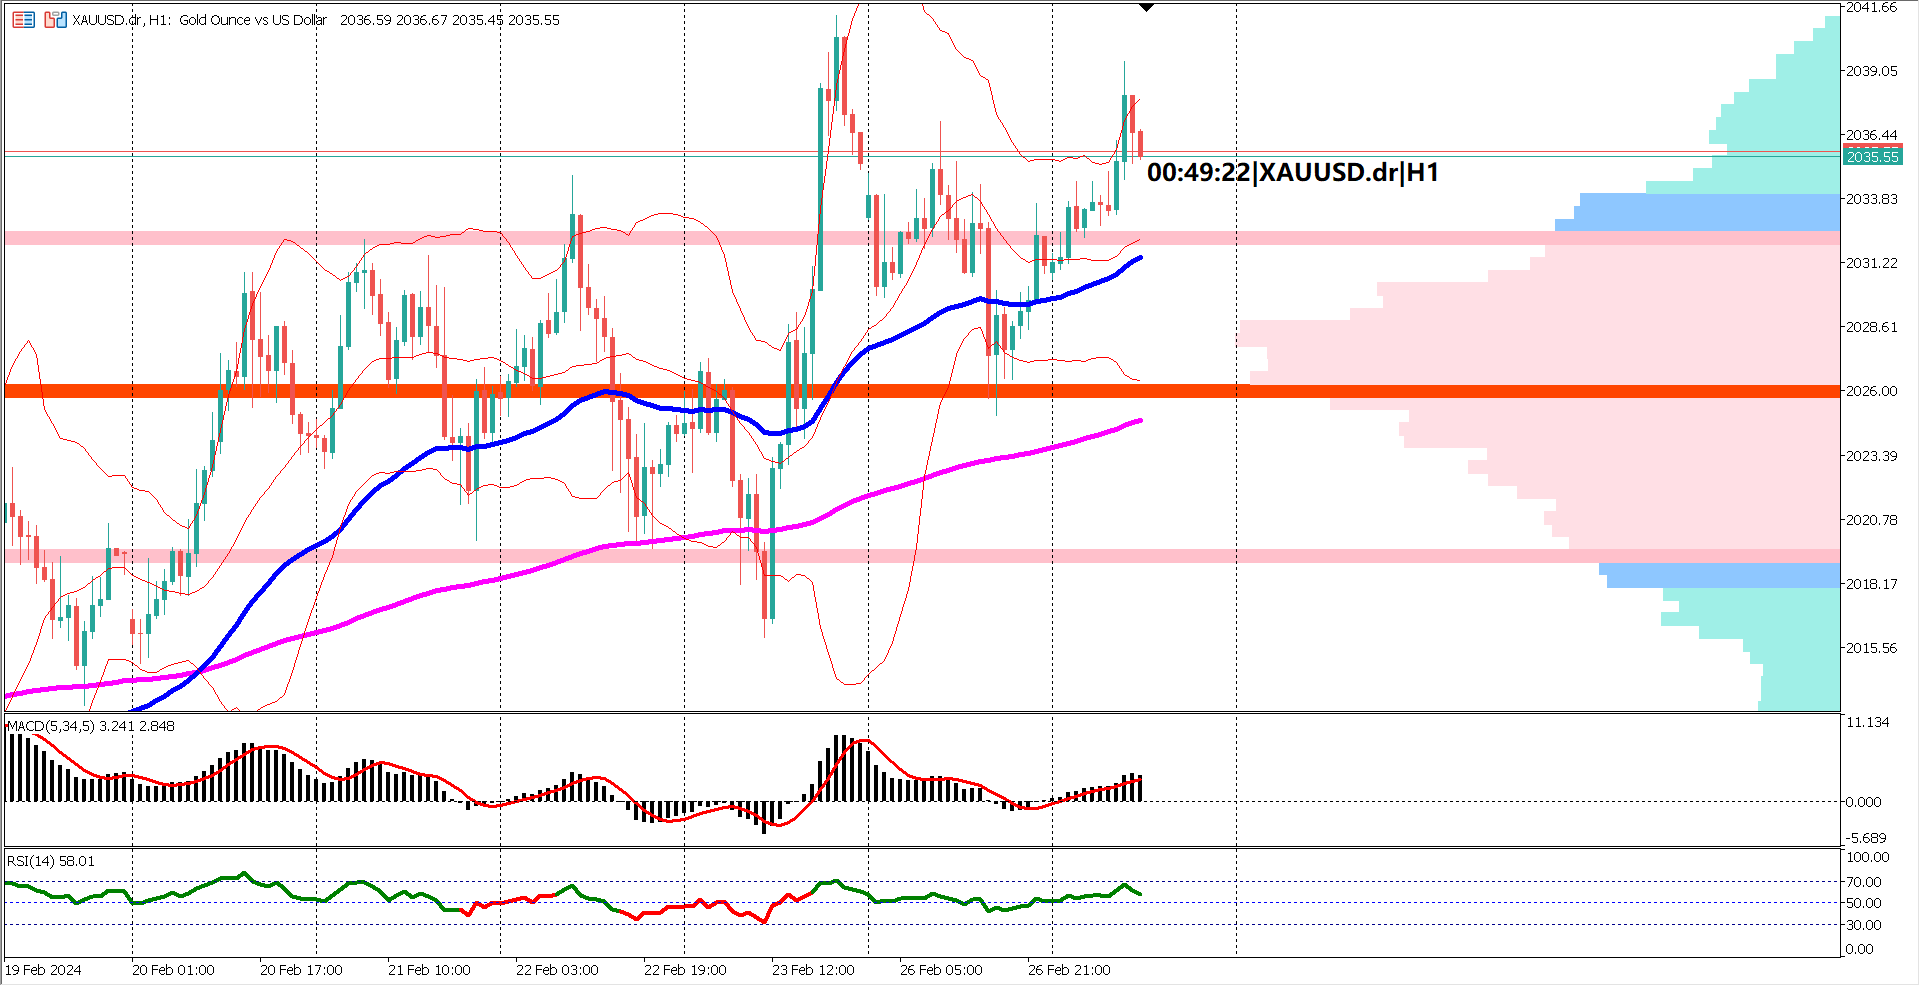
Technical analysis reveals several key indicators pointing towards the continuation of this downward trend. Firstly, the Exponential Moving Averages (EMA) 50 and 200 are showing an increasing distance between them, indicating a strengthening bearish momentum. This suggests that sellers are firmly in control of the market.
Following the approximately 2% drop, the Bollinger Bands – a volatility indicator – have started to contract. This contraction signifies that the market is taking a short pause from the selling pressure. However, it's essential to note that this does not necessarily indicate a trend reversal but rather a temporary respite in the downward movement.
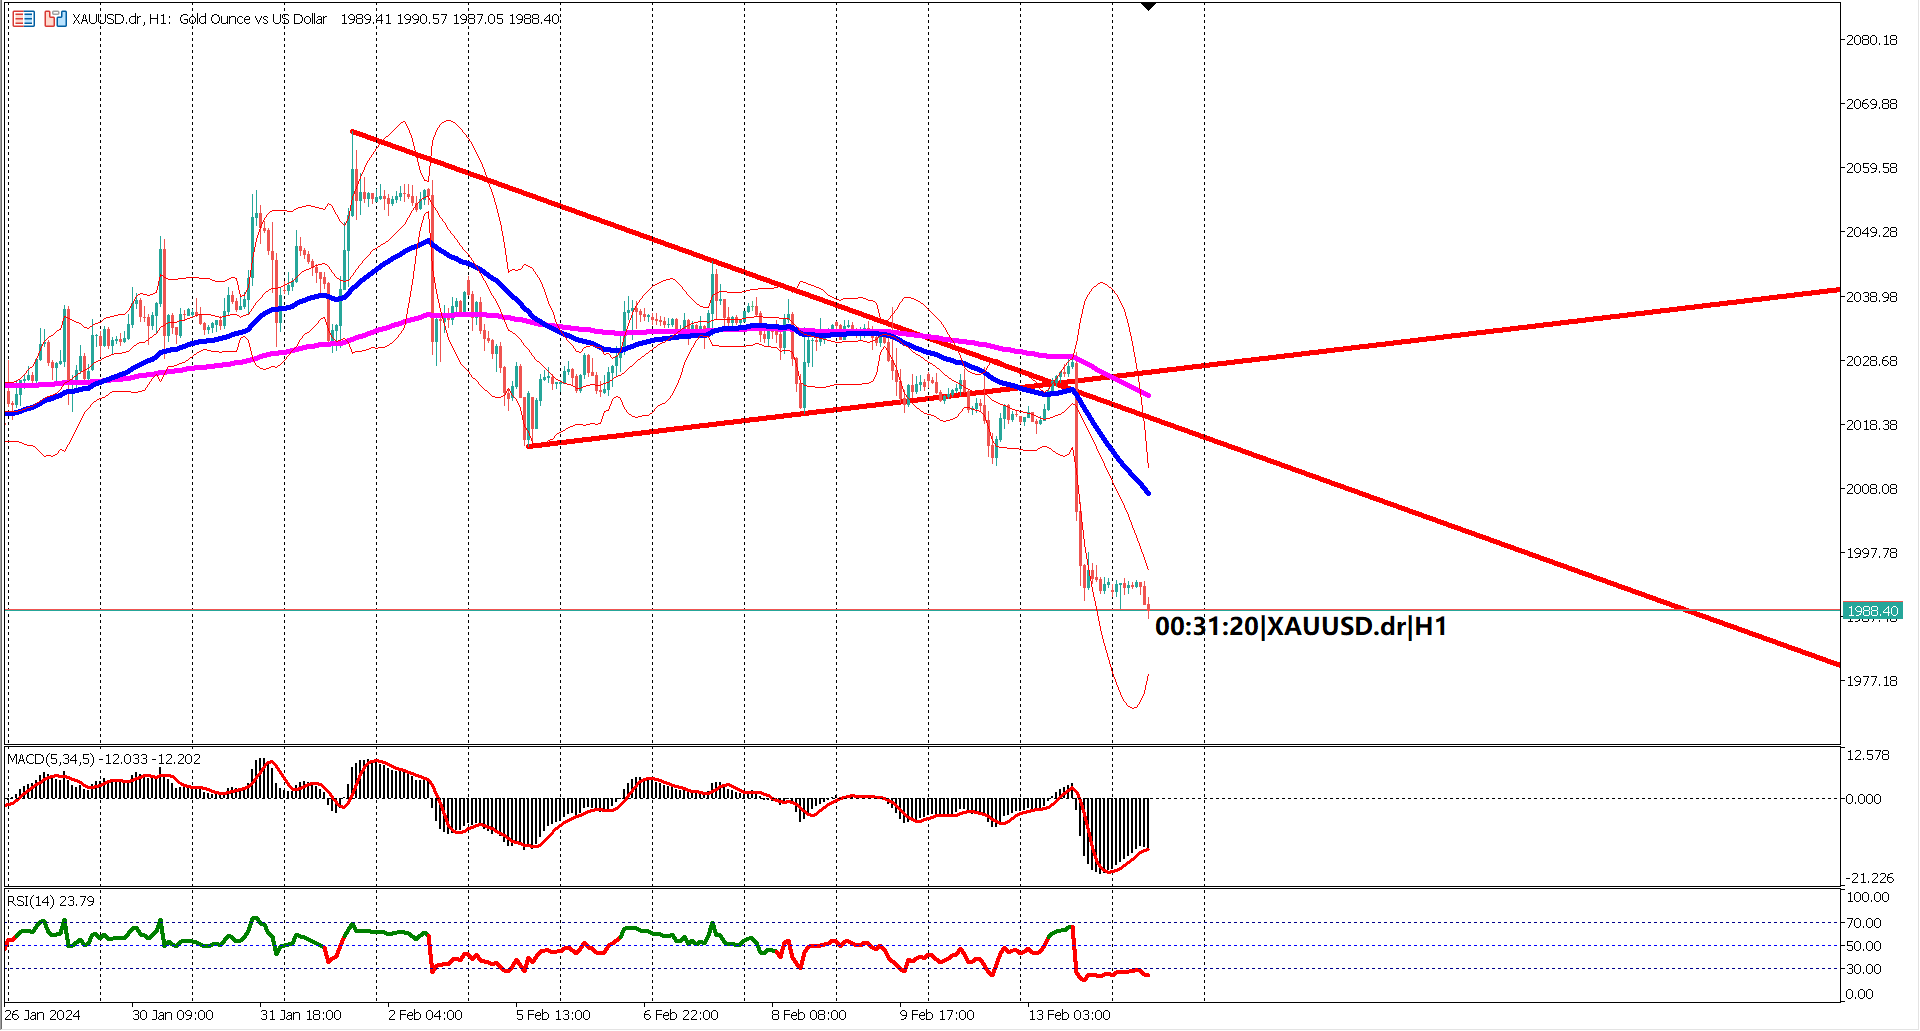
In terms of key levels to watch, resistance is expected at the middle band and the upper band of the Bollinger Bands. A break above the upper band could suggest that selling pressure is waning. However, if there's no break above these levels within the next 4 or 8 trading hours, it's likely that prices will continue to move lower.
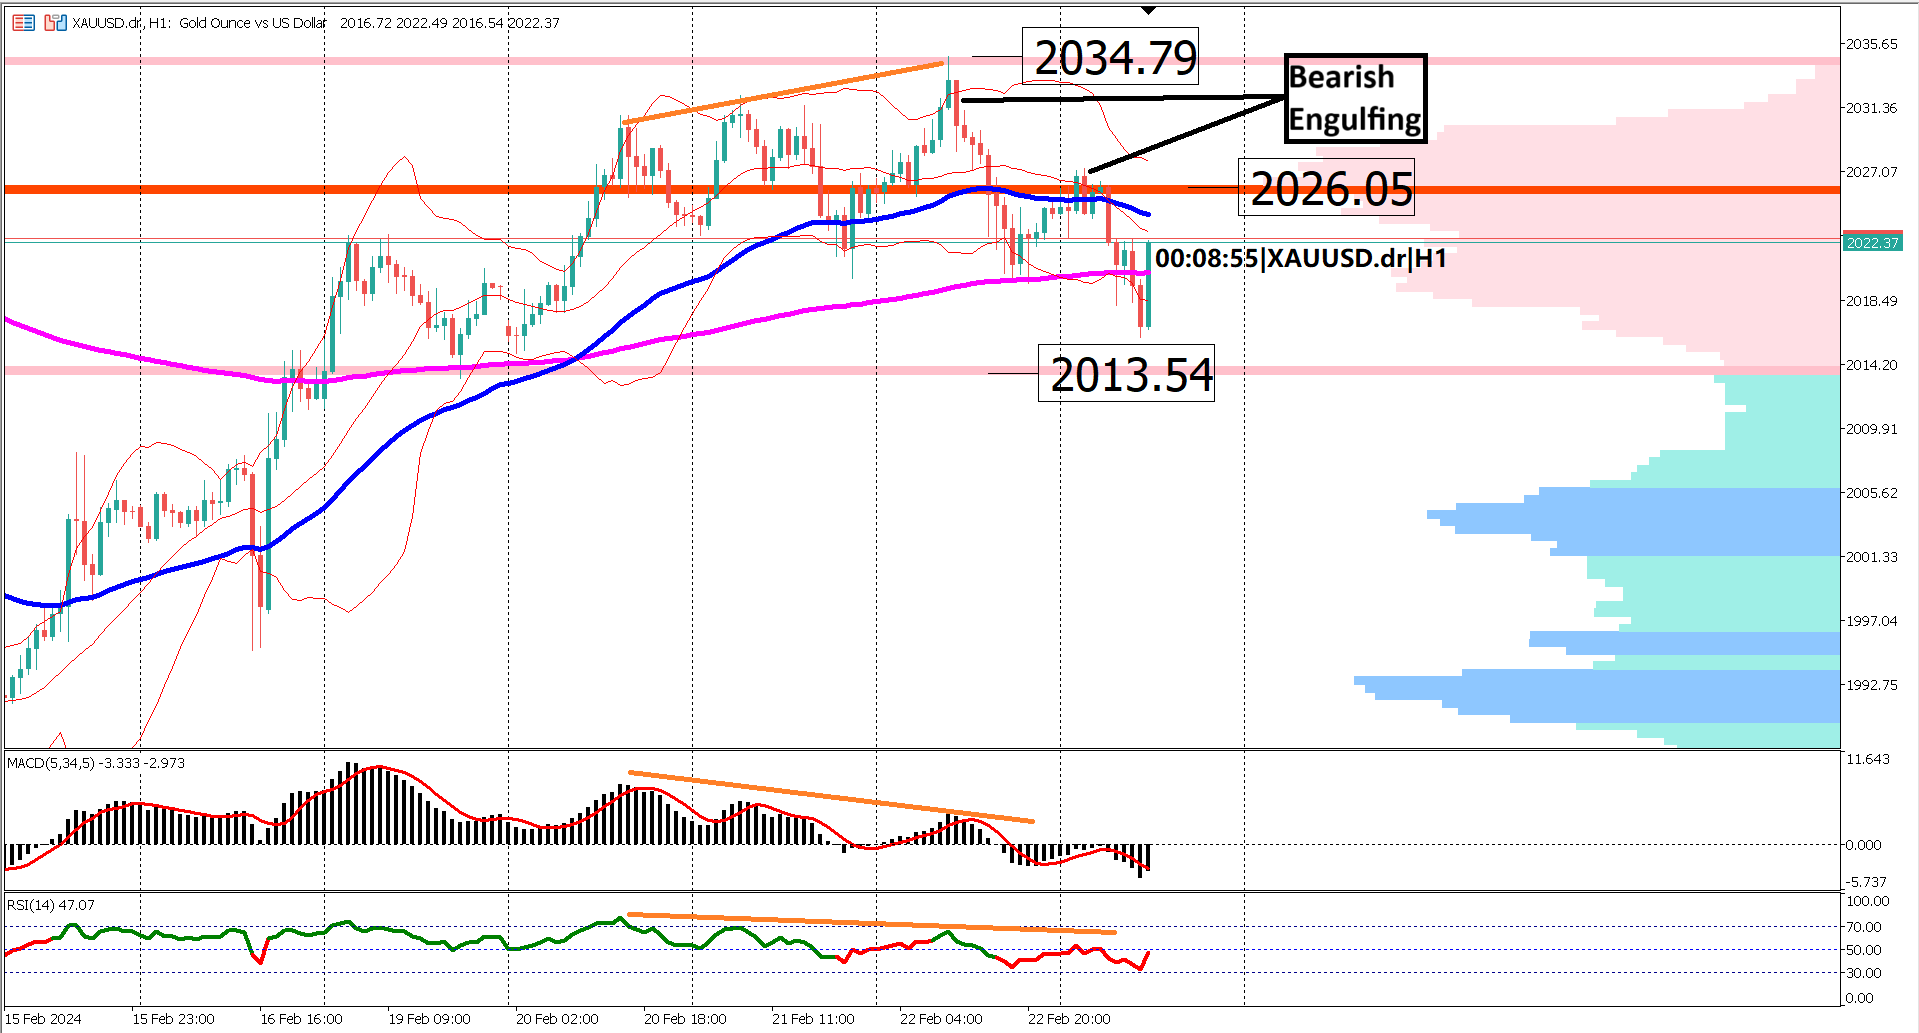
Additionally, technical oscillators such as the Relative Strength Index (RSI) and Moving Average Convergence Divergence (MACD) histogram provide further insights. The RSI is currently indicating oversold conditions, suggesting that a support level may be nearing. Moreover, the MACD histogram has crossed above the signal line, coinciding with the contraction of the Bollinger Bands, indicating that the market is taking a breather from the selling pressure.
In summary, the overall outlook for XAUUSD remains bearish, with the market taking a temporary break from the recent downward movement. However, given the strong bearish momentum indicated by the widening distance between the EMAs and the lack of significant bullish signals, there's still a likelihood that prices will continue to move lower in the near term.
Actual 4.0% Forecast 4.1% vs Previous 4.0%
Forecast 1.1% vs Previous 1.3%
Forecast 3.300 vs Previous 5.521

Trading foreign exchange on margin carries a high level of risk, and may not be suitable for all investors. Before deciding to trade foreign exchange you should carefully consider your investment objectives, level of experience, and risk appetite.
Nothing contained in this website should be construed as investment advice. Any reference to an investment's past or potential performance is not, and should not be construed as, a recommendation or as a guarantee of any specific outcome or profit.