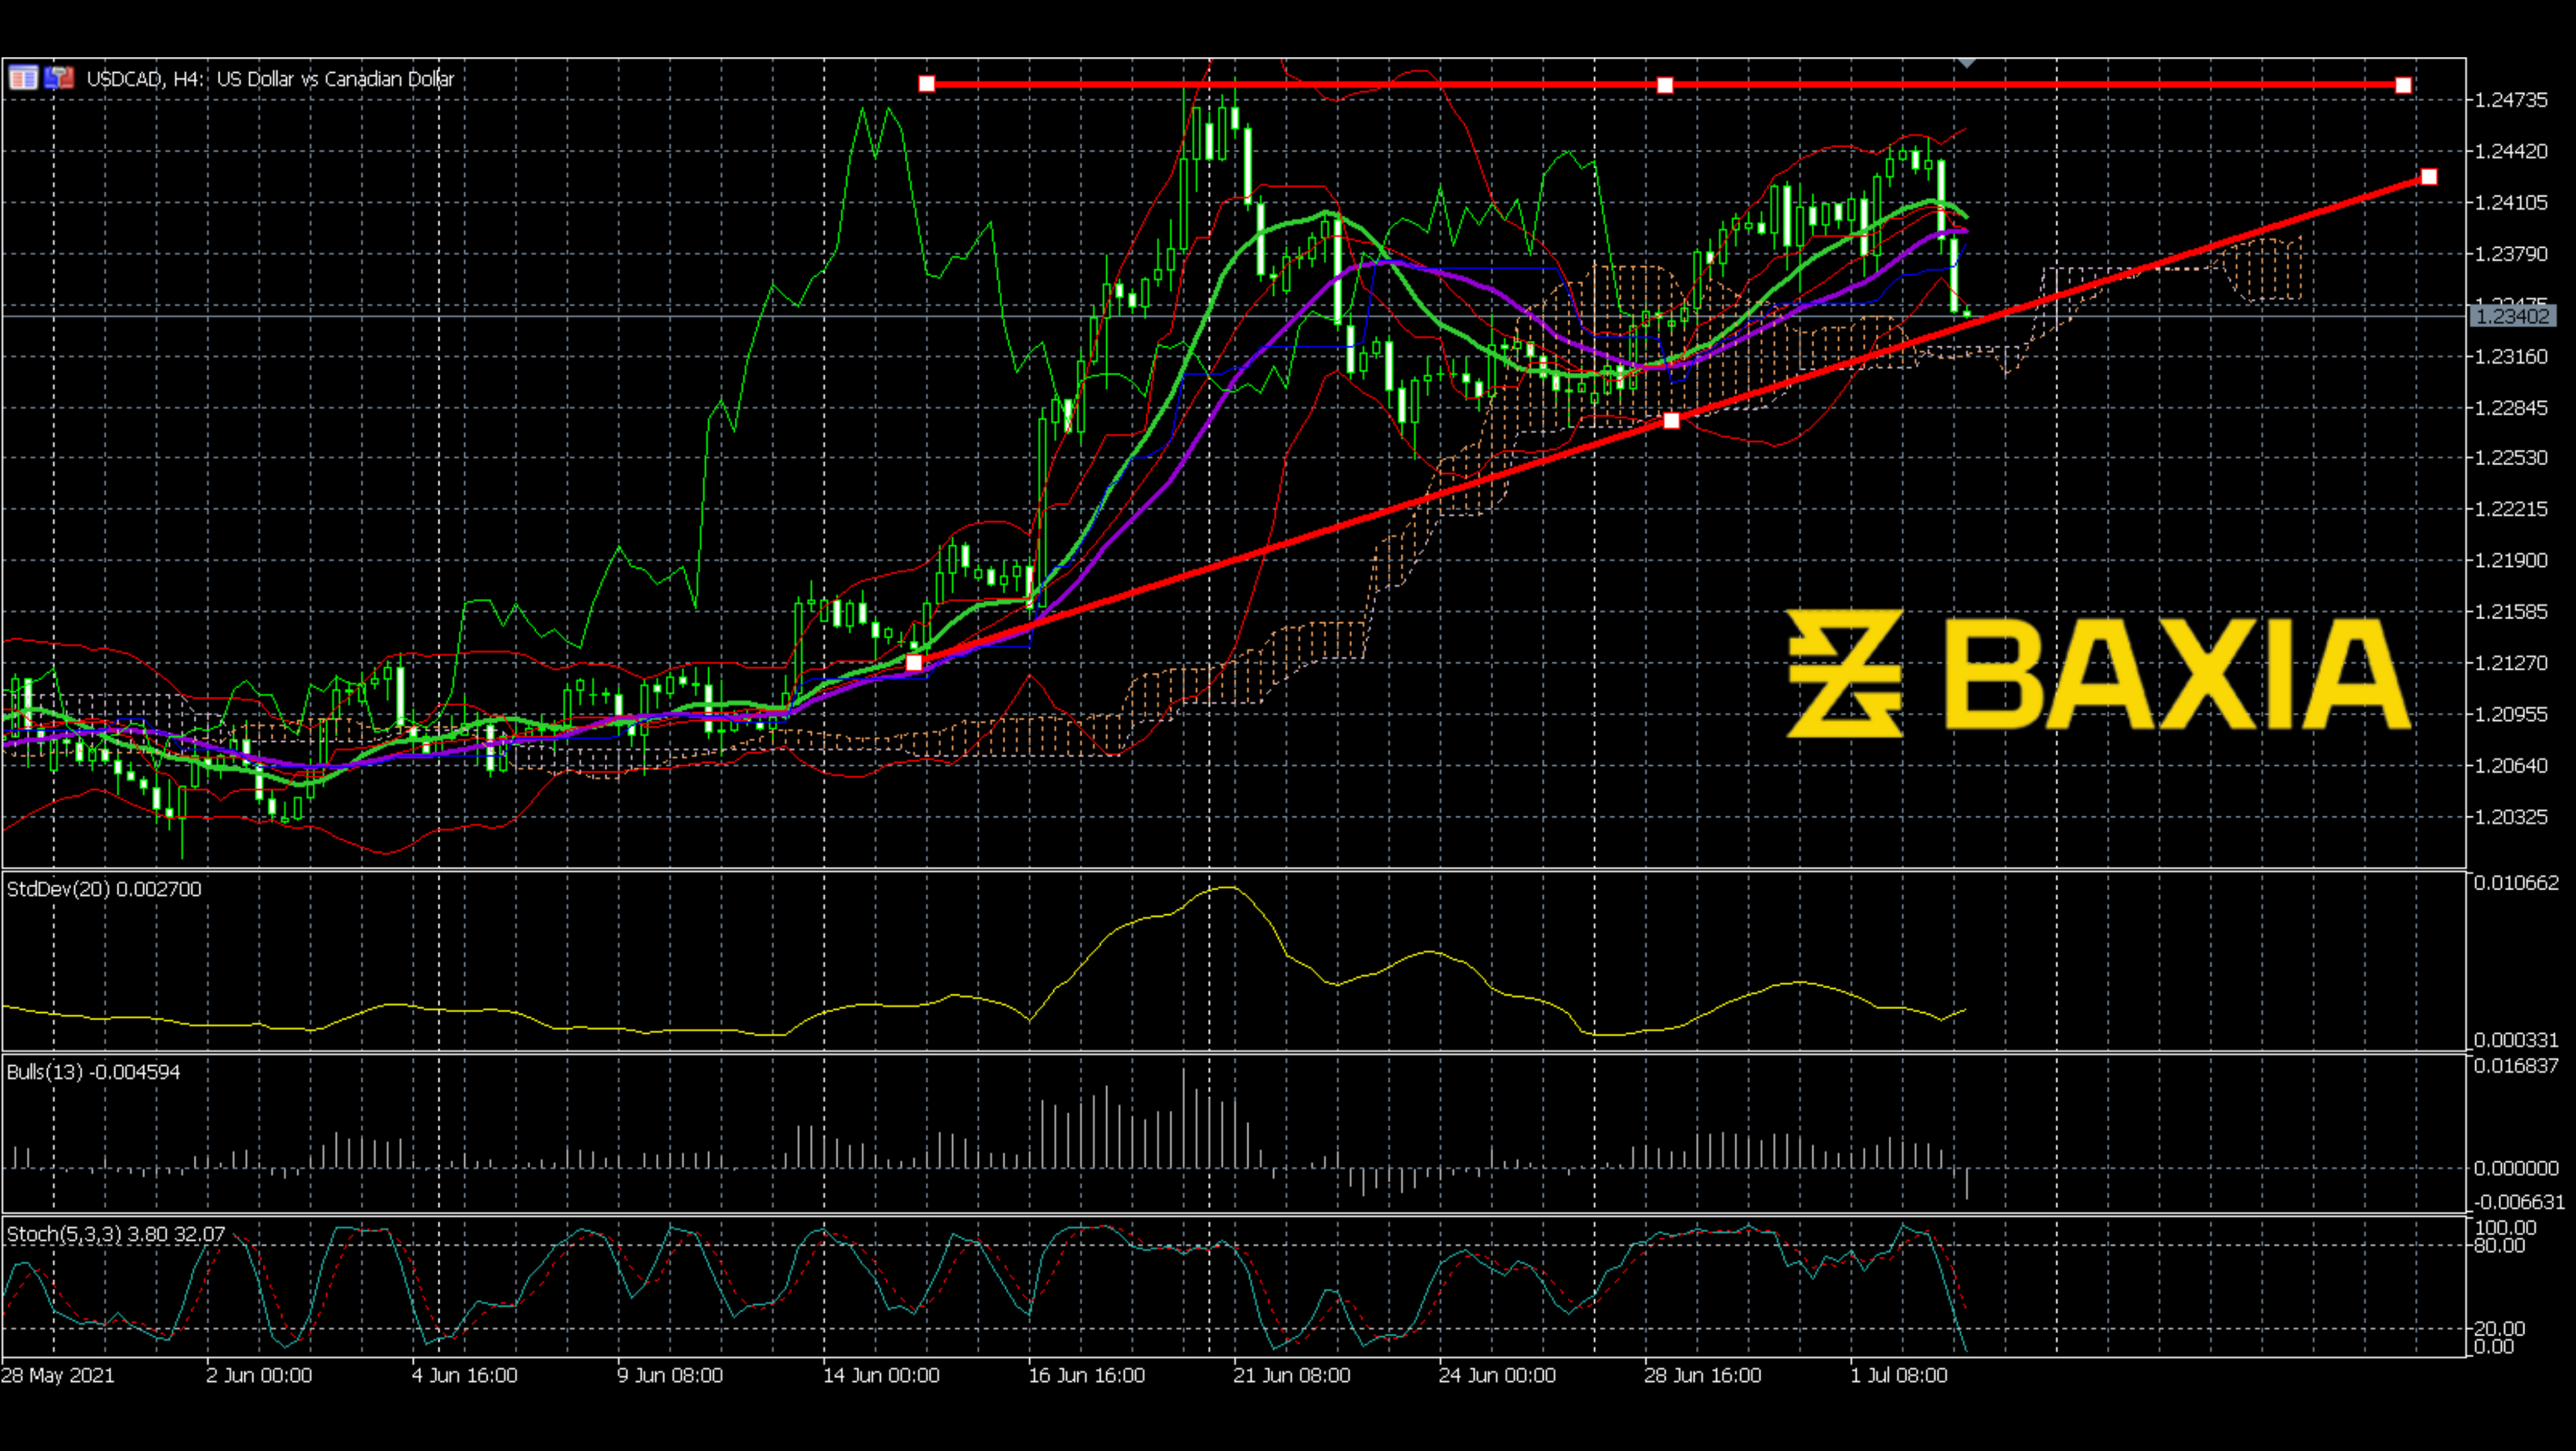

The price of USDCAD has been hovering around the 1.256 level since Jul 28th. Although the waves are small, we can observe an ascending triangle here. The triangle started on Jul 28th, which was the same as the time of the first wave. As we know, the ascending triangle is a bullish signal. So, will the price break up as we expected?
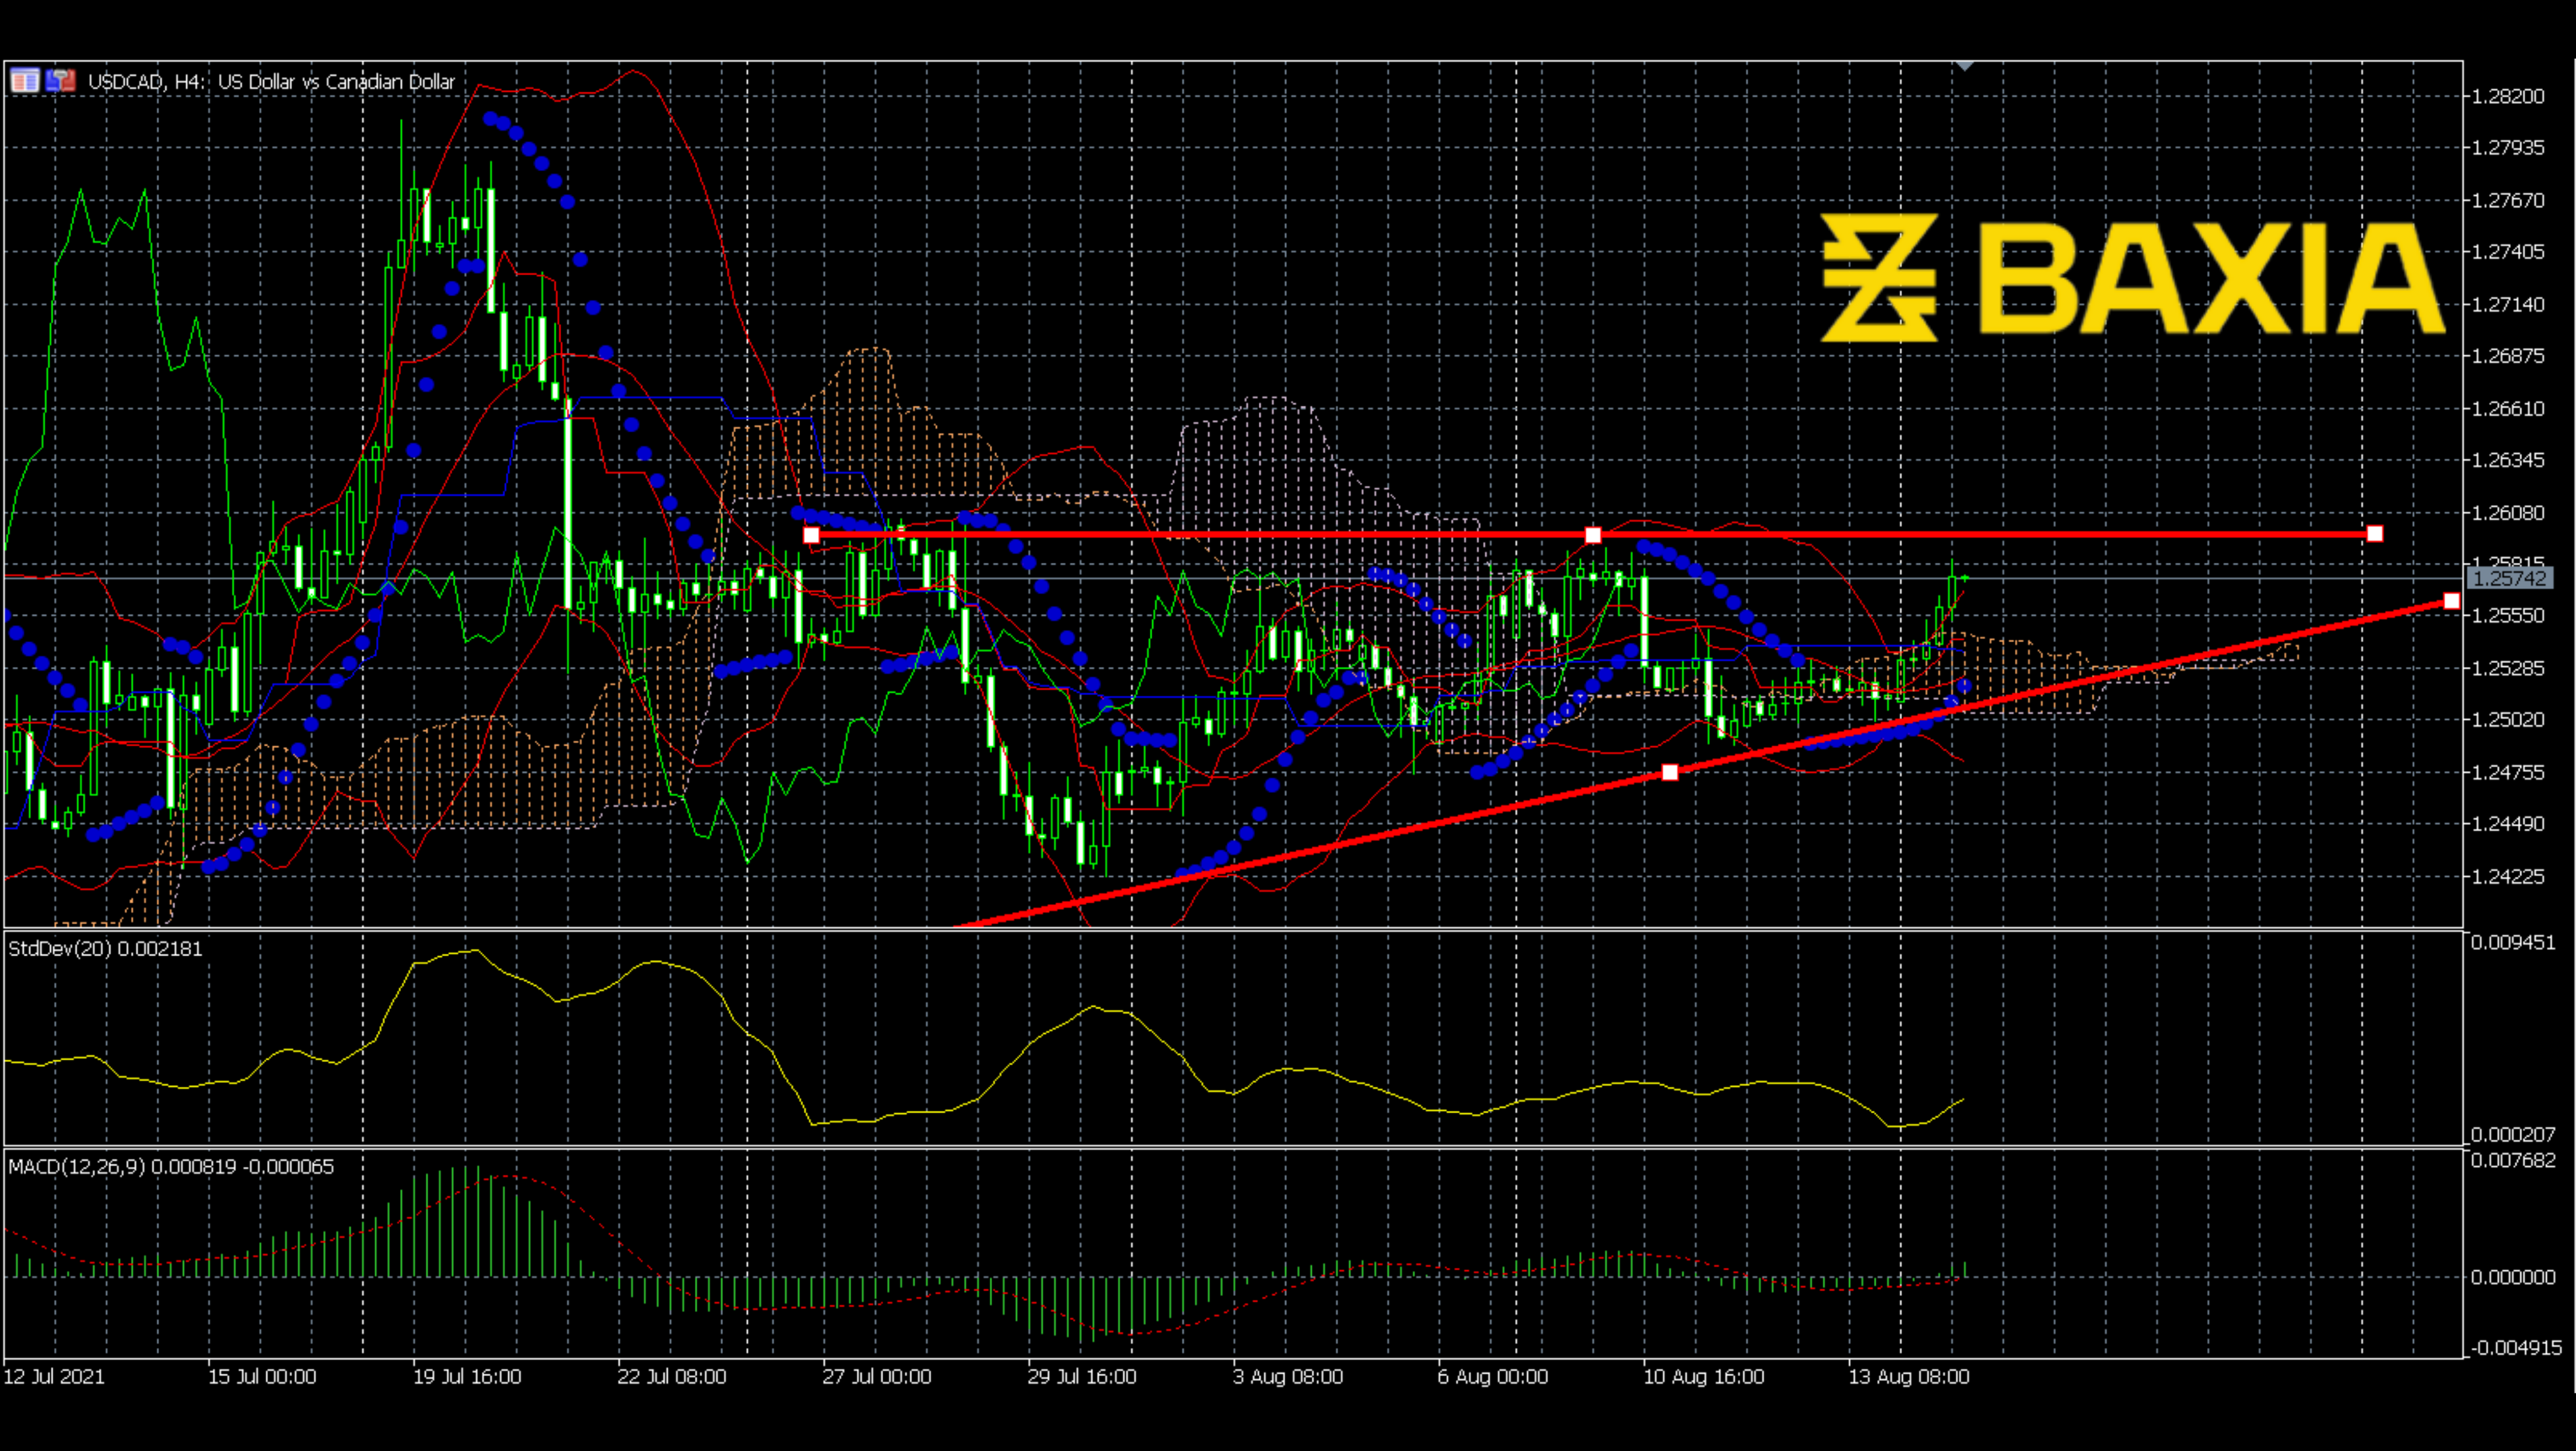
Despite the pattern itself, let’s see what we have for now. Bollinger Bands have shrunk and now have expanded; however, the price line is still beyond the upper Bollinger Band. The price line broke up of the Bollinger Bands. Another thing is that the price line now overlaps with the Ichimoku clouds, which means the price line is now at a turning point. MACD just made a bullish cross. Parabolic SAR has made an upward trend with a sharp slope. Standard Deviation goes up, which means another big wave is coming.
We love to hear new ideas from traders and want to know what you think!
If you like this topic and want to suggest future topics that you find helpful, let us know by clicking the ‘submit your feedback’ button below.

Trading foreign exchange on margin carries a high level of risk, and may not be suitable for all investors. Before deciding to trade foreign exchange you should carefully consider your investment objectives, level of experience, and risk appetite.
Nothing contained in this website should be construed as investment advice. Any reference to an investment's past or potential performance is not, and should not be construed as, a recommendation or as a guarantee of any specific outcome or profit.