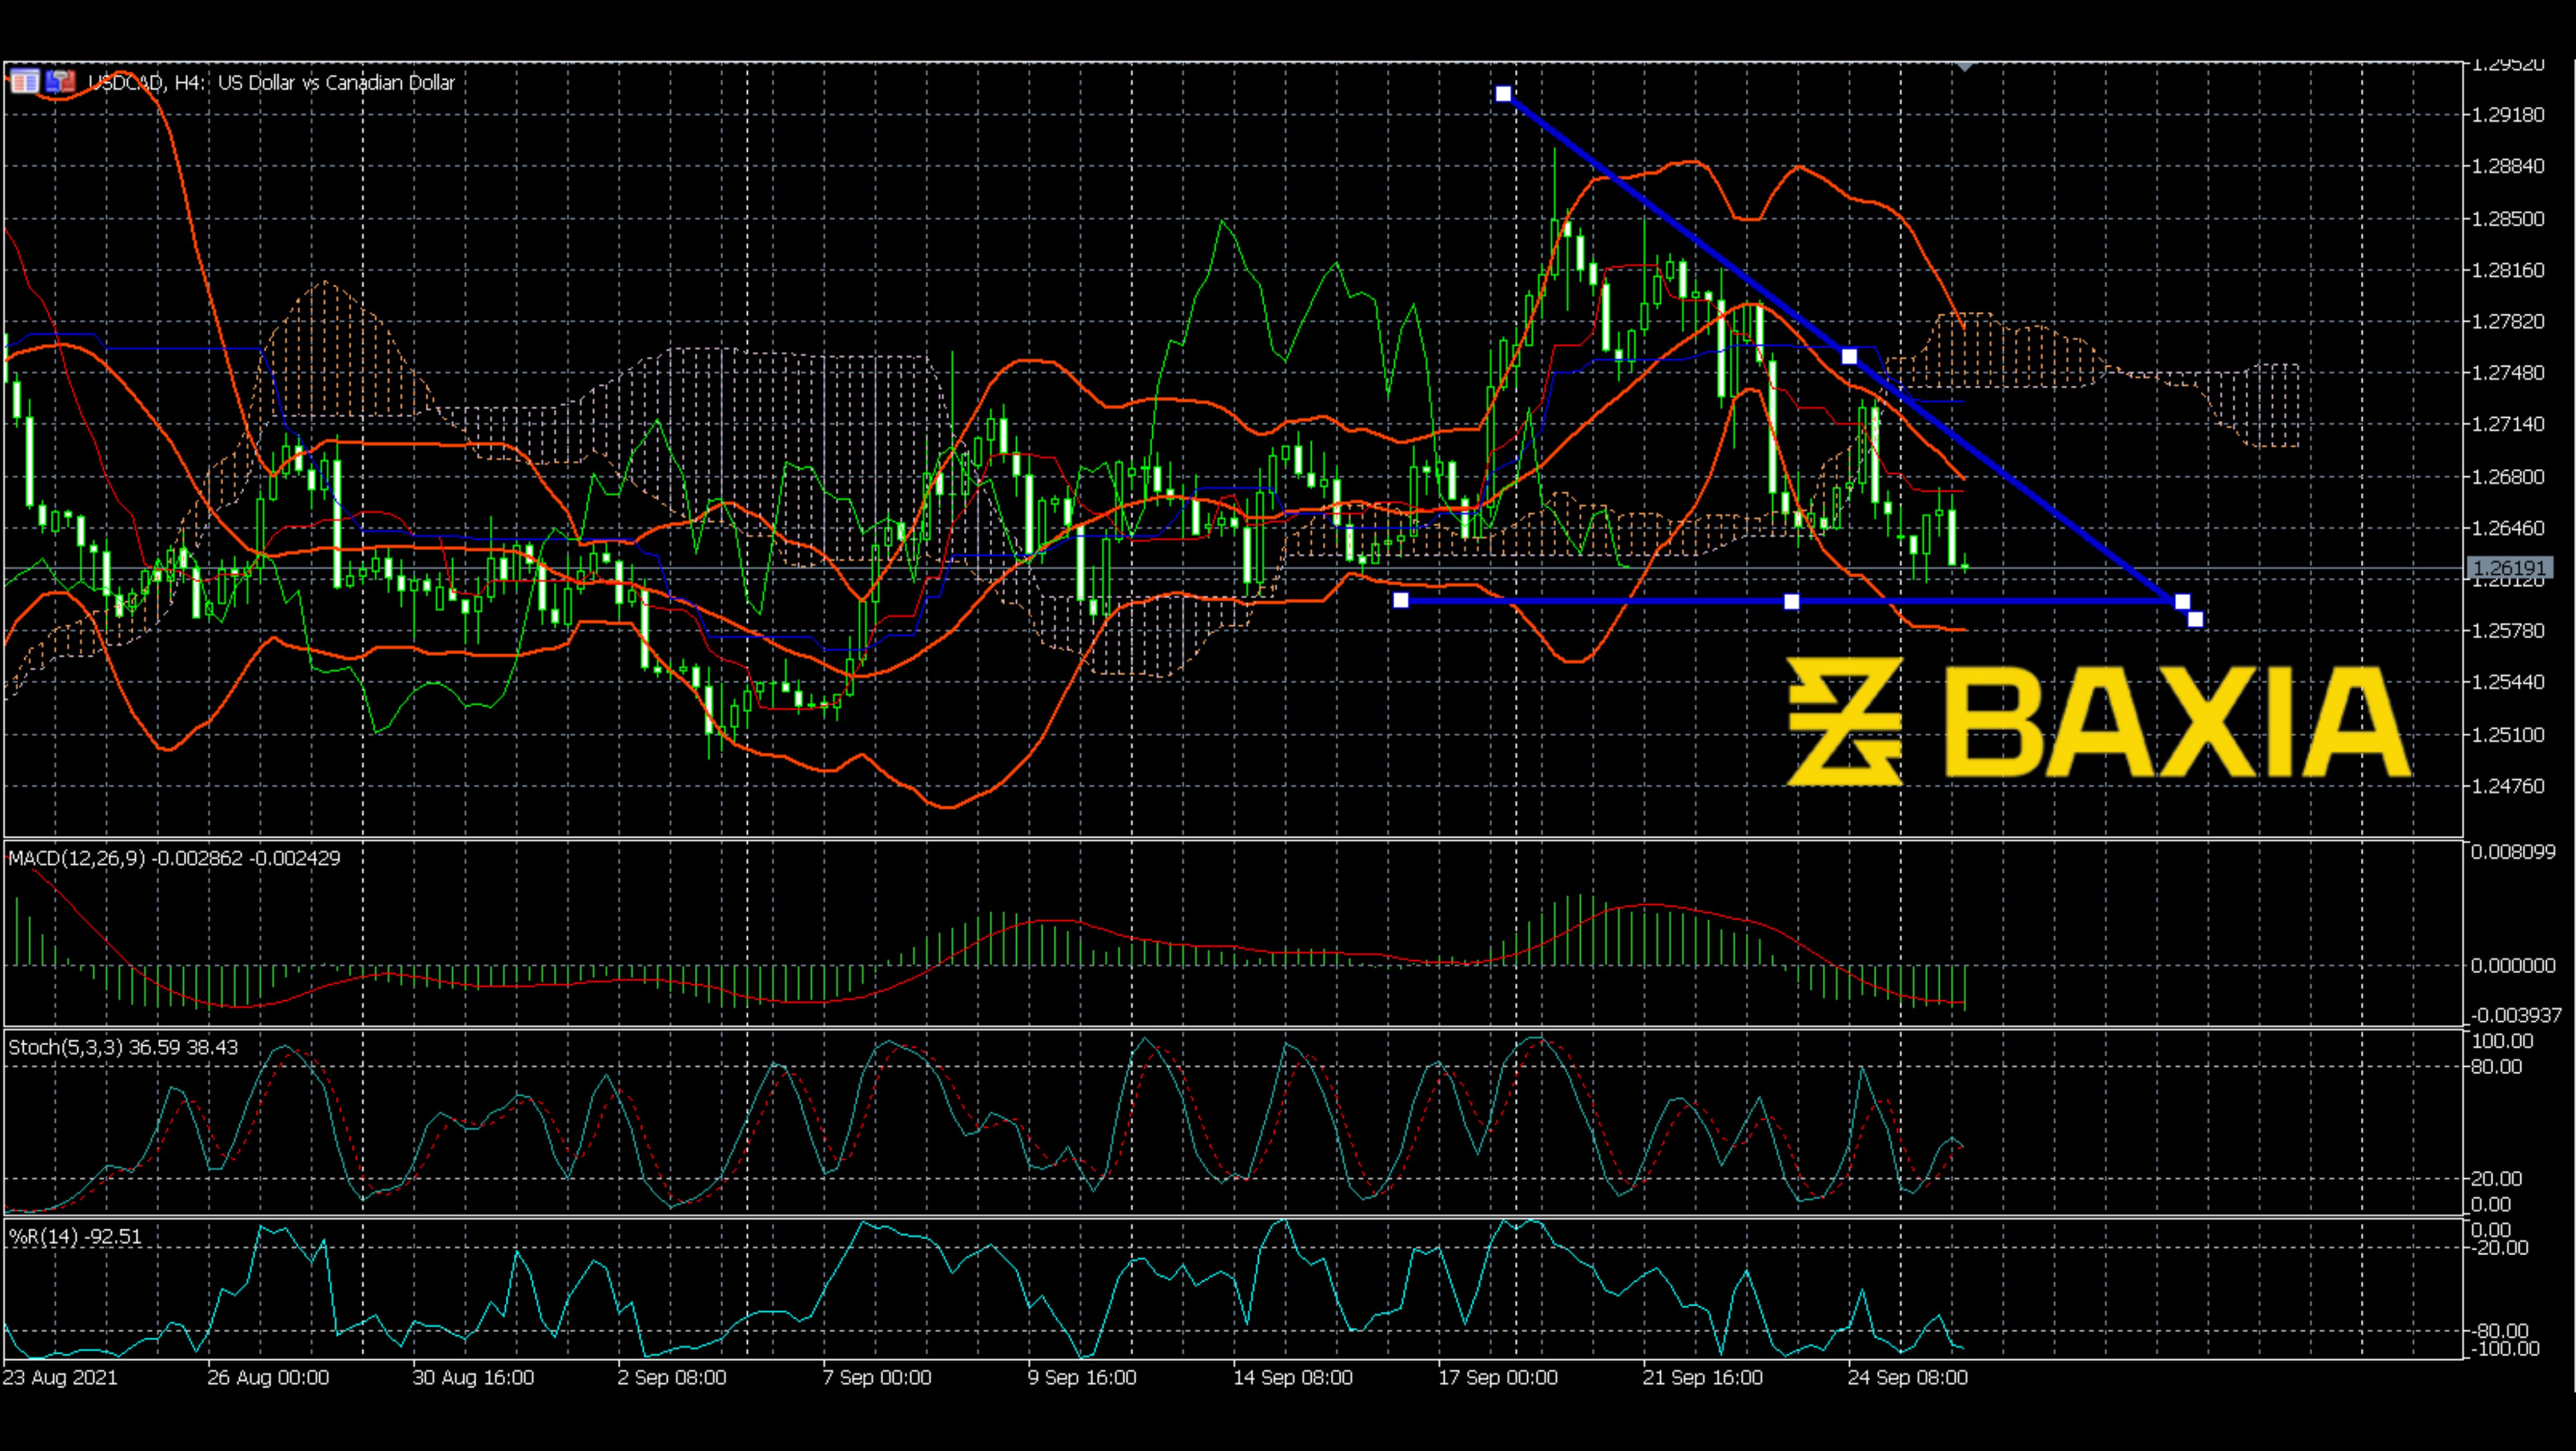

The price of USDCAD started to make waves on June 10th; it's been almost 22 days. During these 22 days, the waves that the price line made built an ascending triangle. The ascending triangle is now getting close to the end. Will the price break up as we expected after this triangle
We cannot deny that the downward trend seems stronger because the downward steps were steeper than upward. However, the movement was still within the triangle, which means the price line is still under control. Bollinger Bands have shrunk since June 24th, which means the price has been ready for a breakout since then.
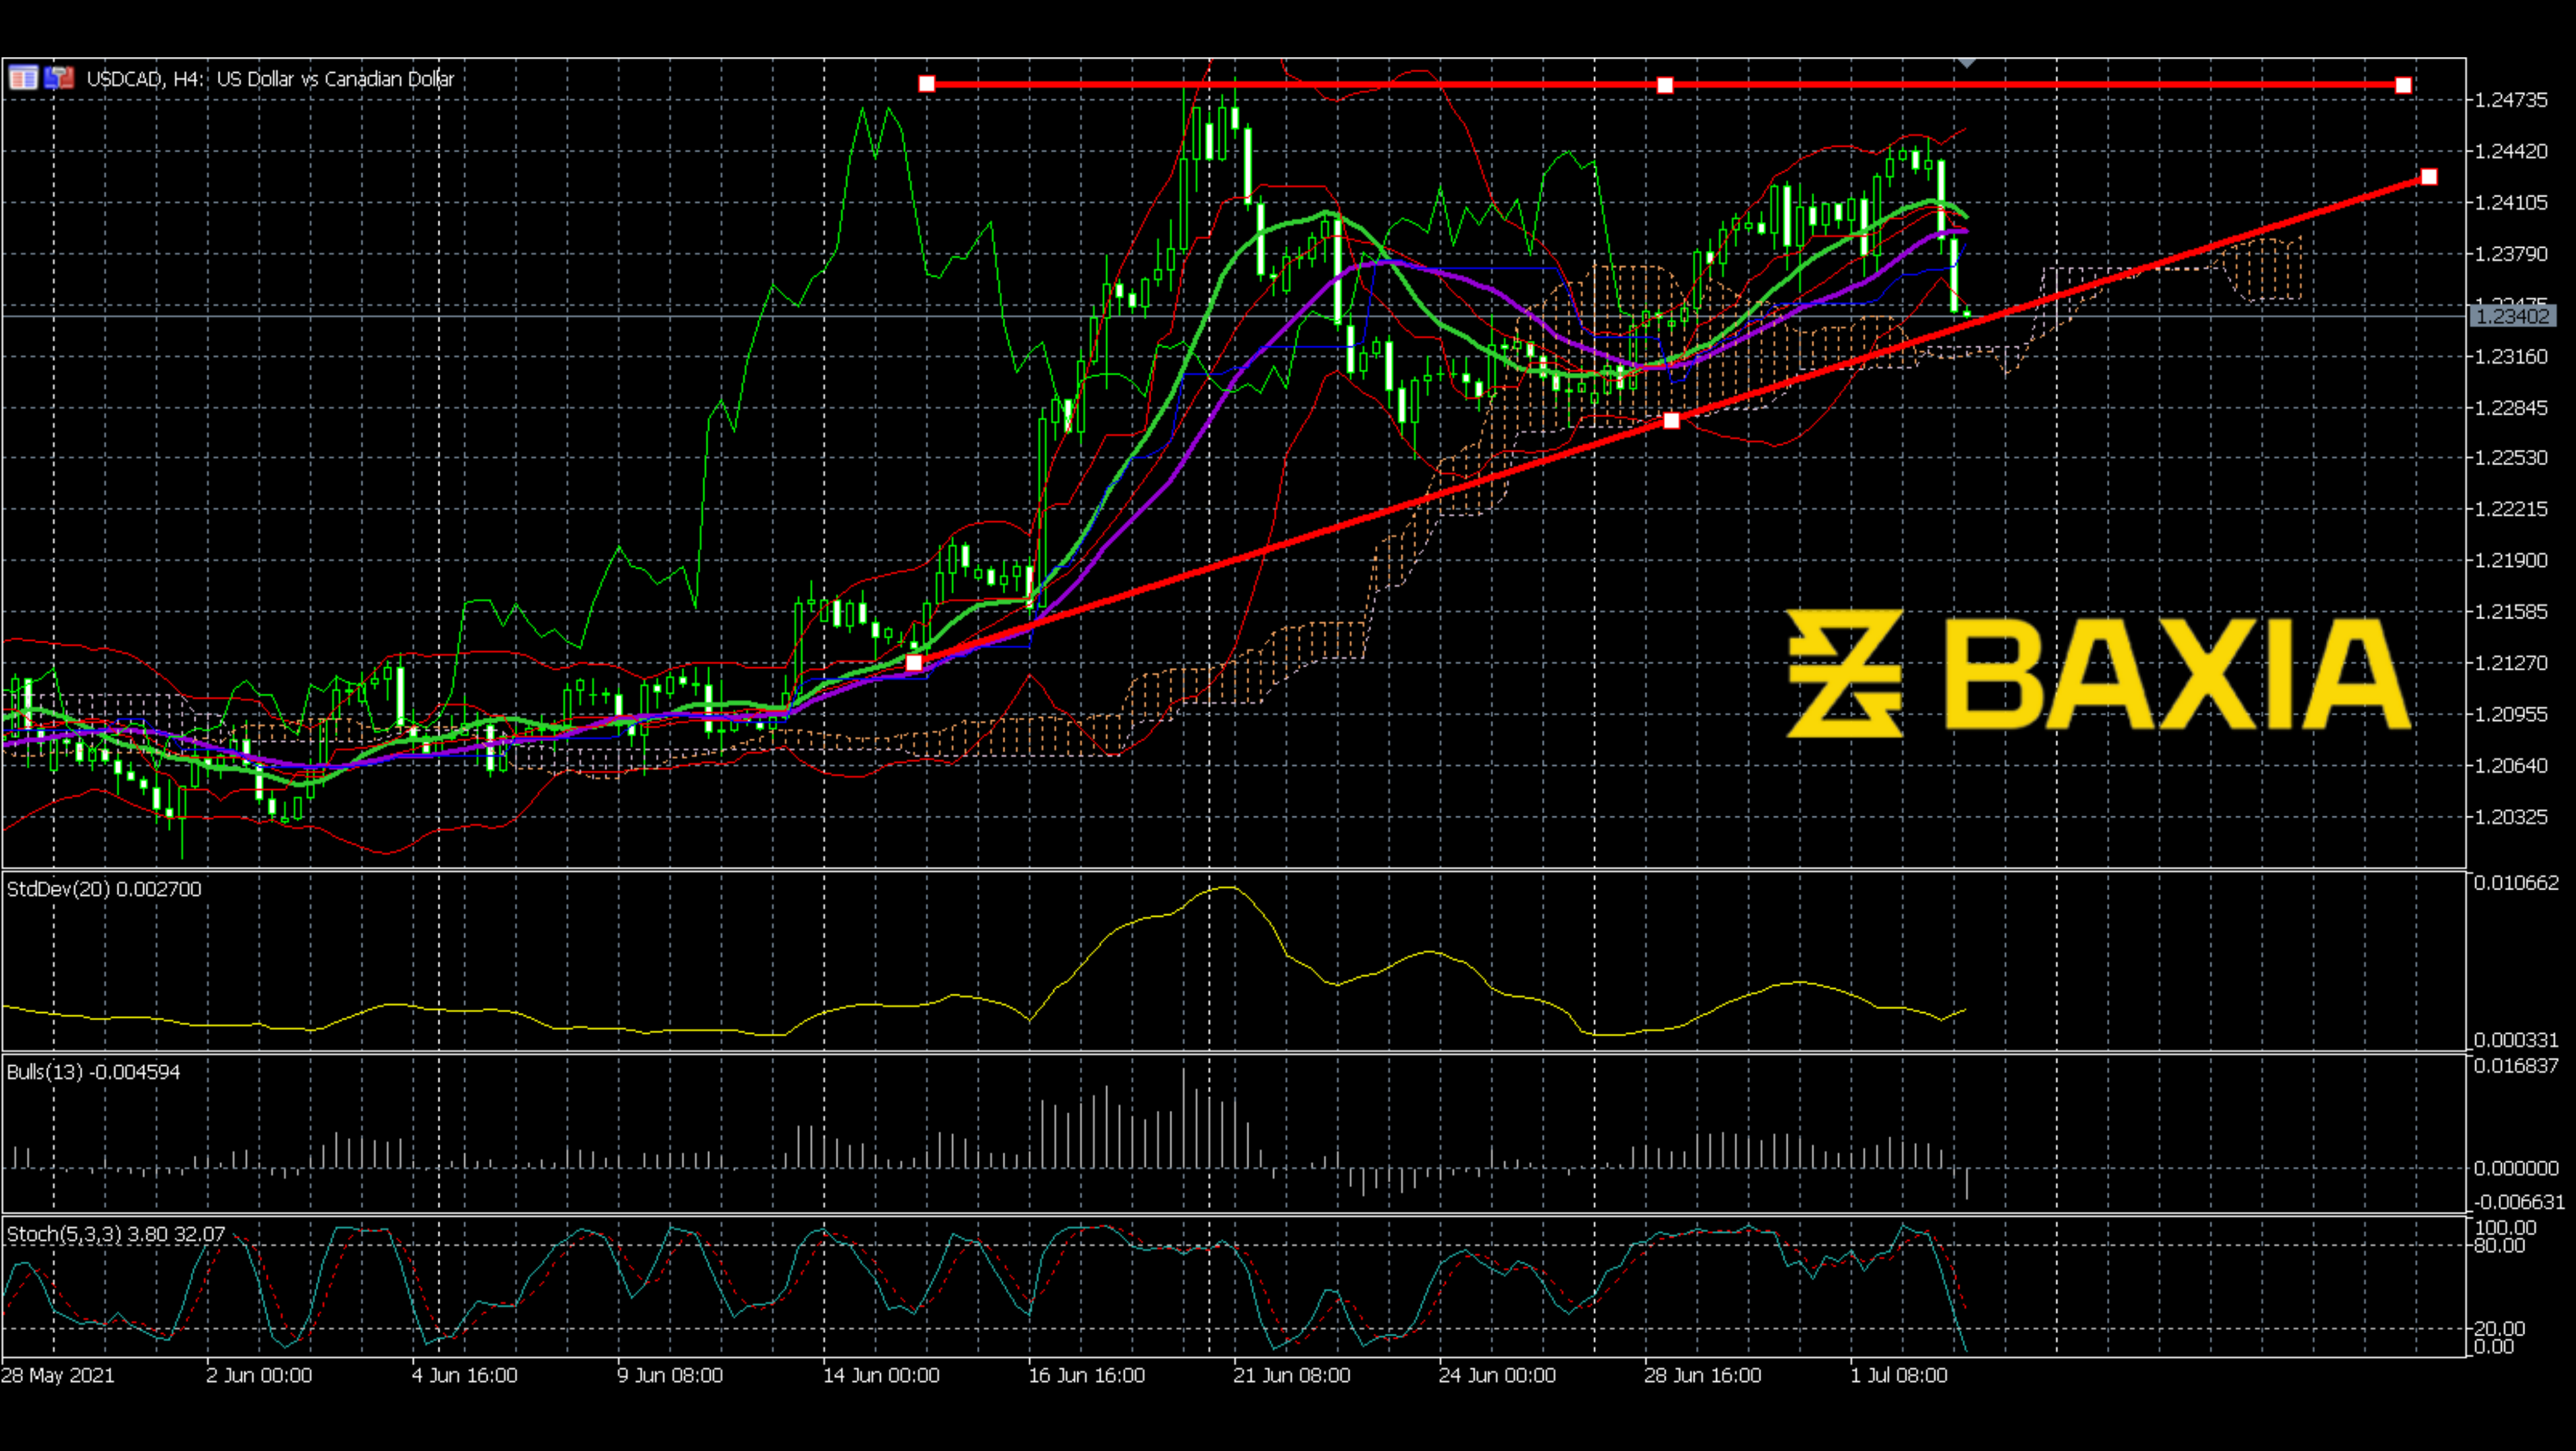
The bull power made a downward spark; however, the price still moves in the ascending triangle, so fluctuation is inevitable. The Stochastics also in a downward trend, which the same reason could explain as bull power. And now the Stochastics already touched the oversold line, so the price could bounce back anytime.
We love to hear new ideas from traders and want to know what you think!
If you like this topic and want to suggest future topics that you find helpful, let us know by clicking the ‘submit your feedback’ button below.

Trading foreign exchange on margin carries a high level of risk, and may not be suitable for all investors. Before deciding to trade foreign exchange you should carefully consider your investment objectives, level of experience, and risk appetite.
Nothing contained in this website should be construed as investment advice. Any reference to an investment's past or potential performance is not, and should not be construed as, a recommendation or as a guarantee of any specific outcome or profit.