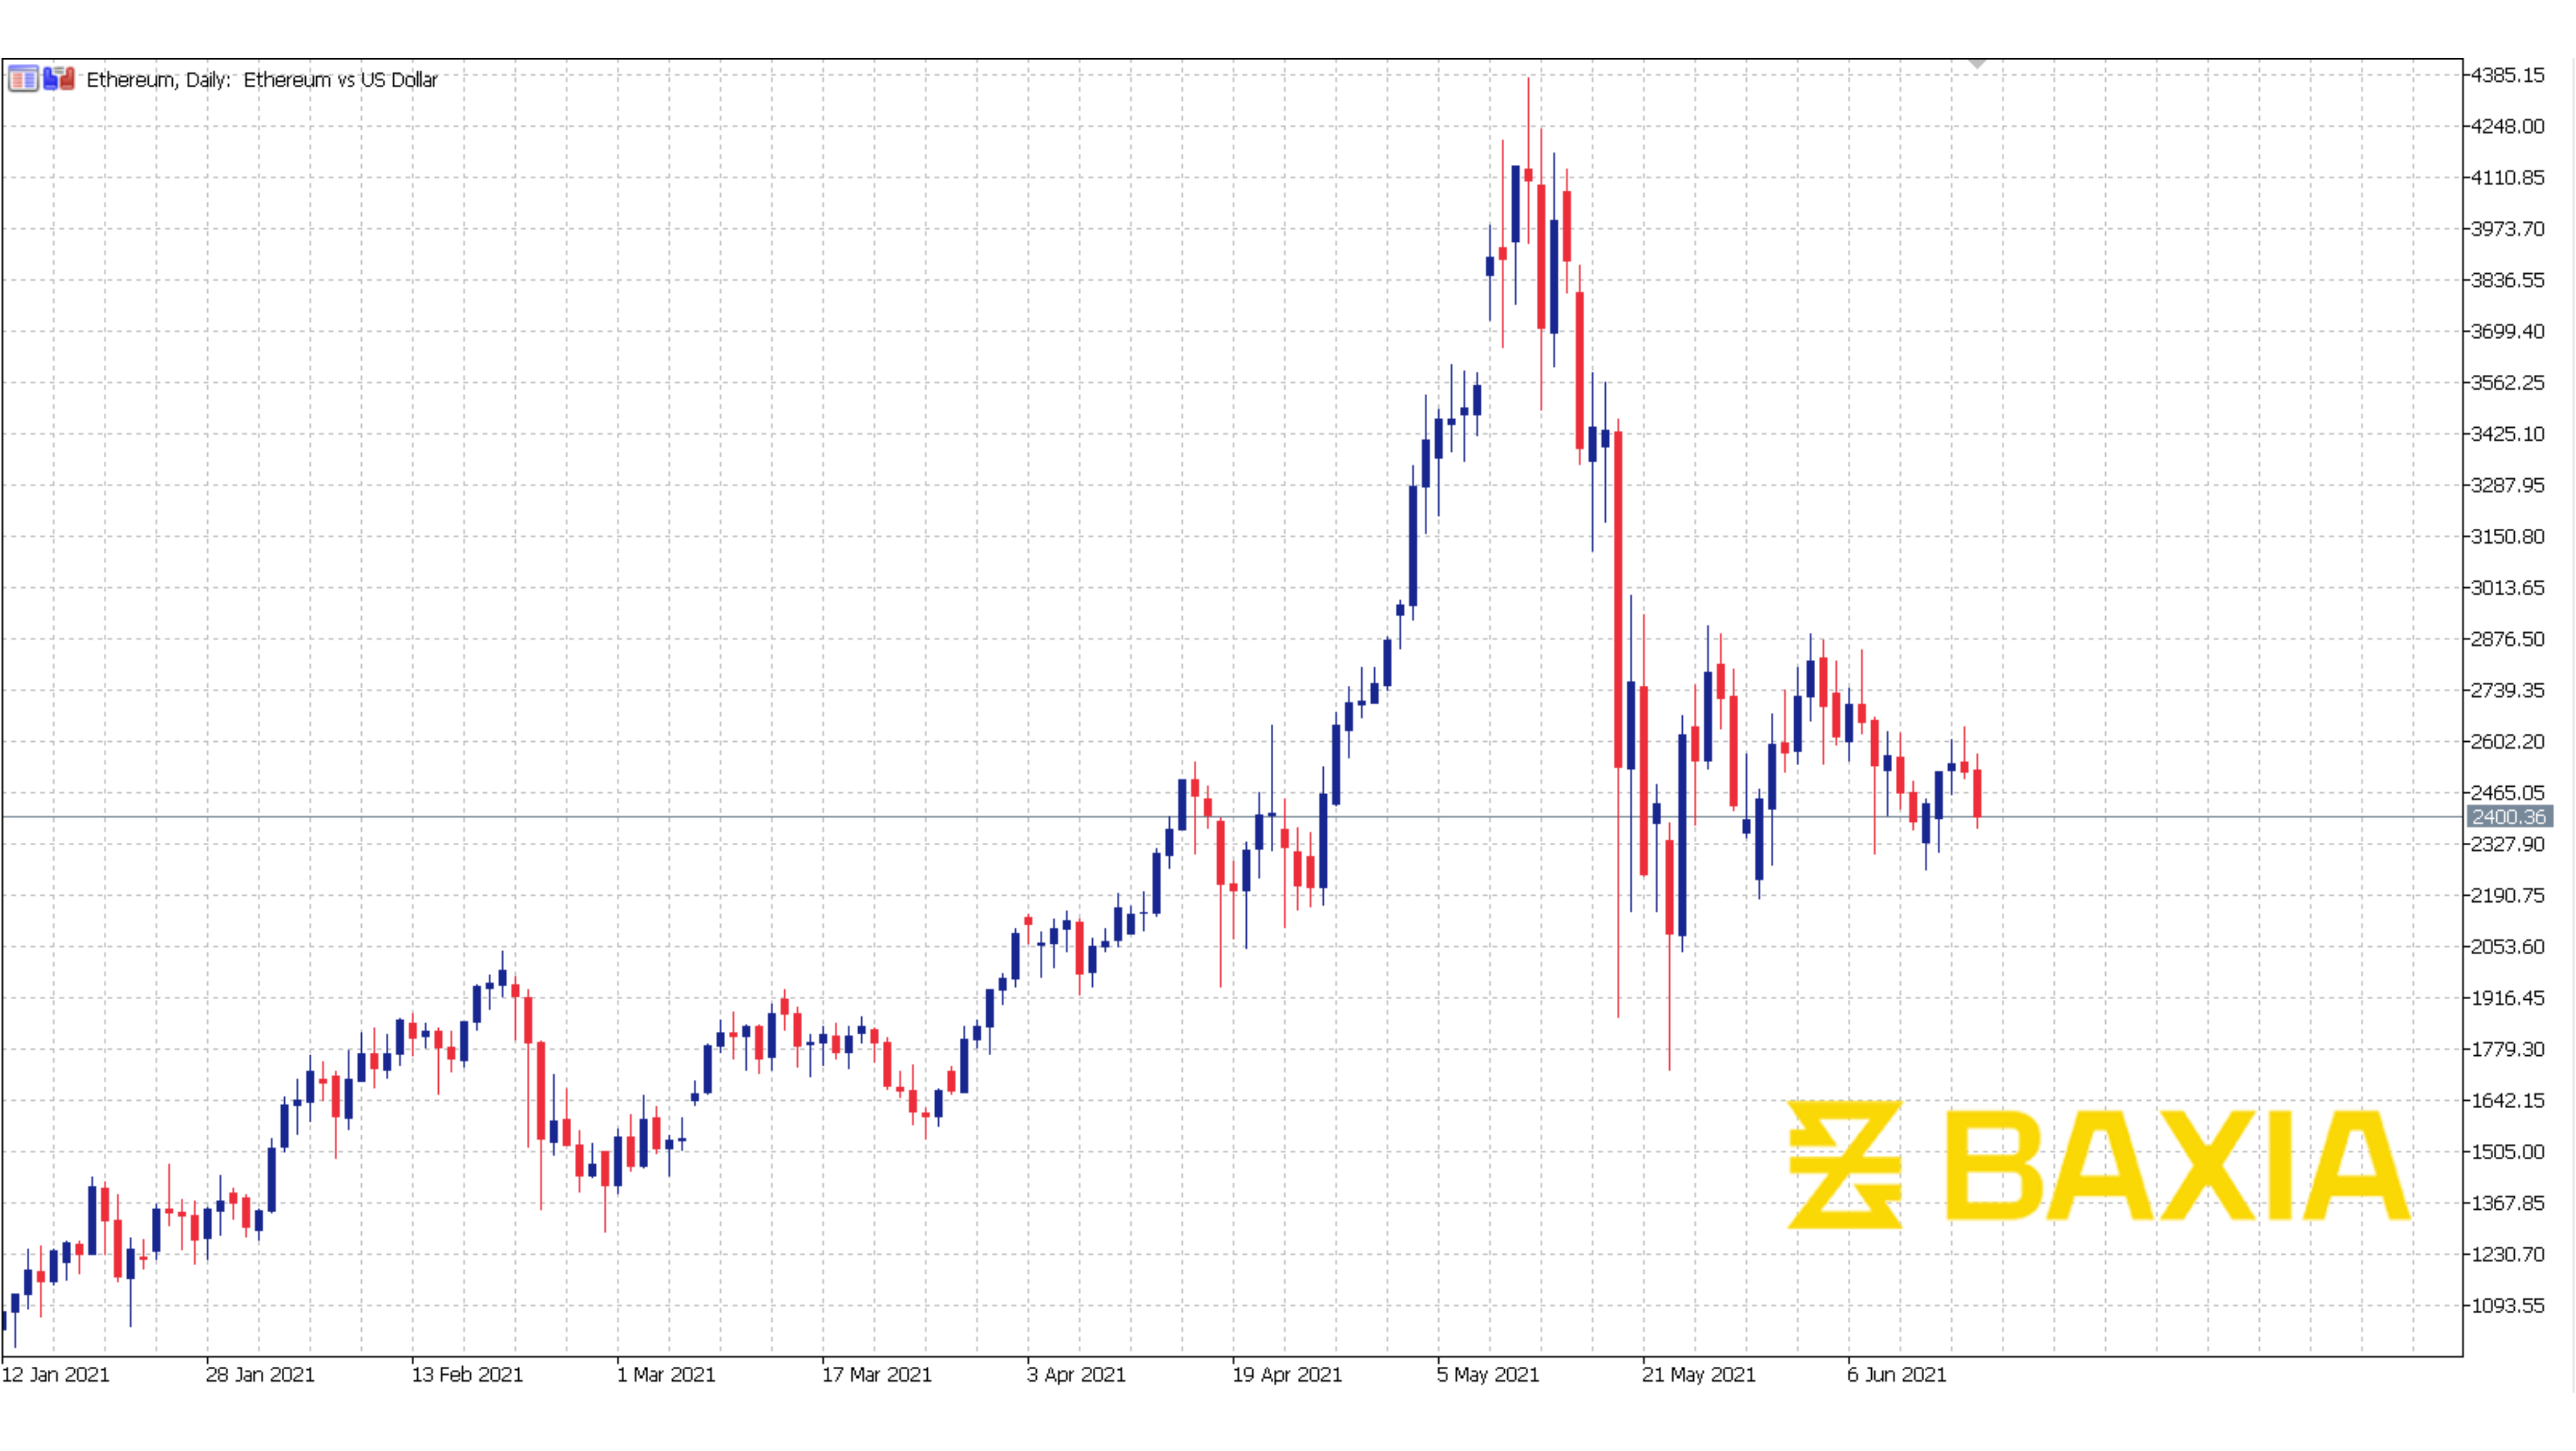

In the ever-evolving landscape of cryptocurrency, Ethereum (ETH) has recently taken center stage with an impressive rally of 36%, surging from $1996 to $2713 in just one week. As traders catch their breath from the whirlwind, the charts unfold a tale of potential opportunity and caution.
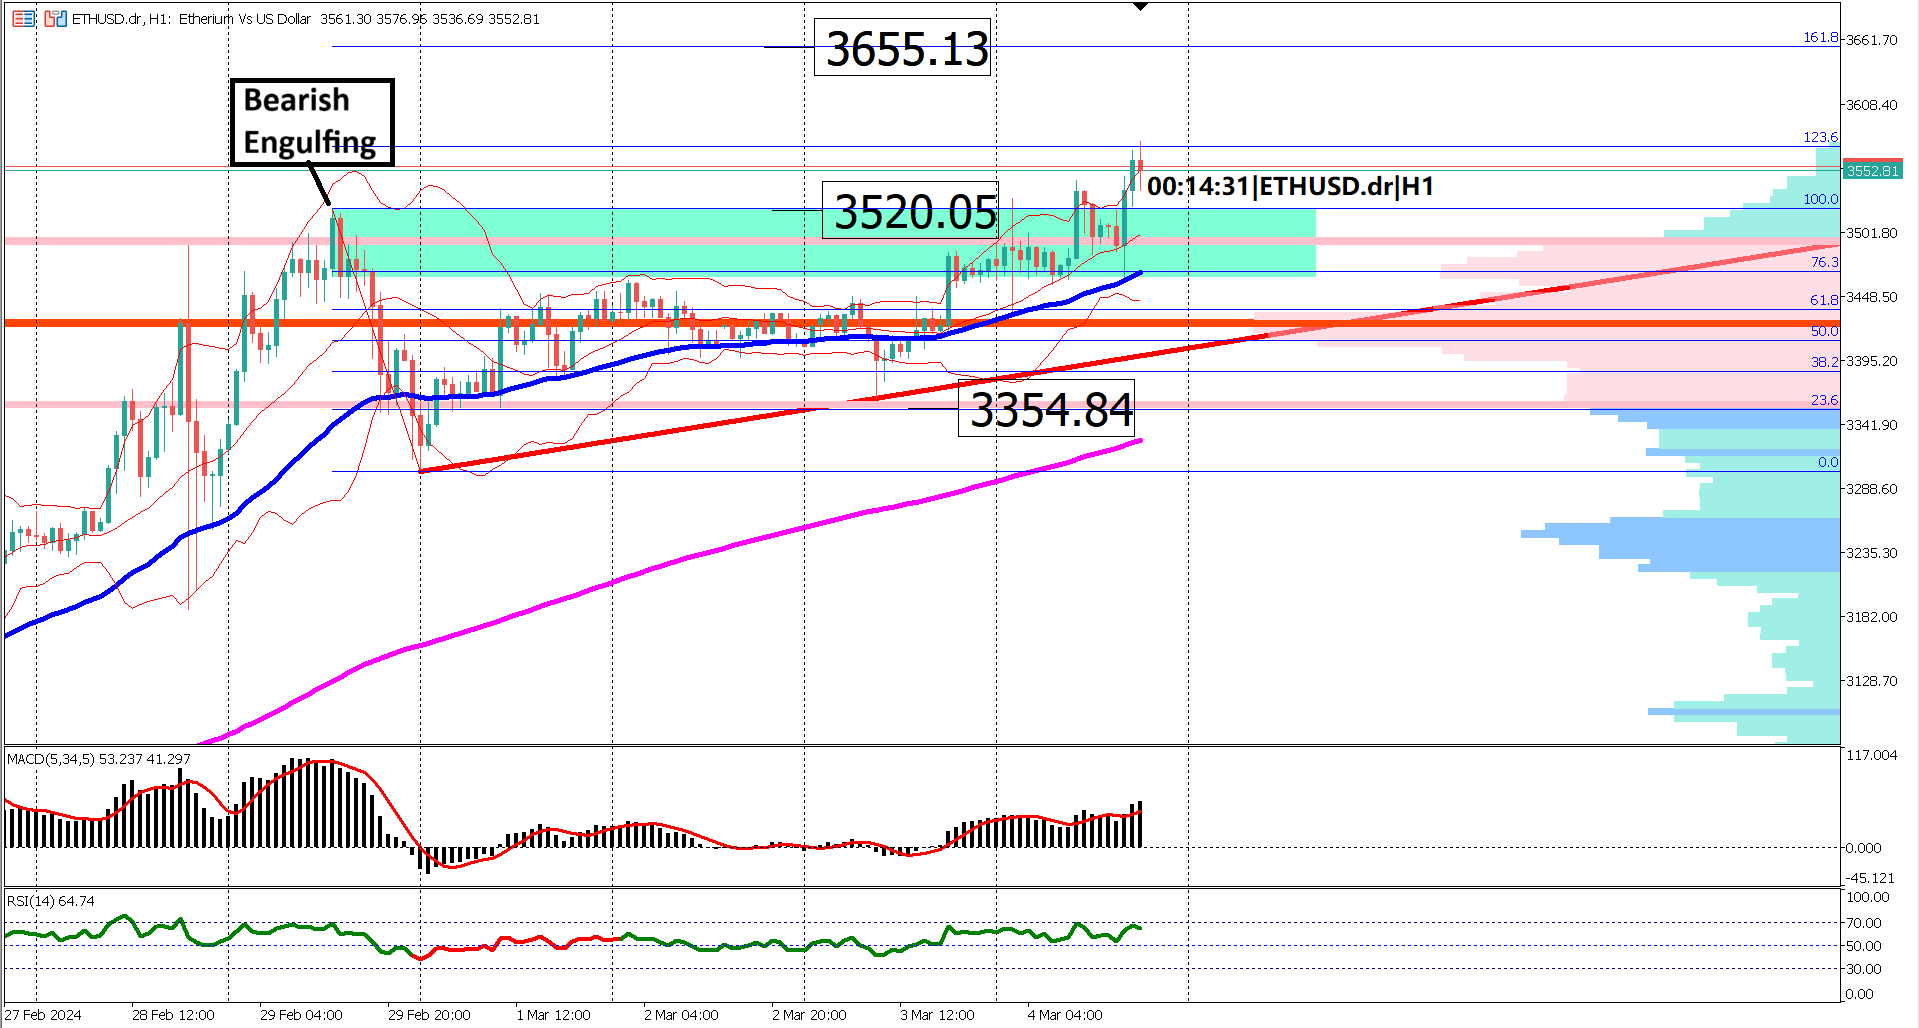
The rally, marked by a robust bullish momentum, met a temporary halt signaled by a distinctive bearish engulfing candlestick. This pattern often serves as a harbinger of resistance, and indeed, a Fibonacci extension at 161.8% emerges as a likely contender for the ceiling that capped the recent bullish fervor.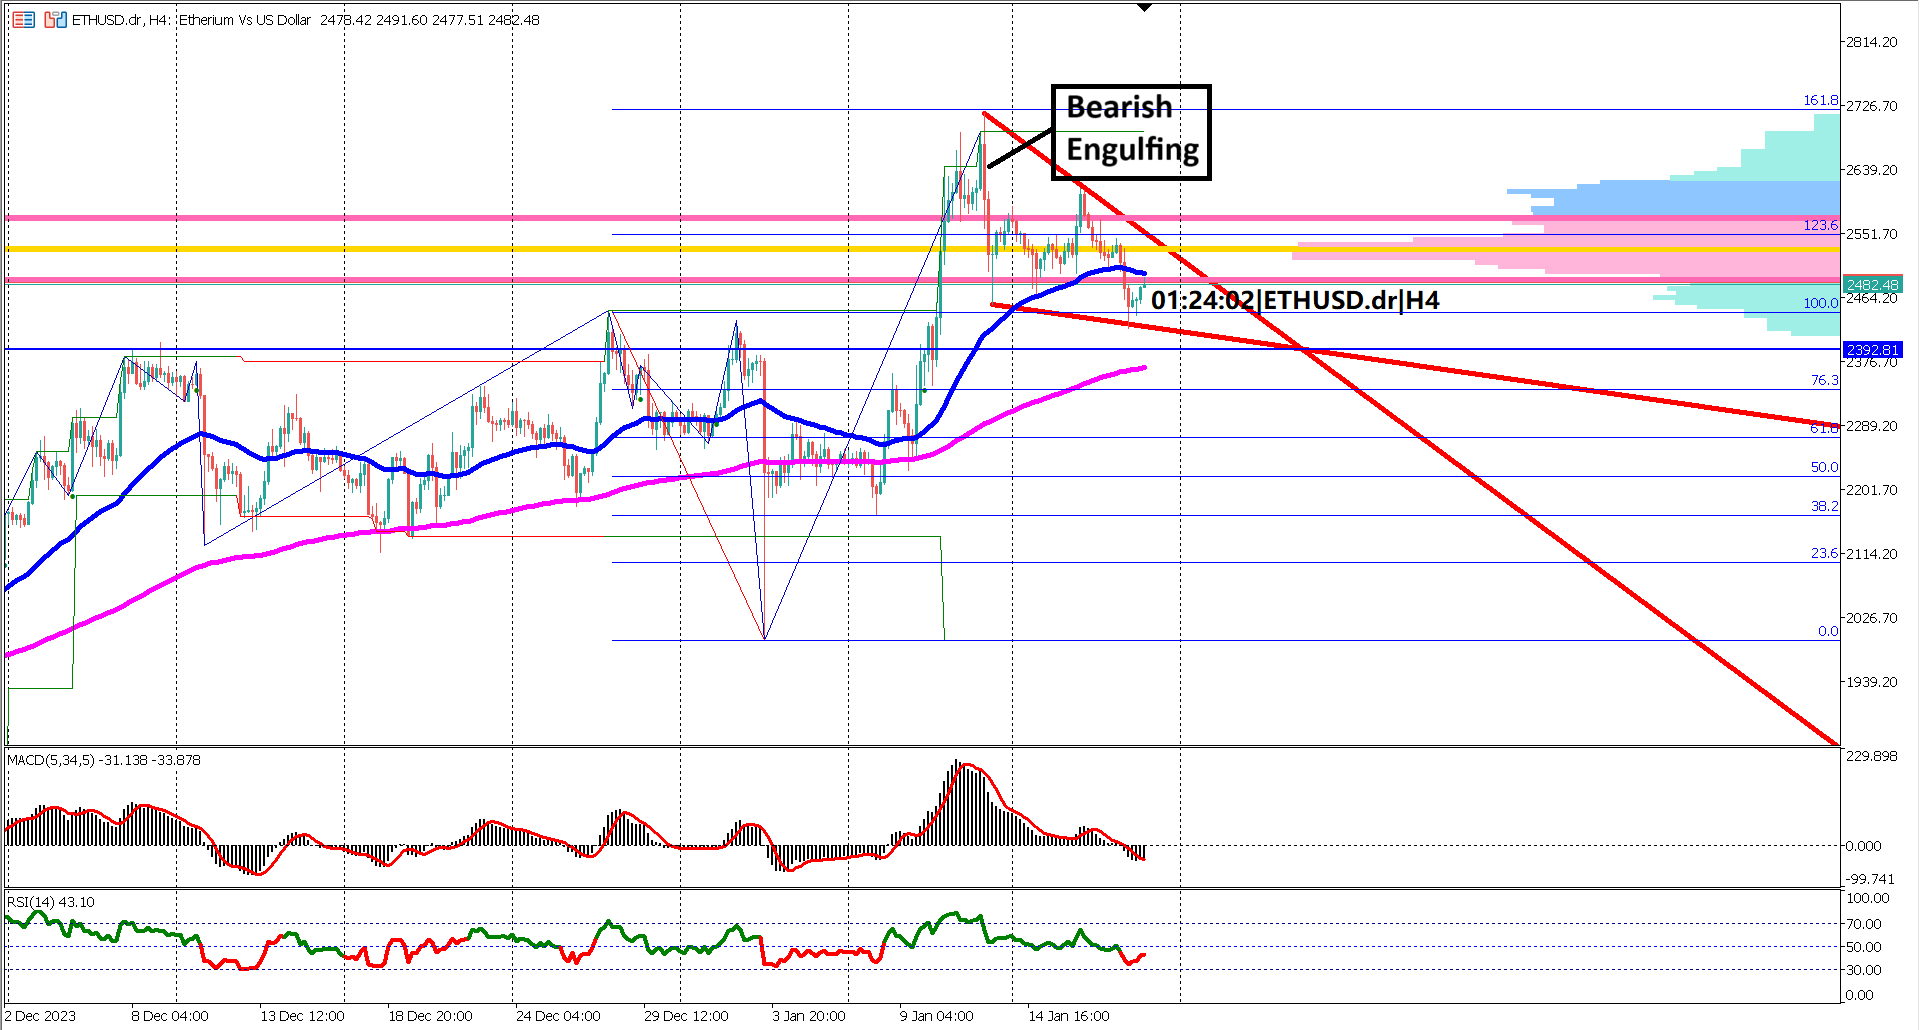
Adding to the narrative, a falling wedge chart pattern emerges from the aftermath of the bullish escapade. This pattern, known for its potential reversal or continuation implications, provides traders with a roadmap for the next market move. The recent swing high, confirmed by the bearish engulfing candlestick, acts as a pivotal point where the battle between bulls and bears intensifies.
While the EMA 50 and 200 maintain their bullish stance, a subtle shift in momentum becomes evident. The EMA 50, previously charging ahead, is now converging towards the EMA 200. This convergence introduces a zone between the two EMAs, potentially serving as a battleground where bulls may find support.
In the realm of oscillators, caution flags flutter. Both MACD and RSI exhibit bearish signals. The MACD signal line and histogram cross below the 0 level, reflecting a shift in sentiment. Simultaneously, the RSI plunges below the 40% mark and refuses to breach the 60% threshold, marking a sustained bearish phase.
In summary, ETHUSD finds itself in the midst of a bullish correction, navigating the complexities of a falling wedge chart pattern. The potential for a bullish continuation hinges on the breakout from the wedge and a triumphant breach above the recent swing high. Traders should remain vigilant, interpreting the cues from candlestick patterns, Fibonacci levels, and EMA dynamics, as Ethereum charts its course in the cryptocurrency arena.
Forecast 3.82M vs Previous 3.82M

Trading foreign exchange on margin carries a high level of risk, and may not be suitable for all investors. Before deciding to trade foreign exchange you should carefully consider your investment objectives, level of experience, and risk appetite.
Nothing contained in this website should be construed as investment advice. Any reference to an investment's past or potential performance is not, and should not be construed as, a recommendation or as a guarantee of any specific outcome or profit.