
In the dynamic realm of forex trading, the AUDUSD pair is currently in the midst of a fascinating transformation, as a bearish correction seems to be gradually morphing into the early stages of a potential bullish reversal.
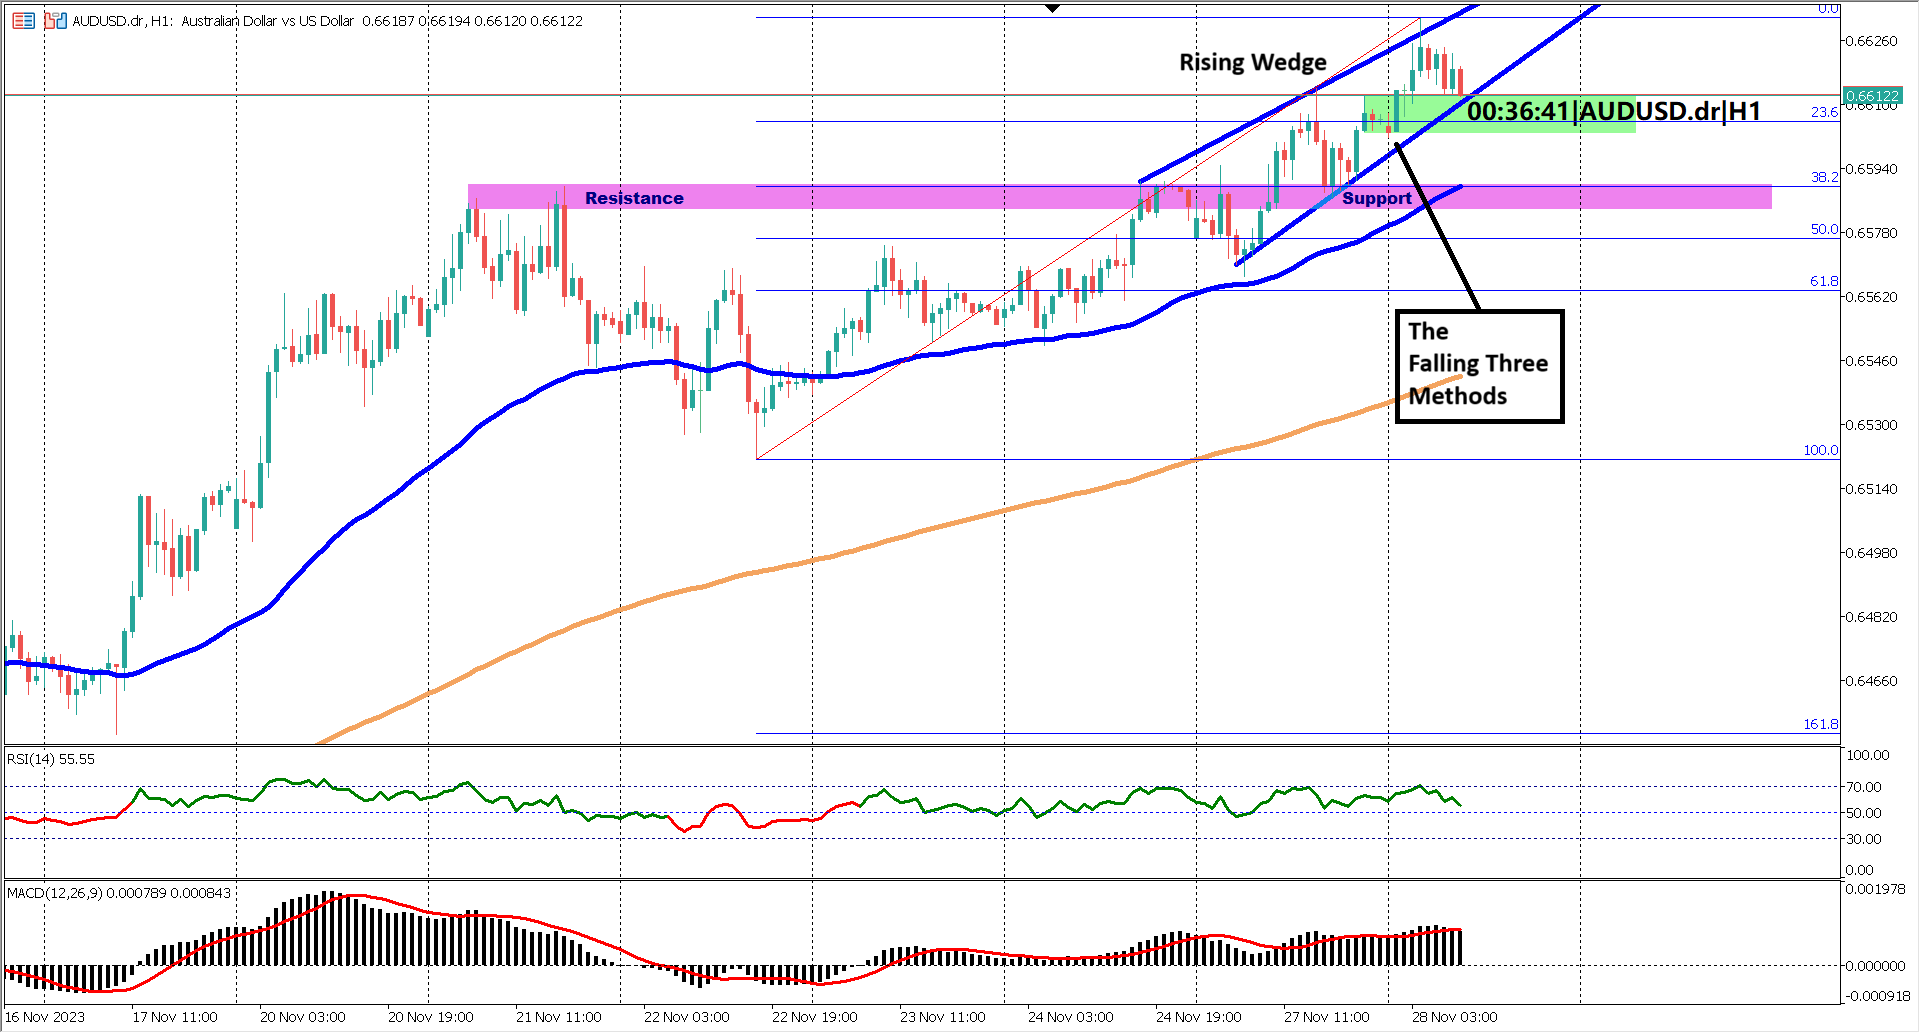
The intricacies of this market shift are revealed through the formation of an intriguing price pattern. The bearish correction has crafted an ascending channel within the confines of a larger descending channel. The technical significance lies in the possibility of a bullish reversal if prices can successfully breach the upper boundary of the descending channel, marking a potential turning point for the AUDUSD pair.
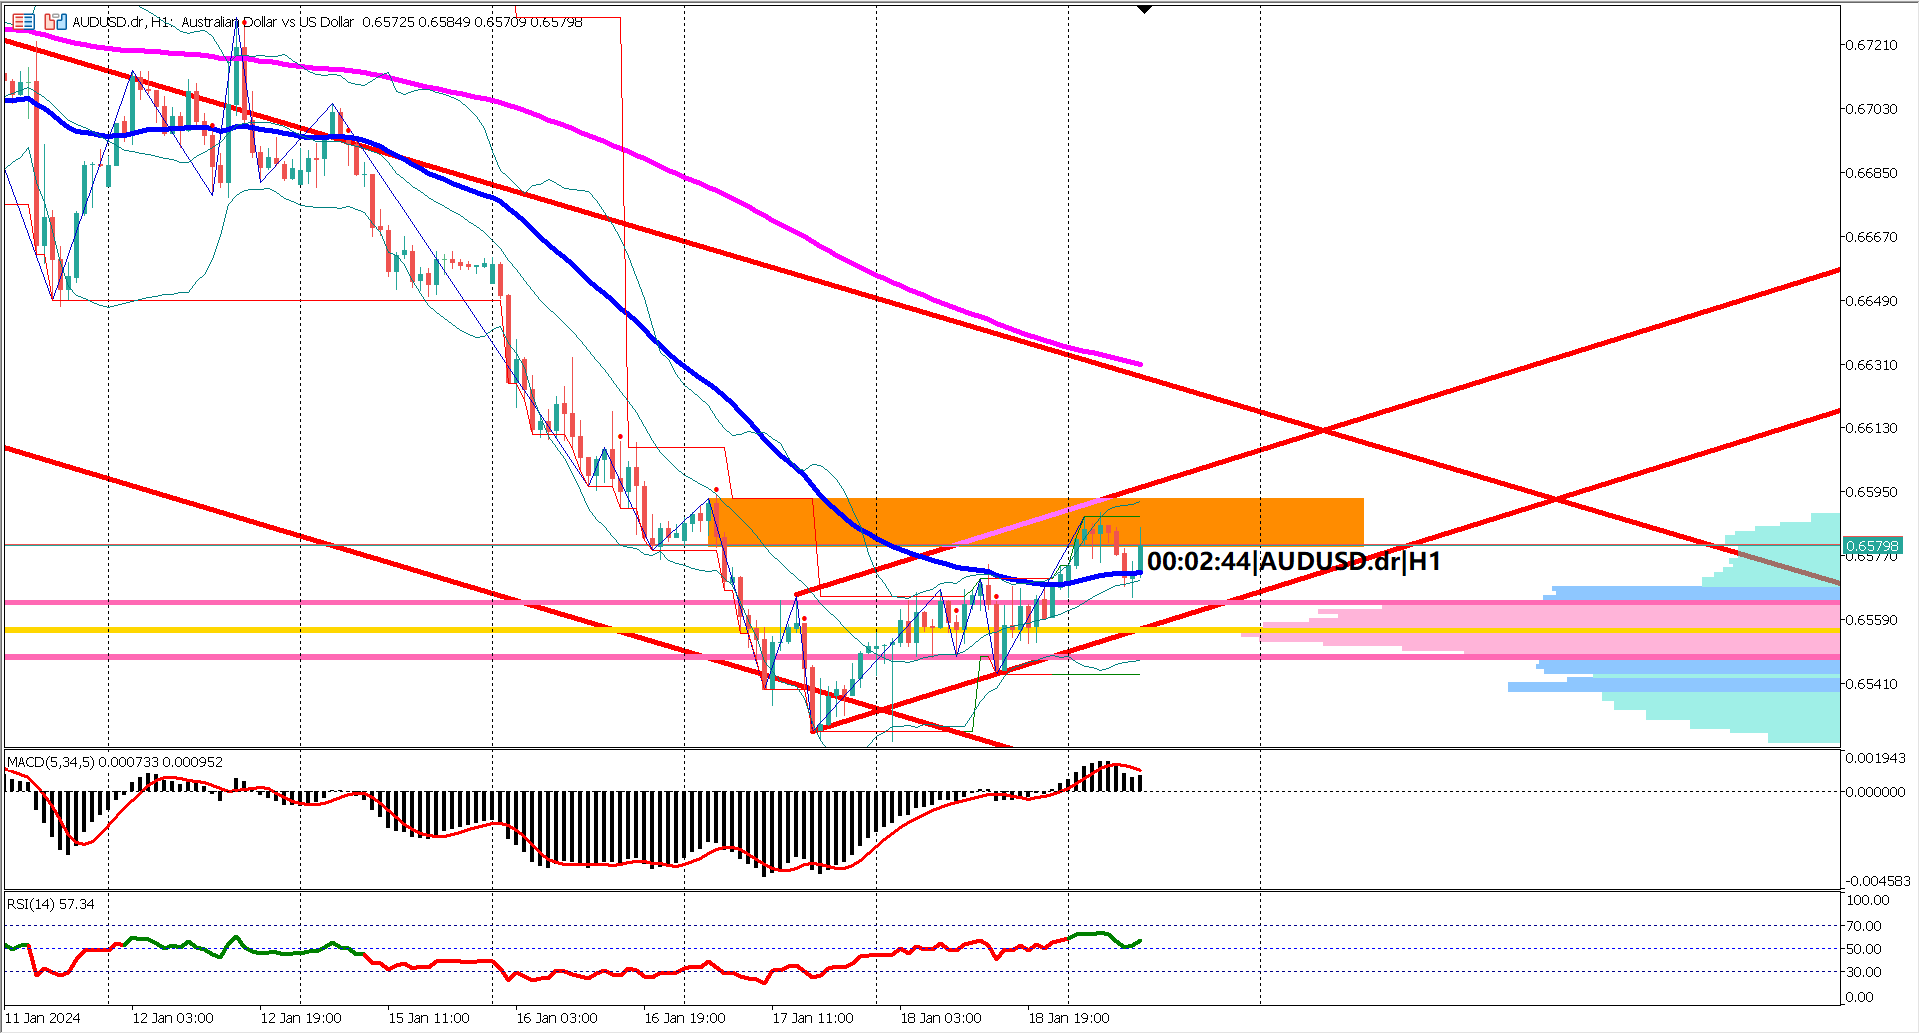
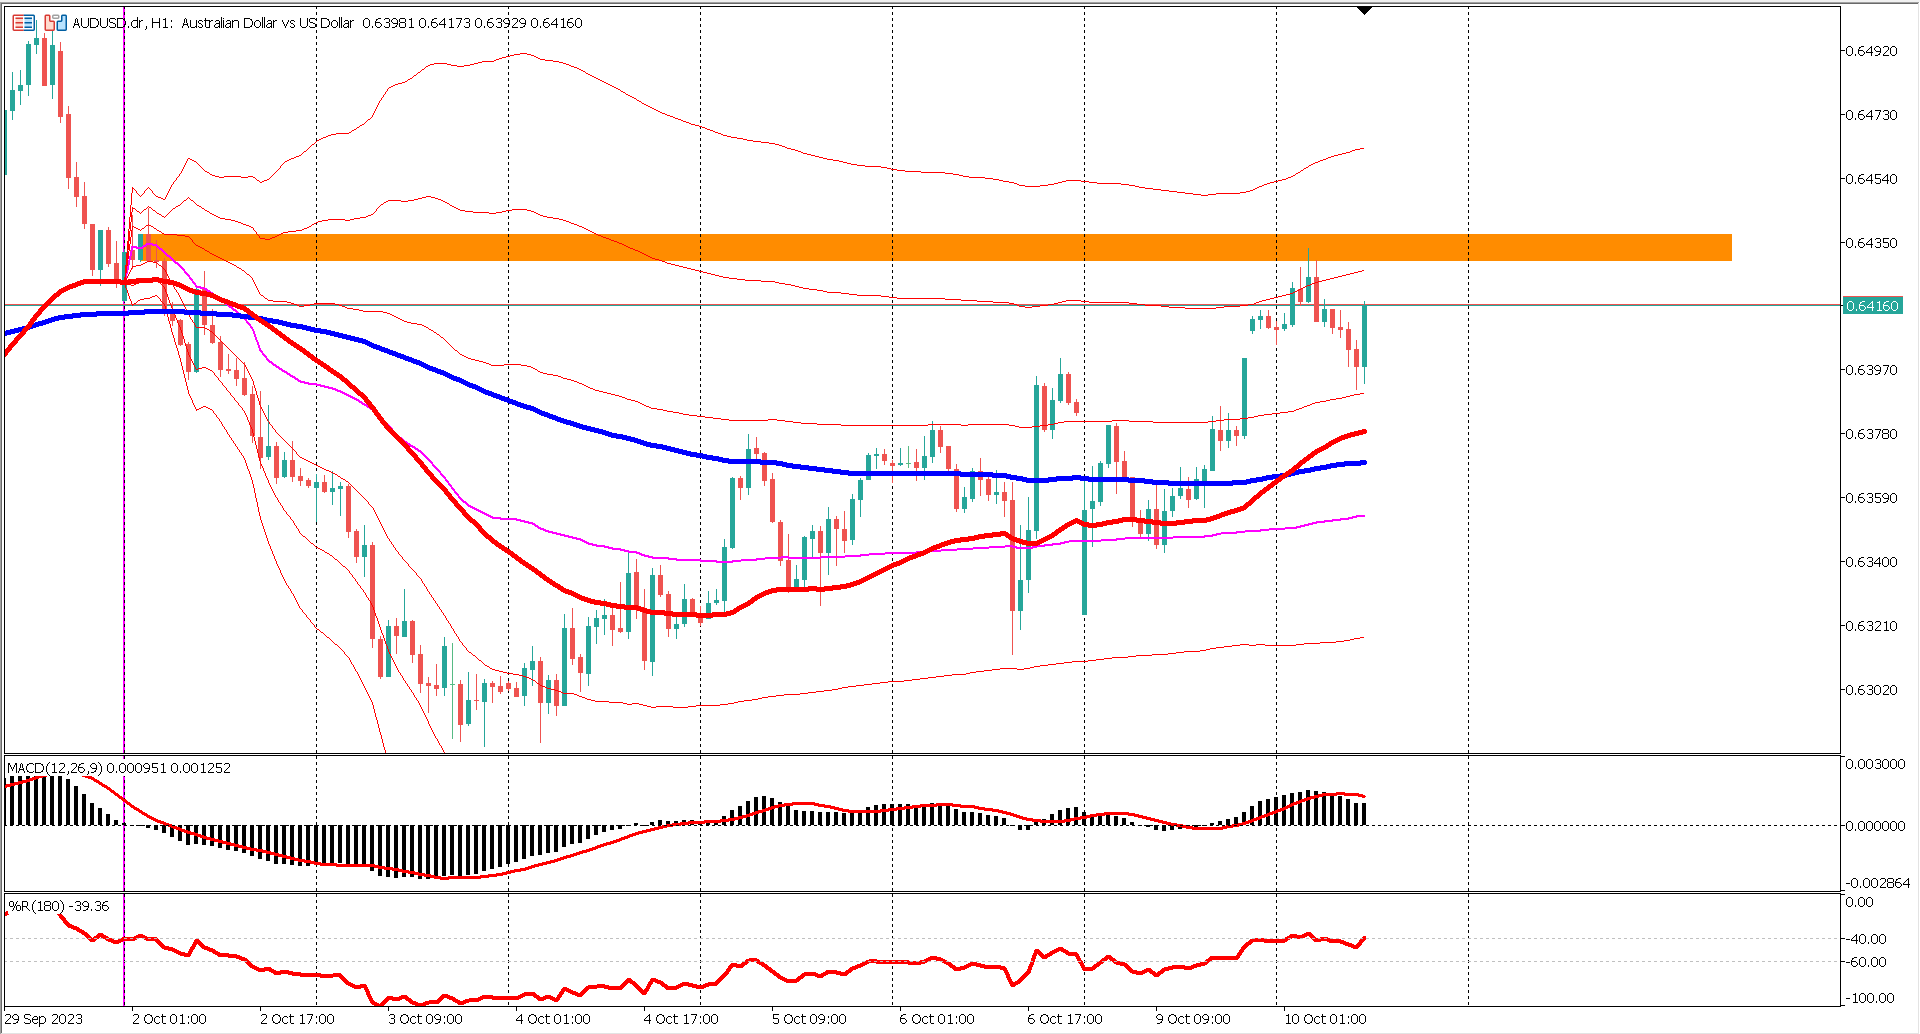
Examining the moving averages, a key indicator in trend analysis, we observe signs of the bear losing its grip. The EMA 50 is converging towards the EMA 200, narrowing the gap between these two moving averages. The pivotal moment for potential bullish confirmation comes with a decisive break above the key resistance level at 0.6600. If this level is breached, the focus shifts to the next plausible key resistance, possibly around or above the EMA 200, situated below 0.6650.
The Bollinger Bands, a volatility indicator, provide additional insights into the evolving market dynamics. Prices have twice breached the Bollinger band of period 20 since yesterday's trading session, accompanied by an expansion of both upper and lower bands. This configuration, with prices residing above the mid band, aligns with the characteristics of a bullish trend. Traders should remain vigilant for any signs of a bearish reversal, such as prices consistently staying below the mid band or both upper and lower bands expanding simultaneously.
Turning our attention to the oscillator indicators, both the RSI (Relative Strength Index) and MACD (Moving Average Convergence Divergence) contribute to the emerging bullish narrative. The RSI has boldly surpassed the 60% level, maintaining its position above this threshold and preventing a dip below 40%. Simultaneously, the MACD histogram and signal line have crossed above the zero line during the current Asian trading range, solidifying the bullish sentiment.
In summary, a comprehensive analysis of multiple indicators paints a nuanced picture for AUDUSD. While the EMA 50 & 200 suggest a lingering bearish trend, the narrowing gap between these averages indicates a potential slowing of the bearish momentum. The short-term bullish signals from RSI, MACD, and the Bollinger Bands hint at a shift in favor of the bulls. Traders navigating this complex landscape should remain alert to the critical breakout points and be prepared for potential trend reversals in the evolving AUDUSD market.
Complex Market Transformation: AUDUSD is undergoing a complex transformation, transitioning from a bearish correction to the early stages of a potential bullish reversal.
Dual Channel Formation: The bearish correction has given rise to a distinctive pattern—an ascending channel within a larger descending channel. A breach above the upper boundary of the descending channel could signal a pivotal moment for the pair.
Moving Averages Dynamics: The EMA 50 converging towards the EMA 200 suggests a potential slowing of bearish momentum. Confirmation of a bullish reversal hinges on a clear break above the key resistance at 0.6600, with attention shifting to subsequent resistance near or above the EMA 200.
Bollinger Bands Indication: Recent breaches of the Bollinger Bands, accompanied by expanding upper and lower bands, indicate a bullish trend. Traders should stay vigilant for signs of a potential bearish reversal, such as prices consistently below the mid band or simultaneous expansion of upper and lower bands.
Oscillator Signals: Both RSI and MACD provide robust bullish signals. RSI's breach above the 60% level and the MACD histogram and signal line crossing above zero underscore the emerging bullish sentiment.
Forecast 3.82M vs Previous 3.82M

Trading foreign exchange on margin carries a high level of risk, and may not be suitable for all investors. Before deciding to trade foreign exchange you should carefully consider your investment objectives, level of experience, and risk appetite.
Nothing contained in this website should be construed as investment advice. Any reference to an investment's past or potential performance is not, and should not be construed as, a recommendation or as a guarantee of any specific outcome or profit.