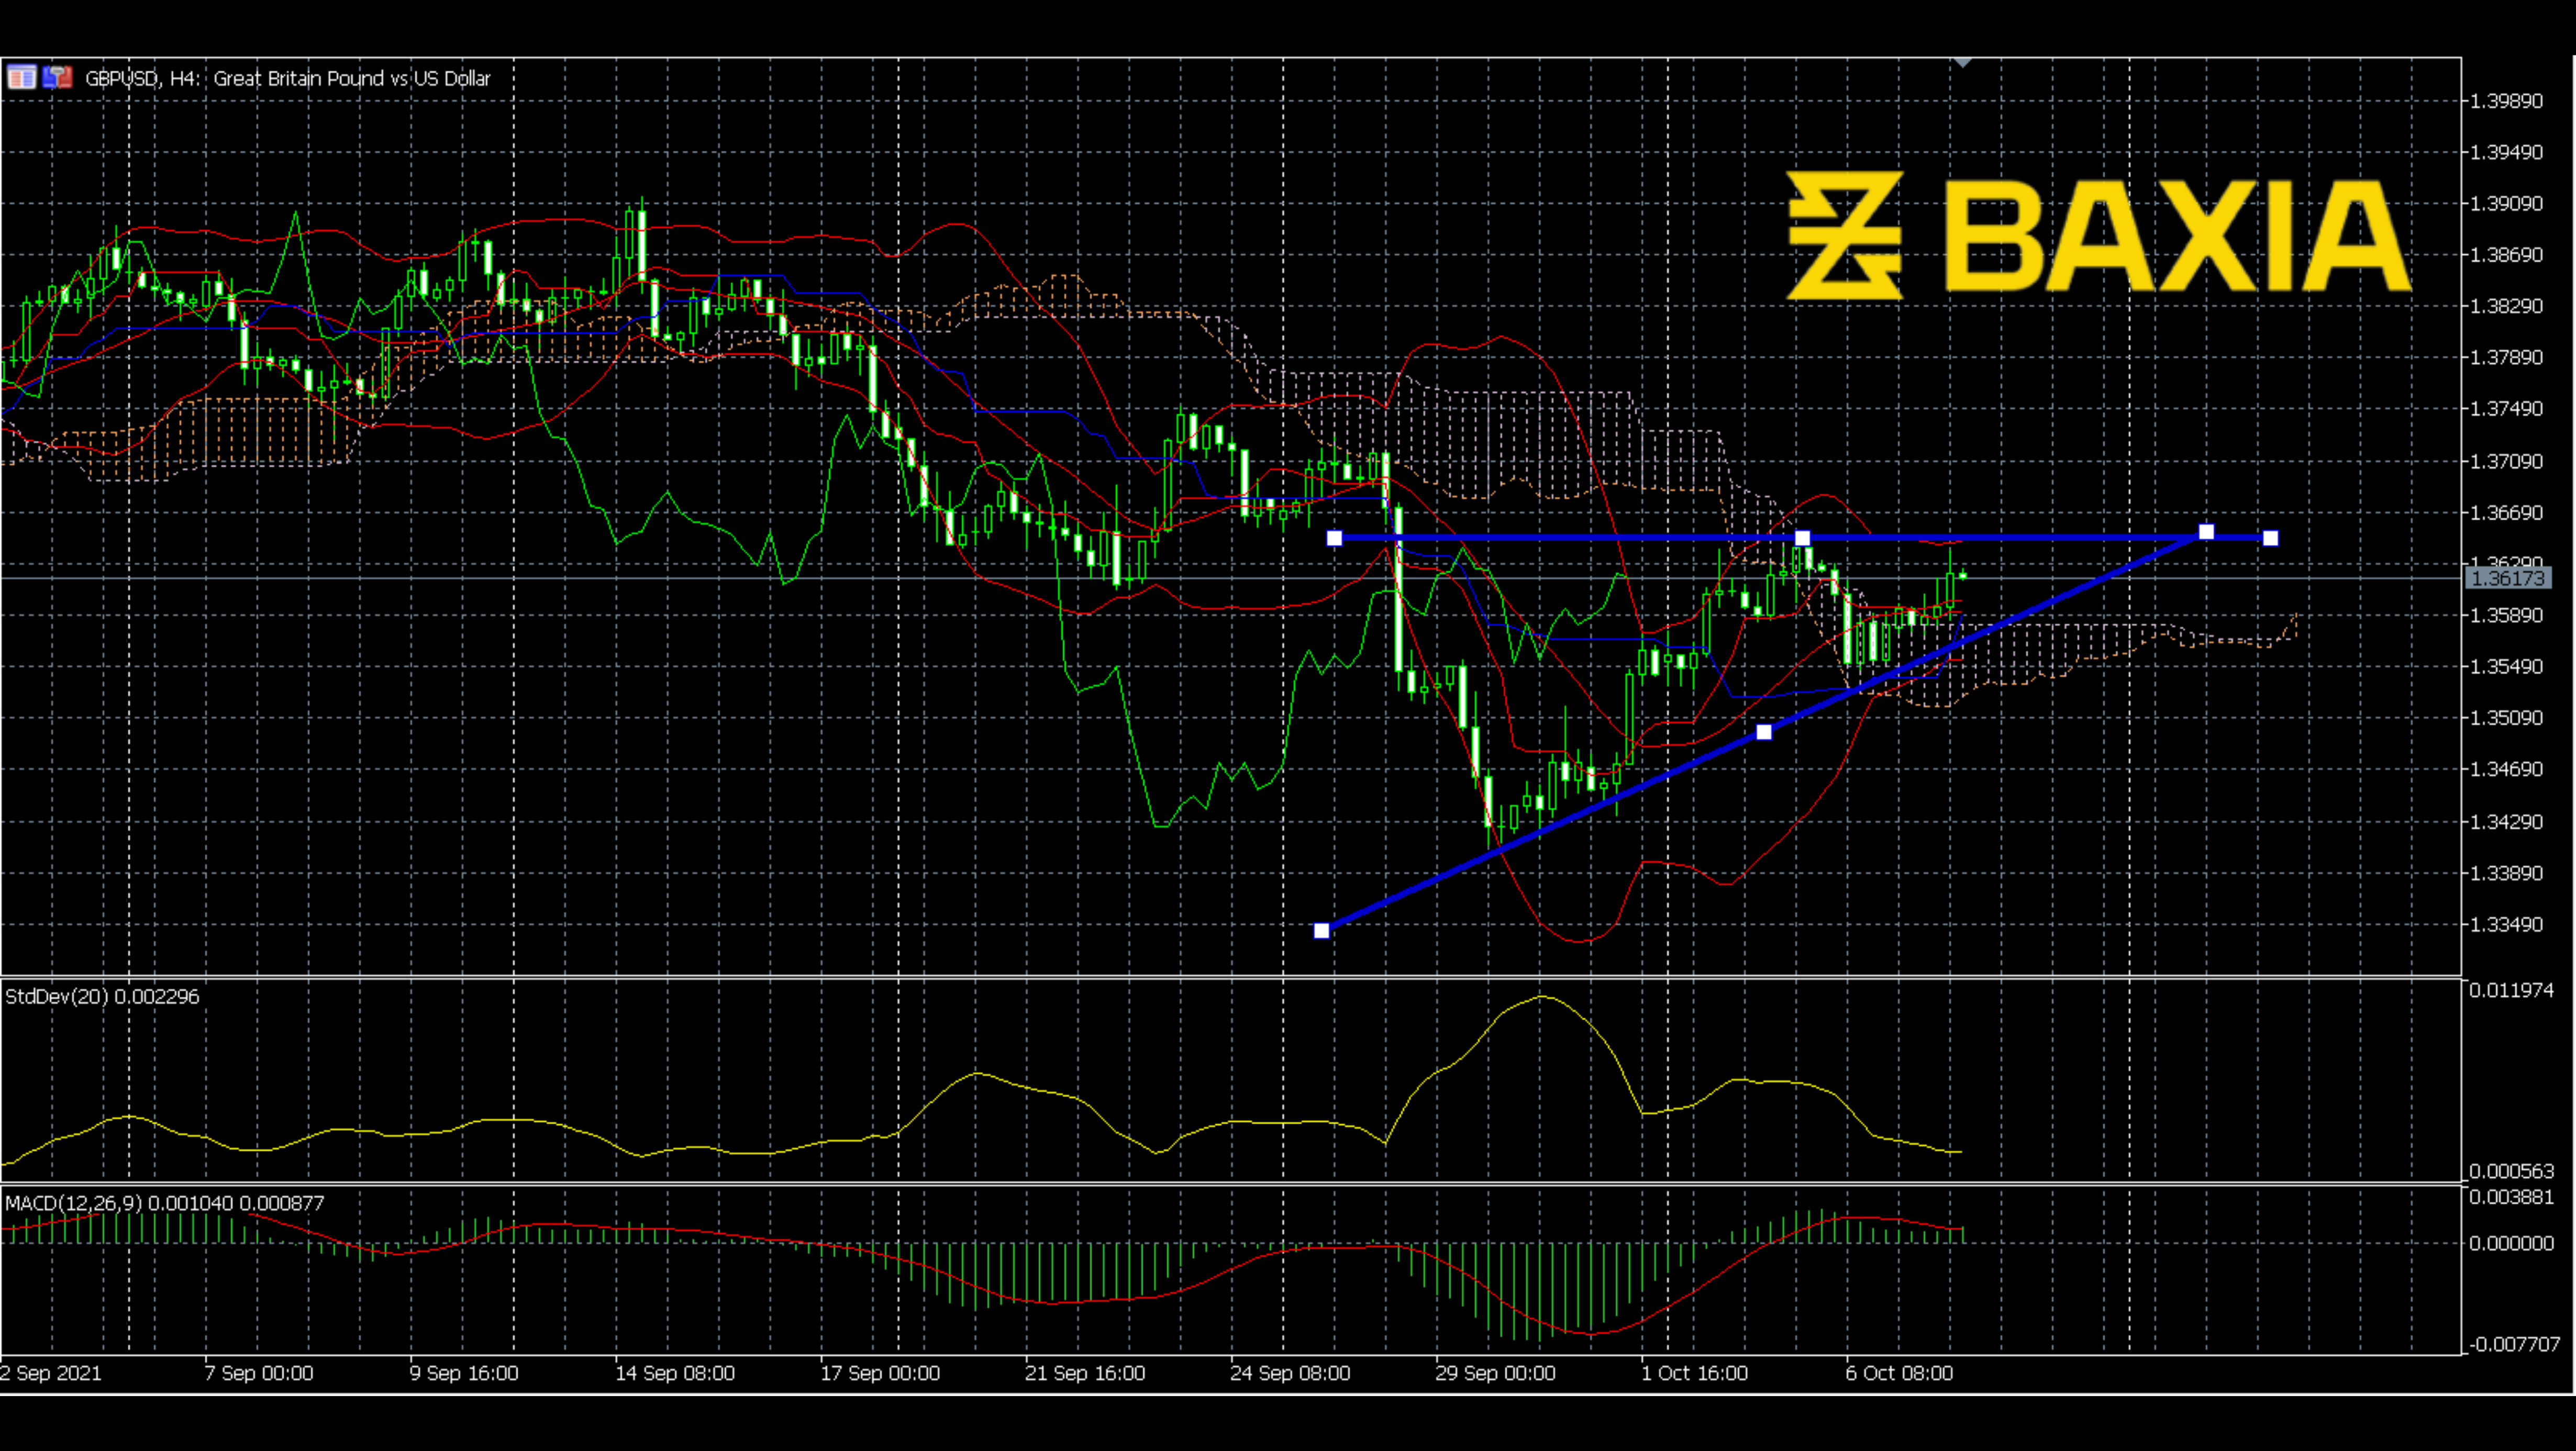

After a twenty days downward trend, the price met the support at the end of September. Although this was a significant and solid downward movement that seemed long-lasting, the price stopped going down. In this situation, the upward movement may look like a retracement; however, the pattern of waves shows another story.
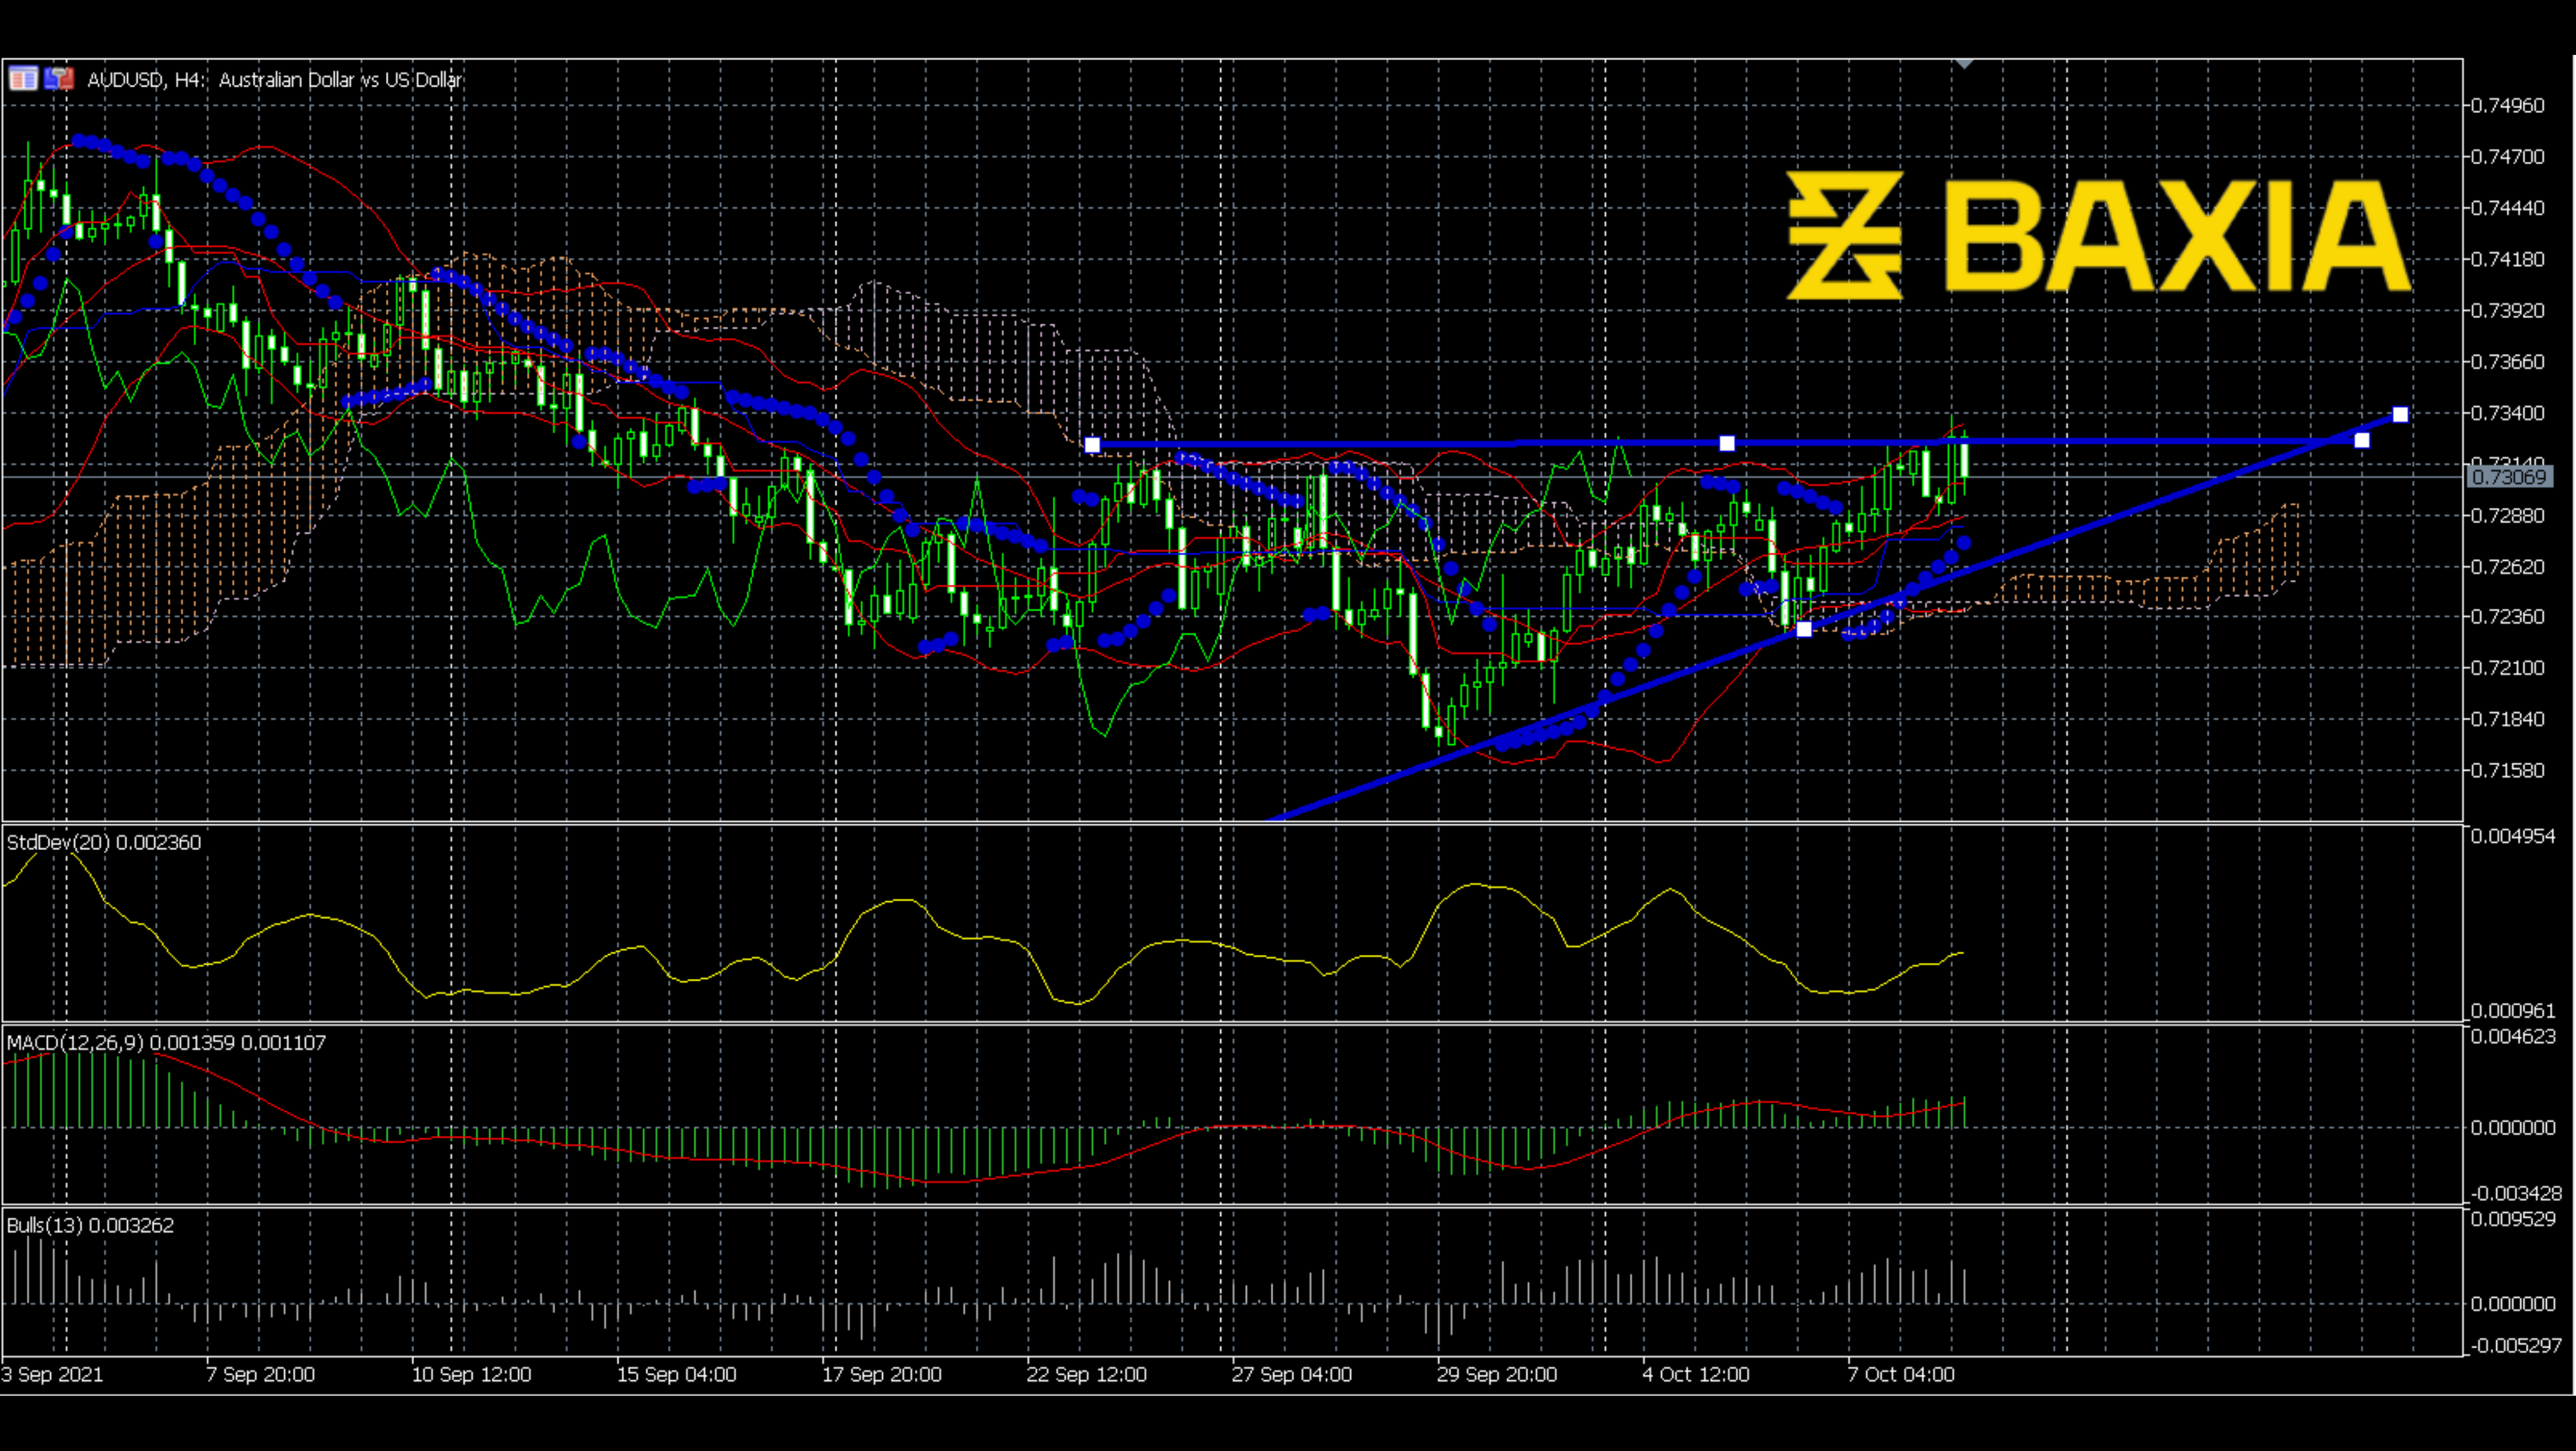
As can be seen, the price has been making waves after meeting the support; these waves' range has been shrinking. Finally, we can see that the price has made an ascending triangle. From the four-hour chart, we can see that the ascending triangle is almost done. The ascending triangle is always considered a bullish signal. Recently, the Bollinger Bands shrunk, which is a breakout signal. We can also see the Ichimoku cloud is moving below the price line. Another thing is that the MACD just made a bullish cross. So we already have bullish signals here. Let's expect a breakup.
We love to hear new ideas from traders and want to know what you think!
If you like this topic and want to suggest future topics that you find helpful, let us know by clicking the ‘submit your feedback’ button below.

Trading foreign exchange on margin carries a high level of risk, and may not be suitable for all investors. Before deciding to trade foreign exchange you should carefully consider your investment objectives, level of experience, and risk appetite.
Nothing contained in this website should be construed as investment advice. Any reference to an investment's past or potential performance is not, and should not be construed as, a recommendation or as a guarantee of any specific outcome or profit.