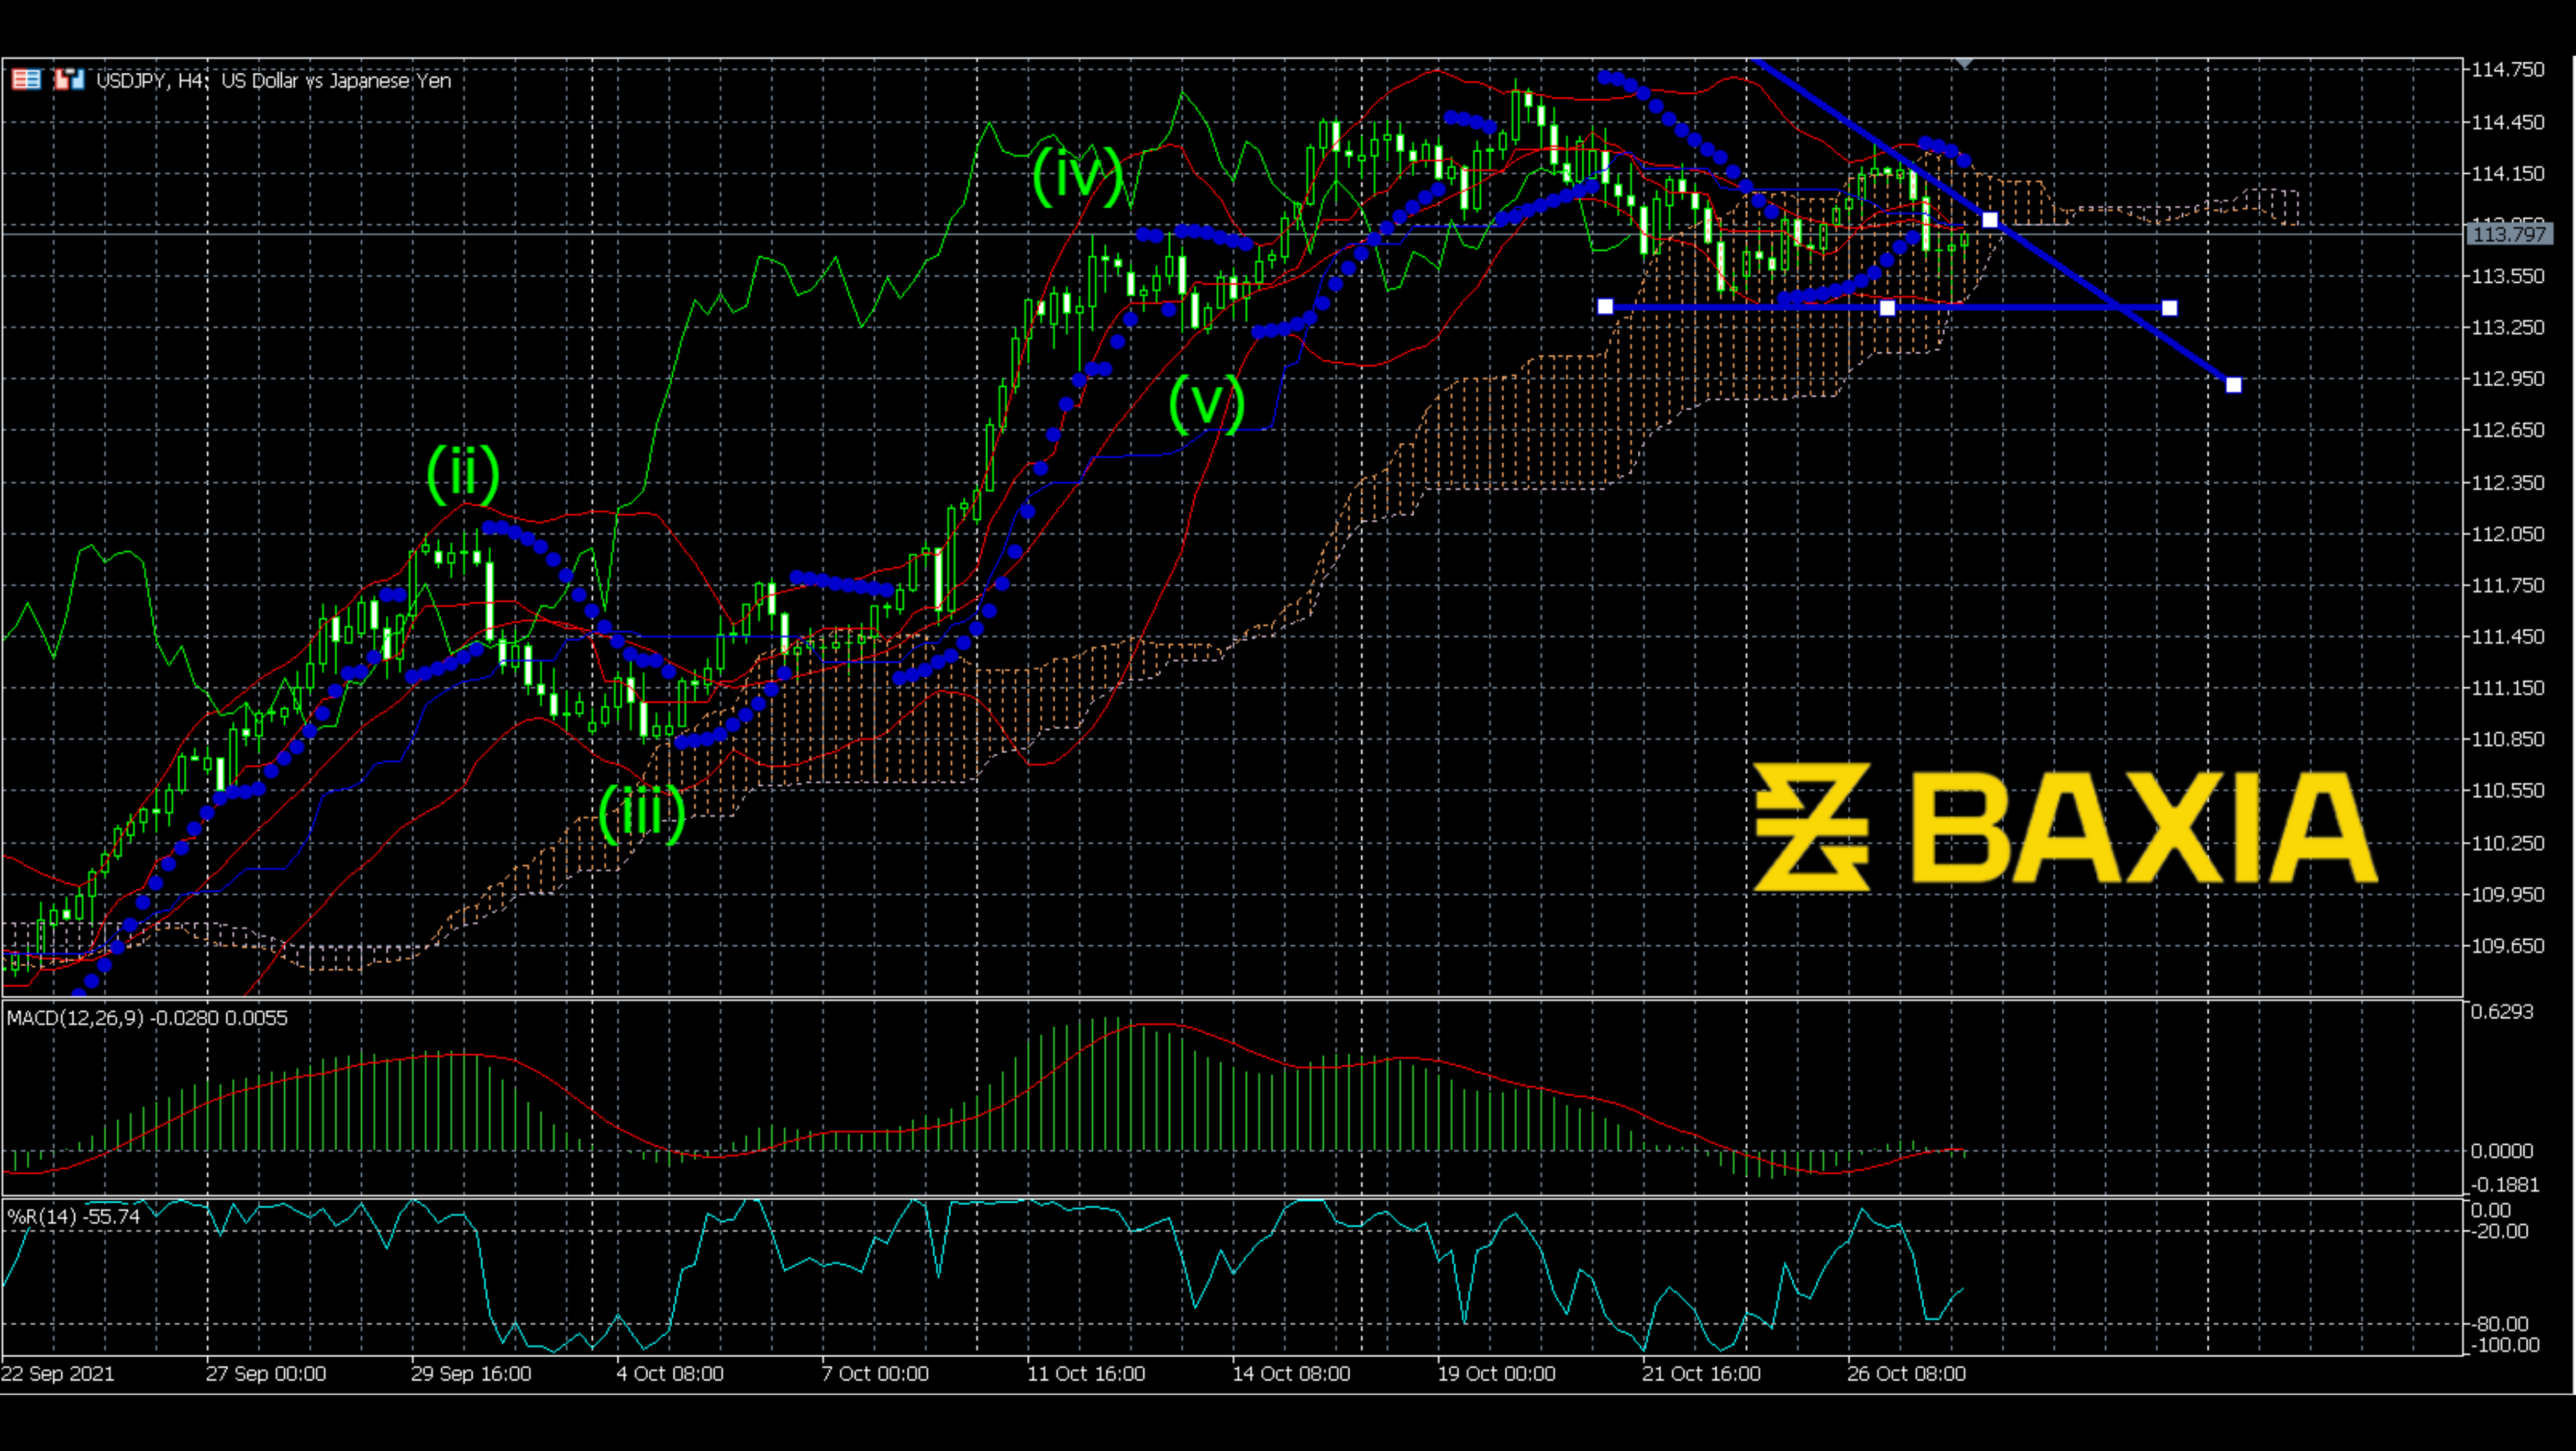

The price built an ascending triangle that started Sep 29. The triangle lasted two weeks and ended on Oct 13. The price broke up as we expected for the ascending triangle. The price moved in a steep slope after breakout; this slope was consistent and lasted eight days, which was a long and stable trend. However, recently, the price seemed to meet resistance.
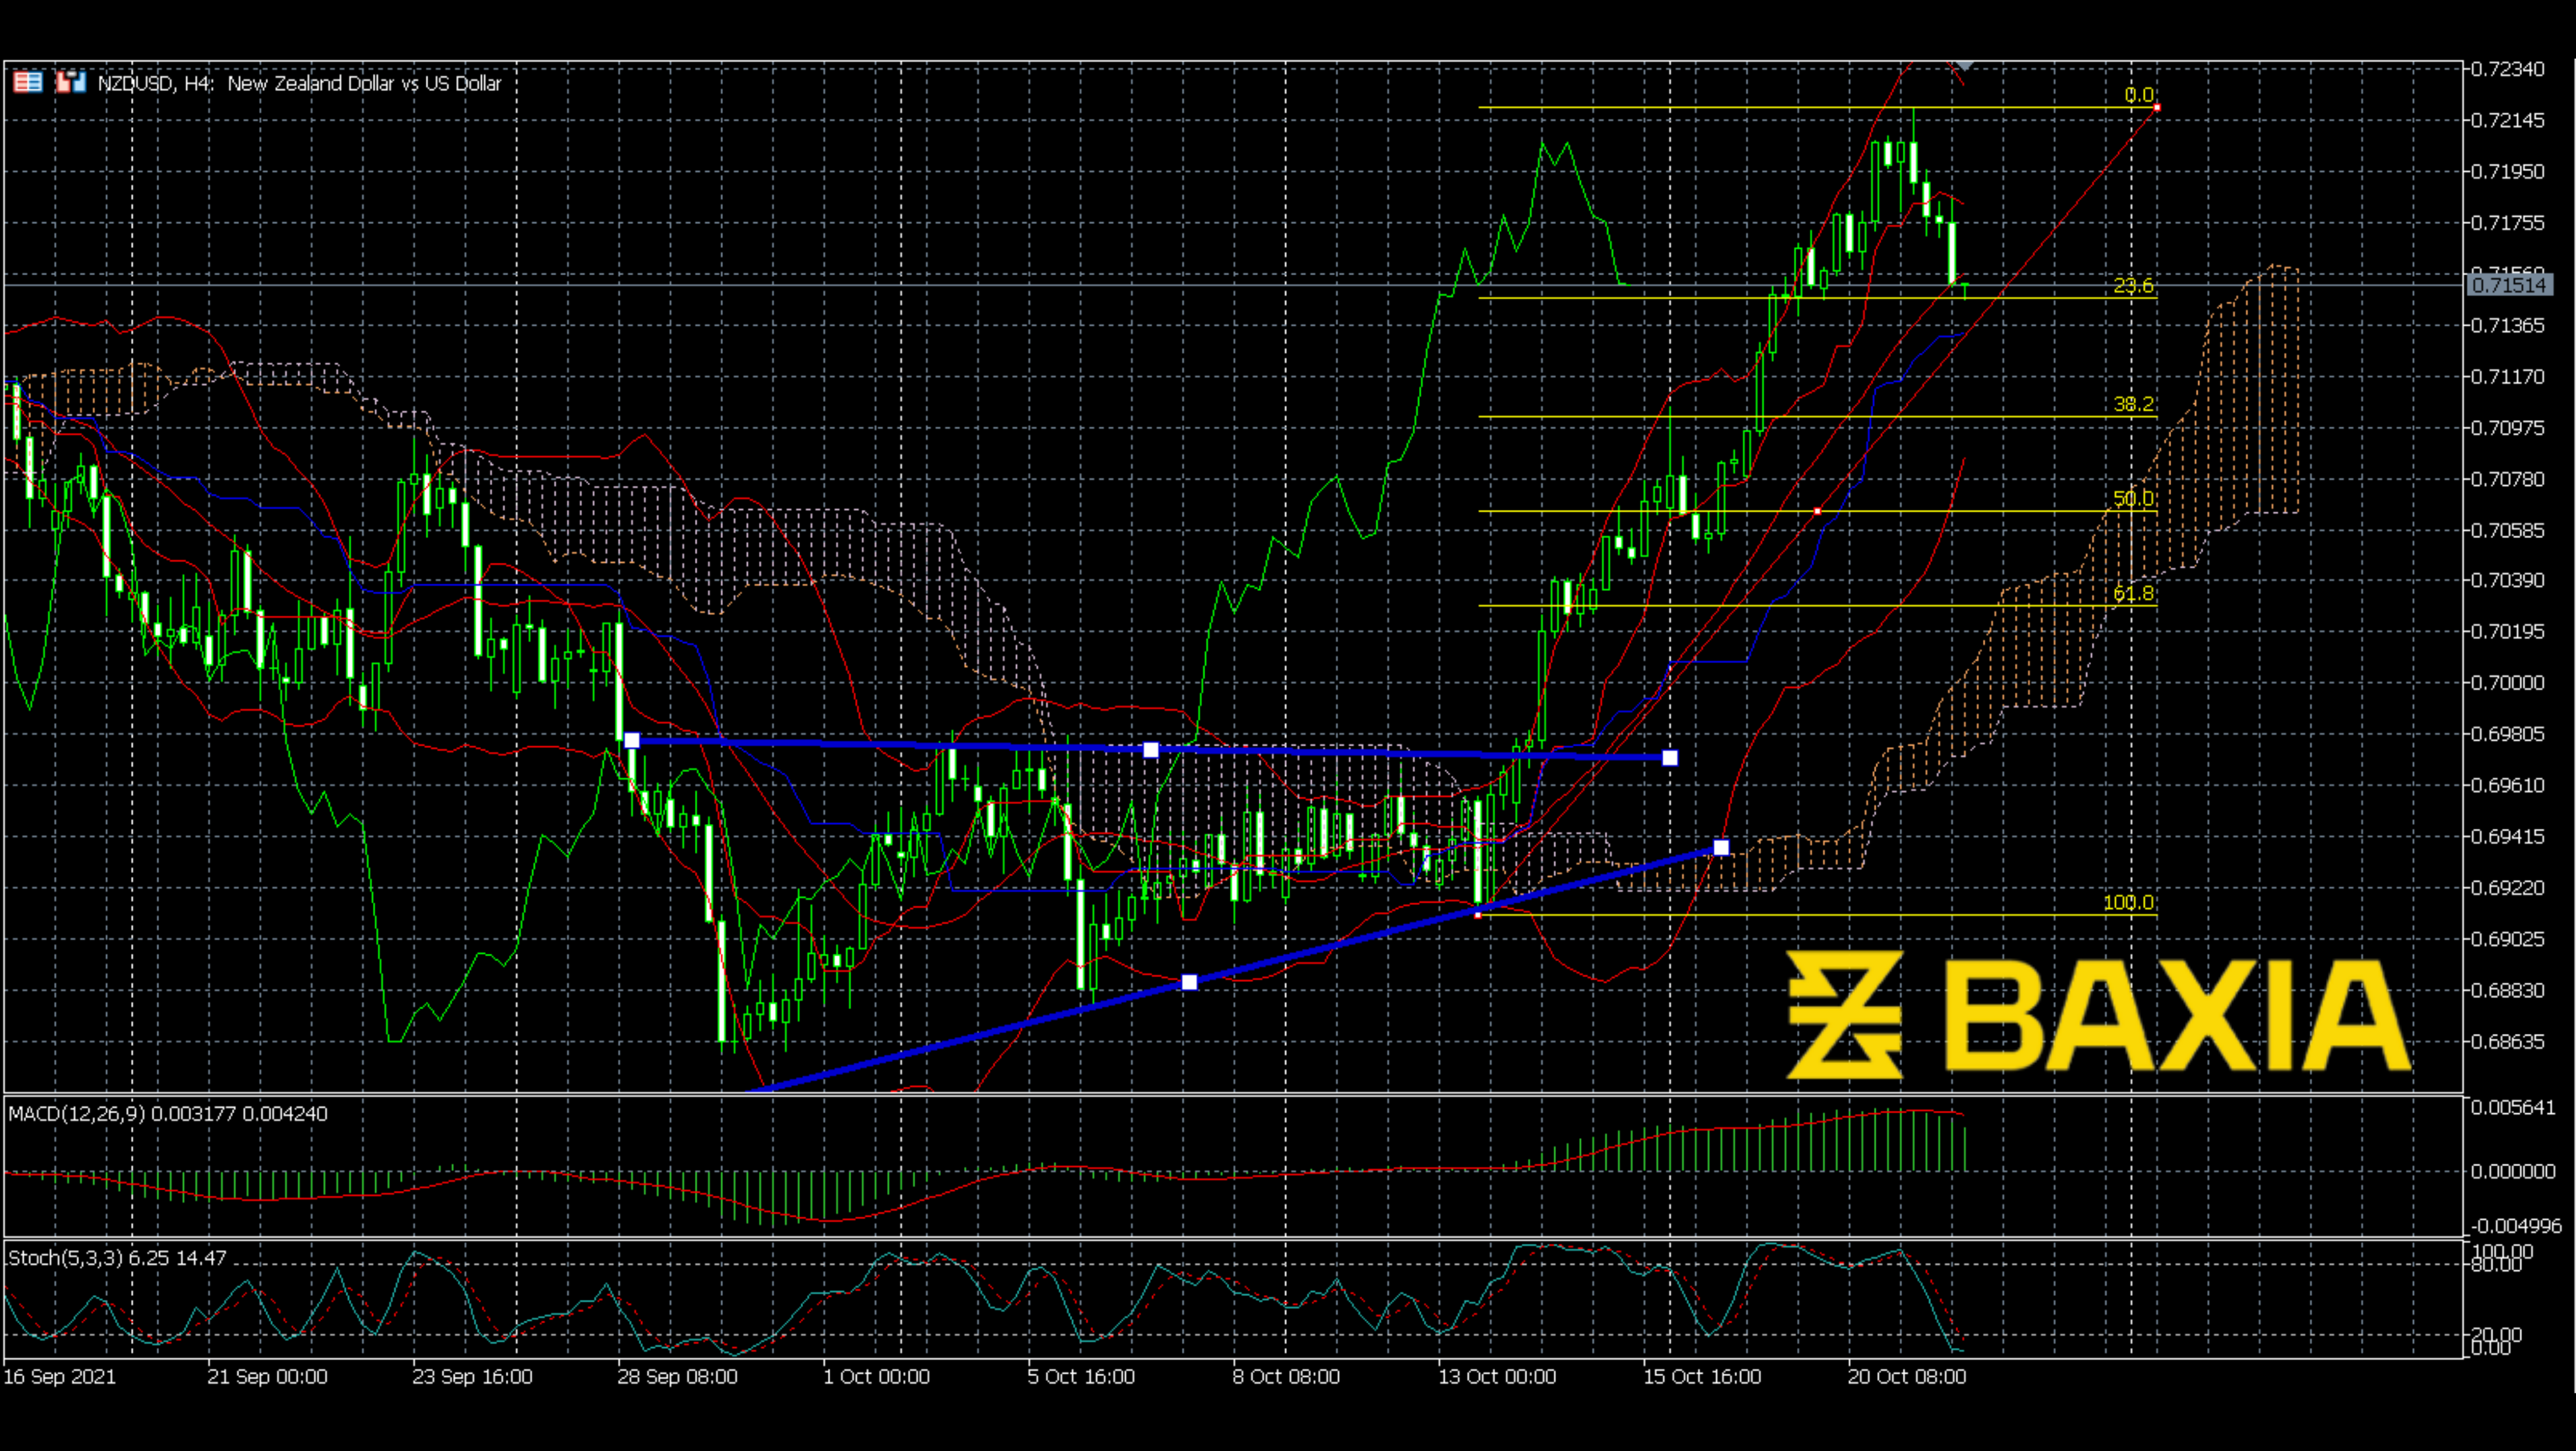
The price already turned down, which means the resistance power already showed up. Also, as can be seen, the Bollinger Bands turned down. MACD just made a bearish cross recently; I believe this trend can last for a while. Although Stochastics showed oversold, the situation could last. The oversold condition could last for a while. Now, the price has already touched the 23.6% level Fibonacci. Let’s wait to see if the price breaks this level.
We love to hear new ideas from traders and want to know what you think!
If you like this topic and want to suggest future topics that you find helpful, let us know by clicking the ‘submit your feedback’ button below.

Trading foreign exchange on margin carries a high level of risk, and may not be suitable for all investors. Before deciding to trade foreign exchange you should carefully consider your investment objectives, level of experience, and risk appetite.
Nothing contained in this website should be construed as investment advice. Any reference to an investment's past or potential performance is not, and should not be construed as, a recommendation or as a guarantee of any specific outcome or profit.