
As can be seen, the price of AUDUSD ended up at around 0.749; this trend has lasted for five days, which was a long sharp trend. The angle was steep, and the price went down about 3.9% in five days, and soon met support. From the Fibonacci retracement, we can see that the price now meets the 38.2% level, which could be a resistance point. So, will the price keep going up?
The Bollinger Bands have shrunk, meaning the breakout has already started. The price broke the upper Bollinger Band; and upward pressure is intense. Also, the new SAR trend is upward; the support point is working very well.
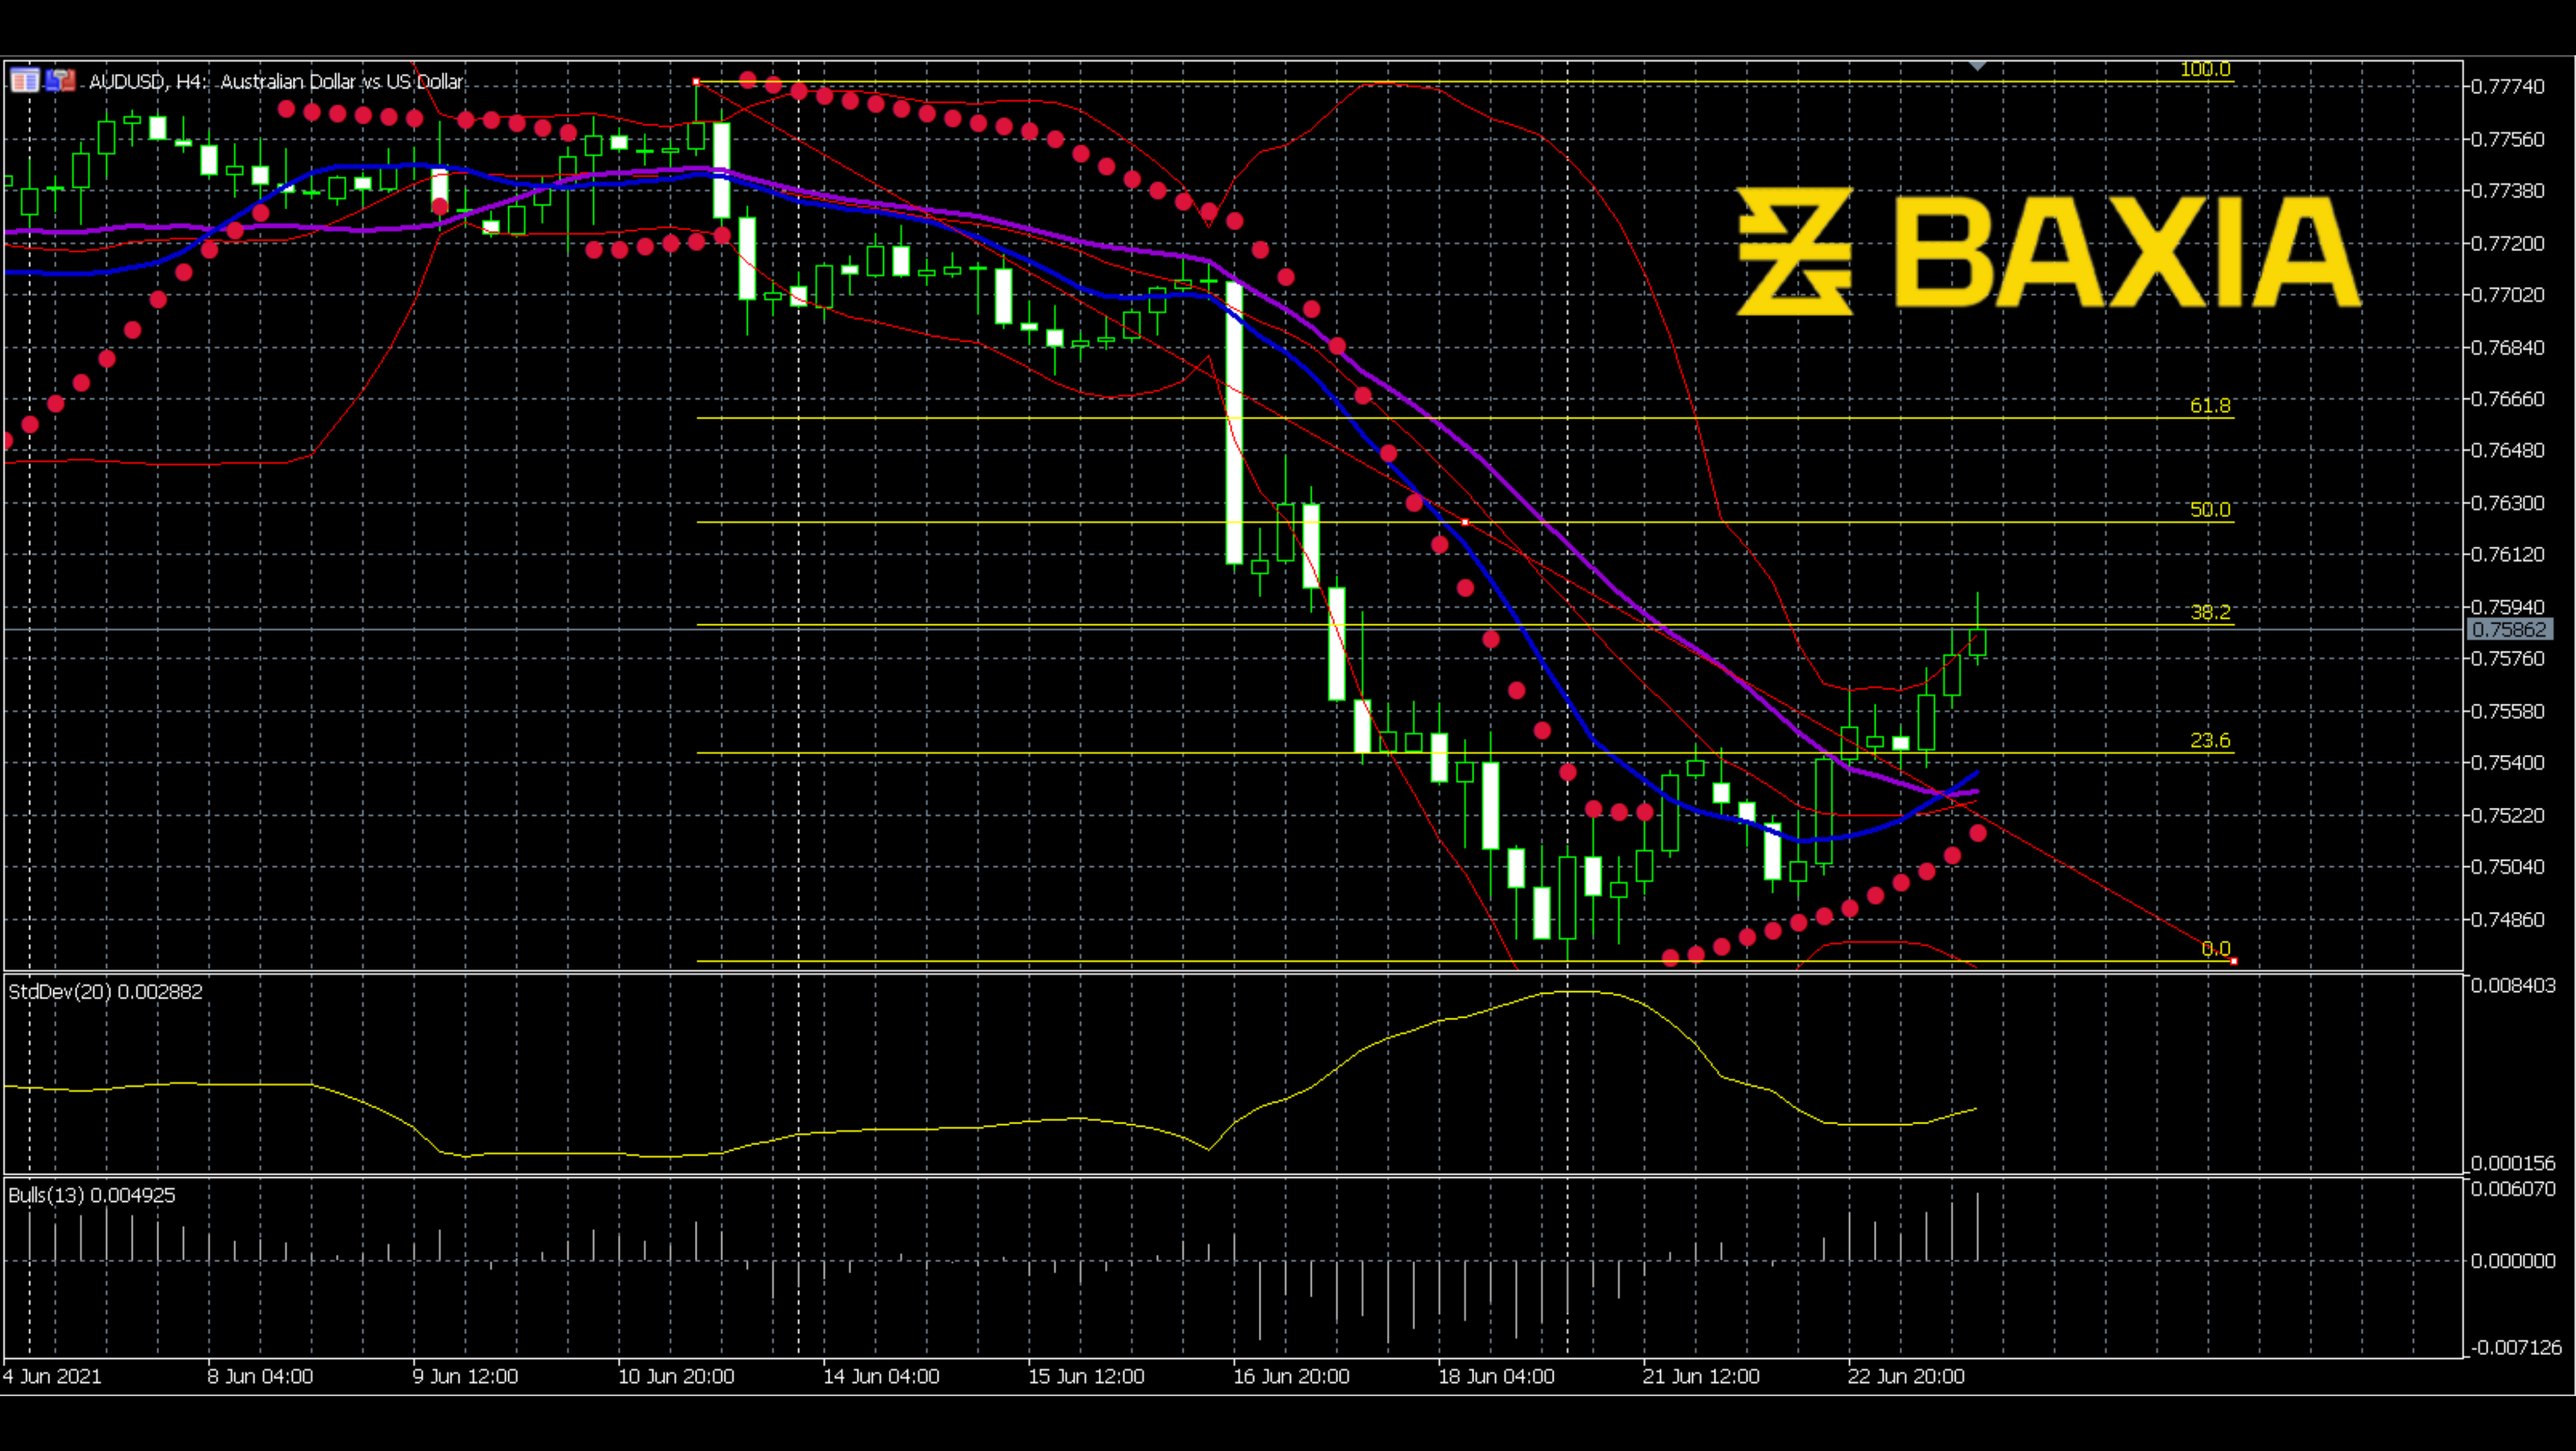
Now let’s check the moving average line. The purple line is th 25MA, the blue line is 15MA; the blue line has a shorter period than the purple line. Now, the blue line exceeds the purple line, indicating a bullish signal.
The standard deviation is going up, which indicates that the fluctuation has not ended yet. The bull power is going up too. As for now, we have enough bullish signals. Could the price meet the 61.8% level Fibonacci soon?
We love to hear new ideas from traders and want to know what you think!
If you like this topic and want to suggest future topics that you find helpful, let us know by clicking the ‘submit your feedback’ button below.

Trading foreign exchange on margin carries a high level of risk, and may not be suitable for all investors. Before deciding to trade foreign exchange you should carefully consider your investment objectives, level of experience, and risk appetite.
Nothing contained in this website should be construed as investment advice. Any reference to an investment's past or potential performance is not, and should not be construed as, a recommendation or as a guarantee of any specific outcome or profit.