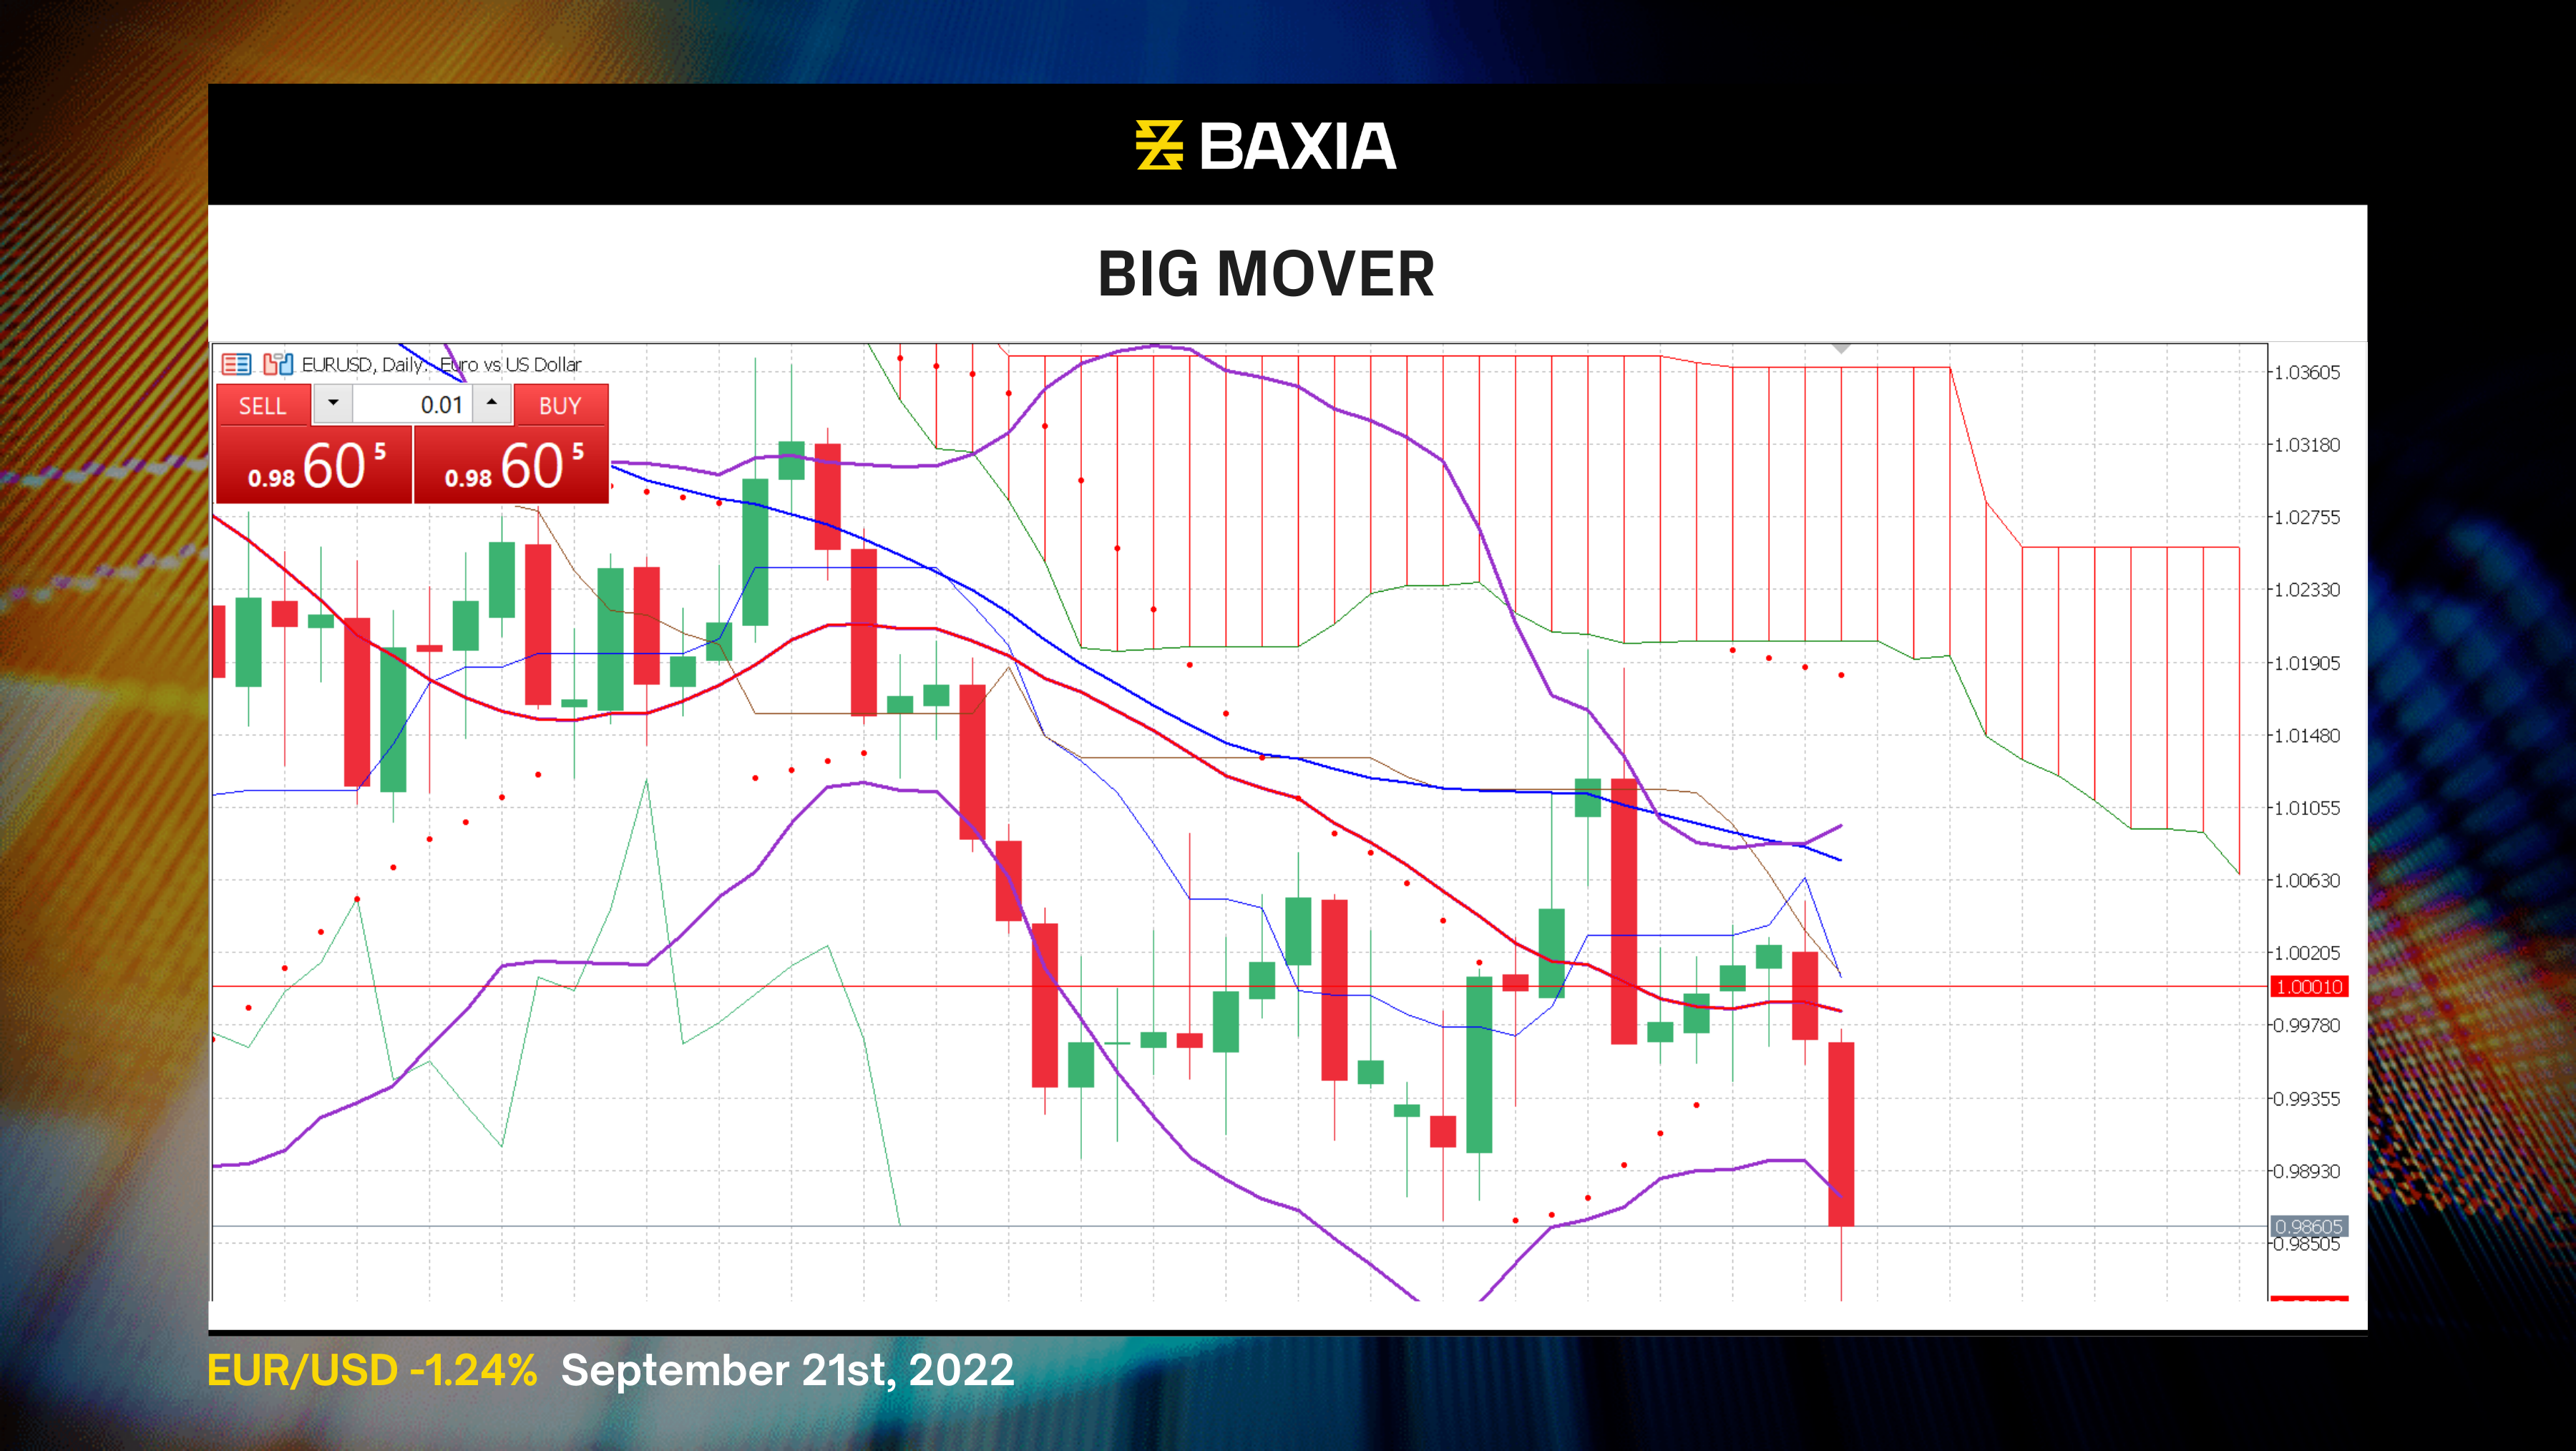

The price had been rising since Aug 19th, which was also the end of the previous downward trend. The price had been through a big wave. Recently, the price met resistance on Sep 3rd. After that the price made two sharp drops. So, is this a turning or just a retracement?
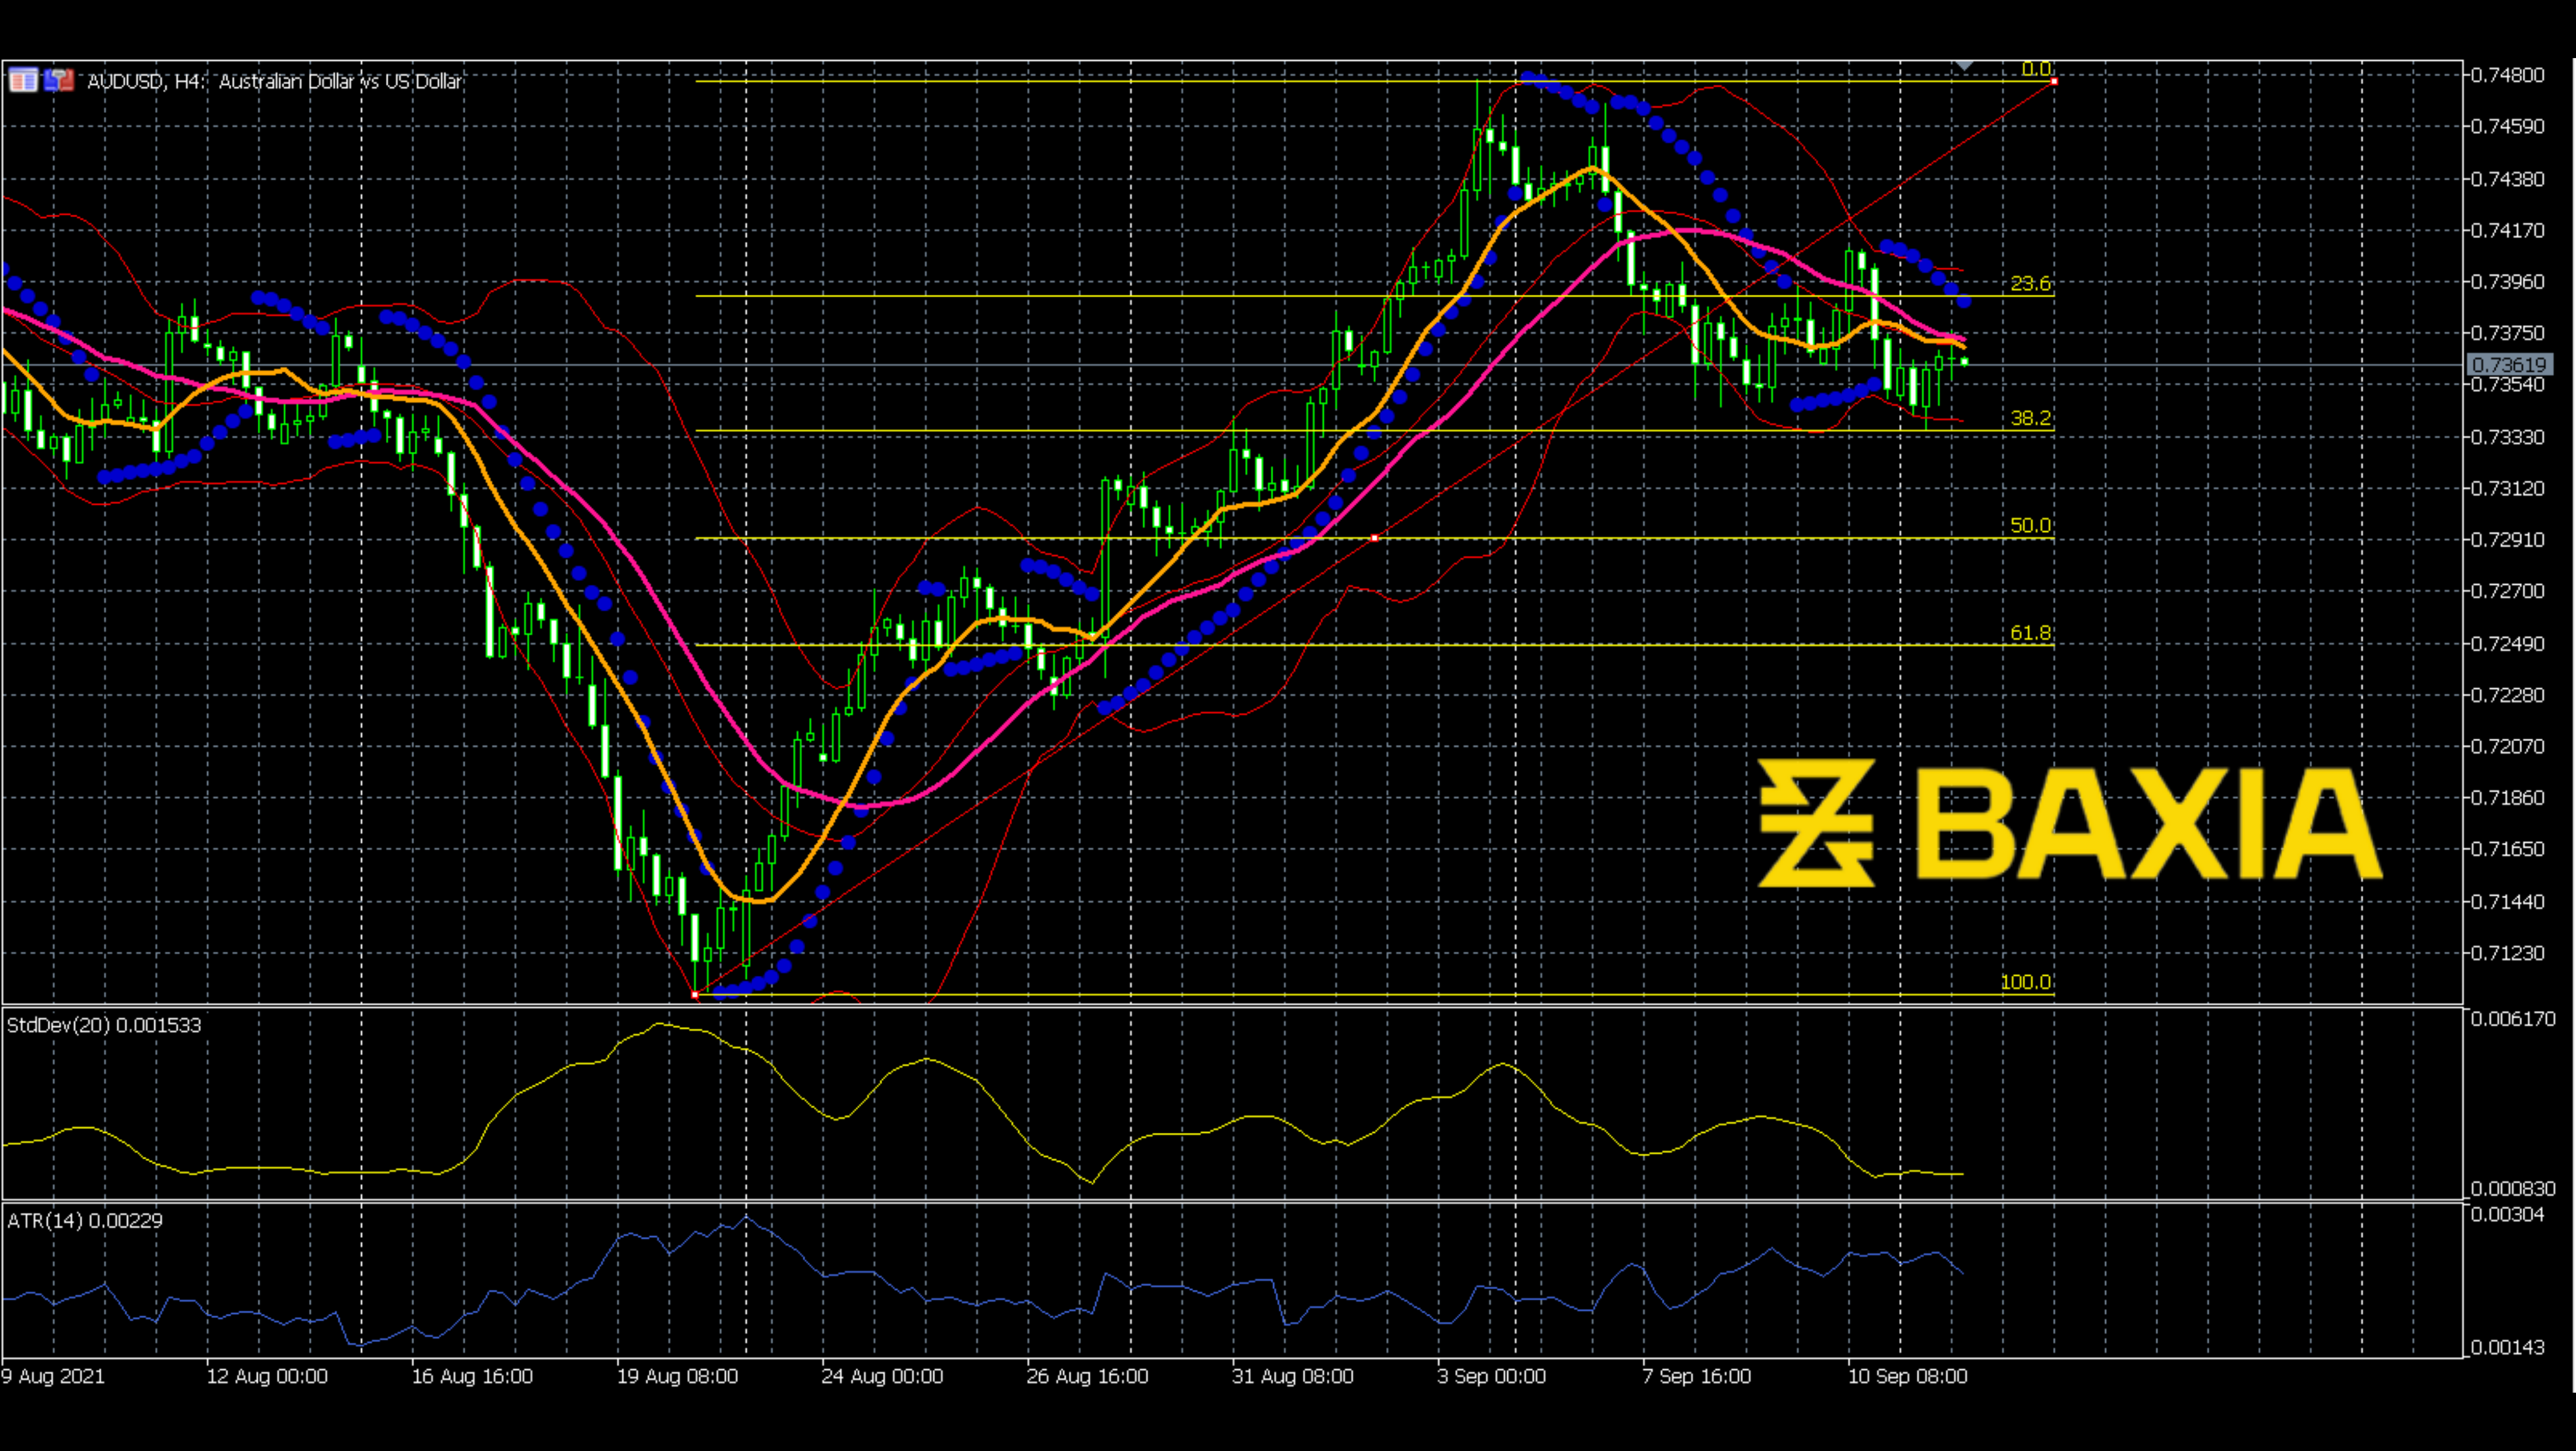
As can be seen, the price is now testing the 38.2% Fibonacci level. This position is very delicate and crucial. There is a subtle balance between bull and bear power; the price received support power here, but we cannot make sure if this is enough to turn the price up.
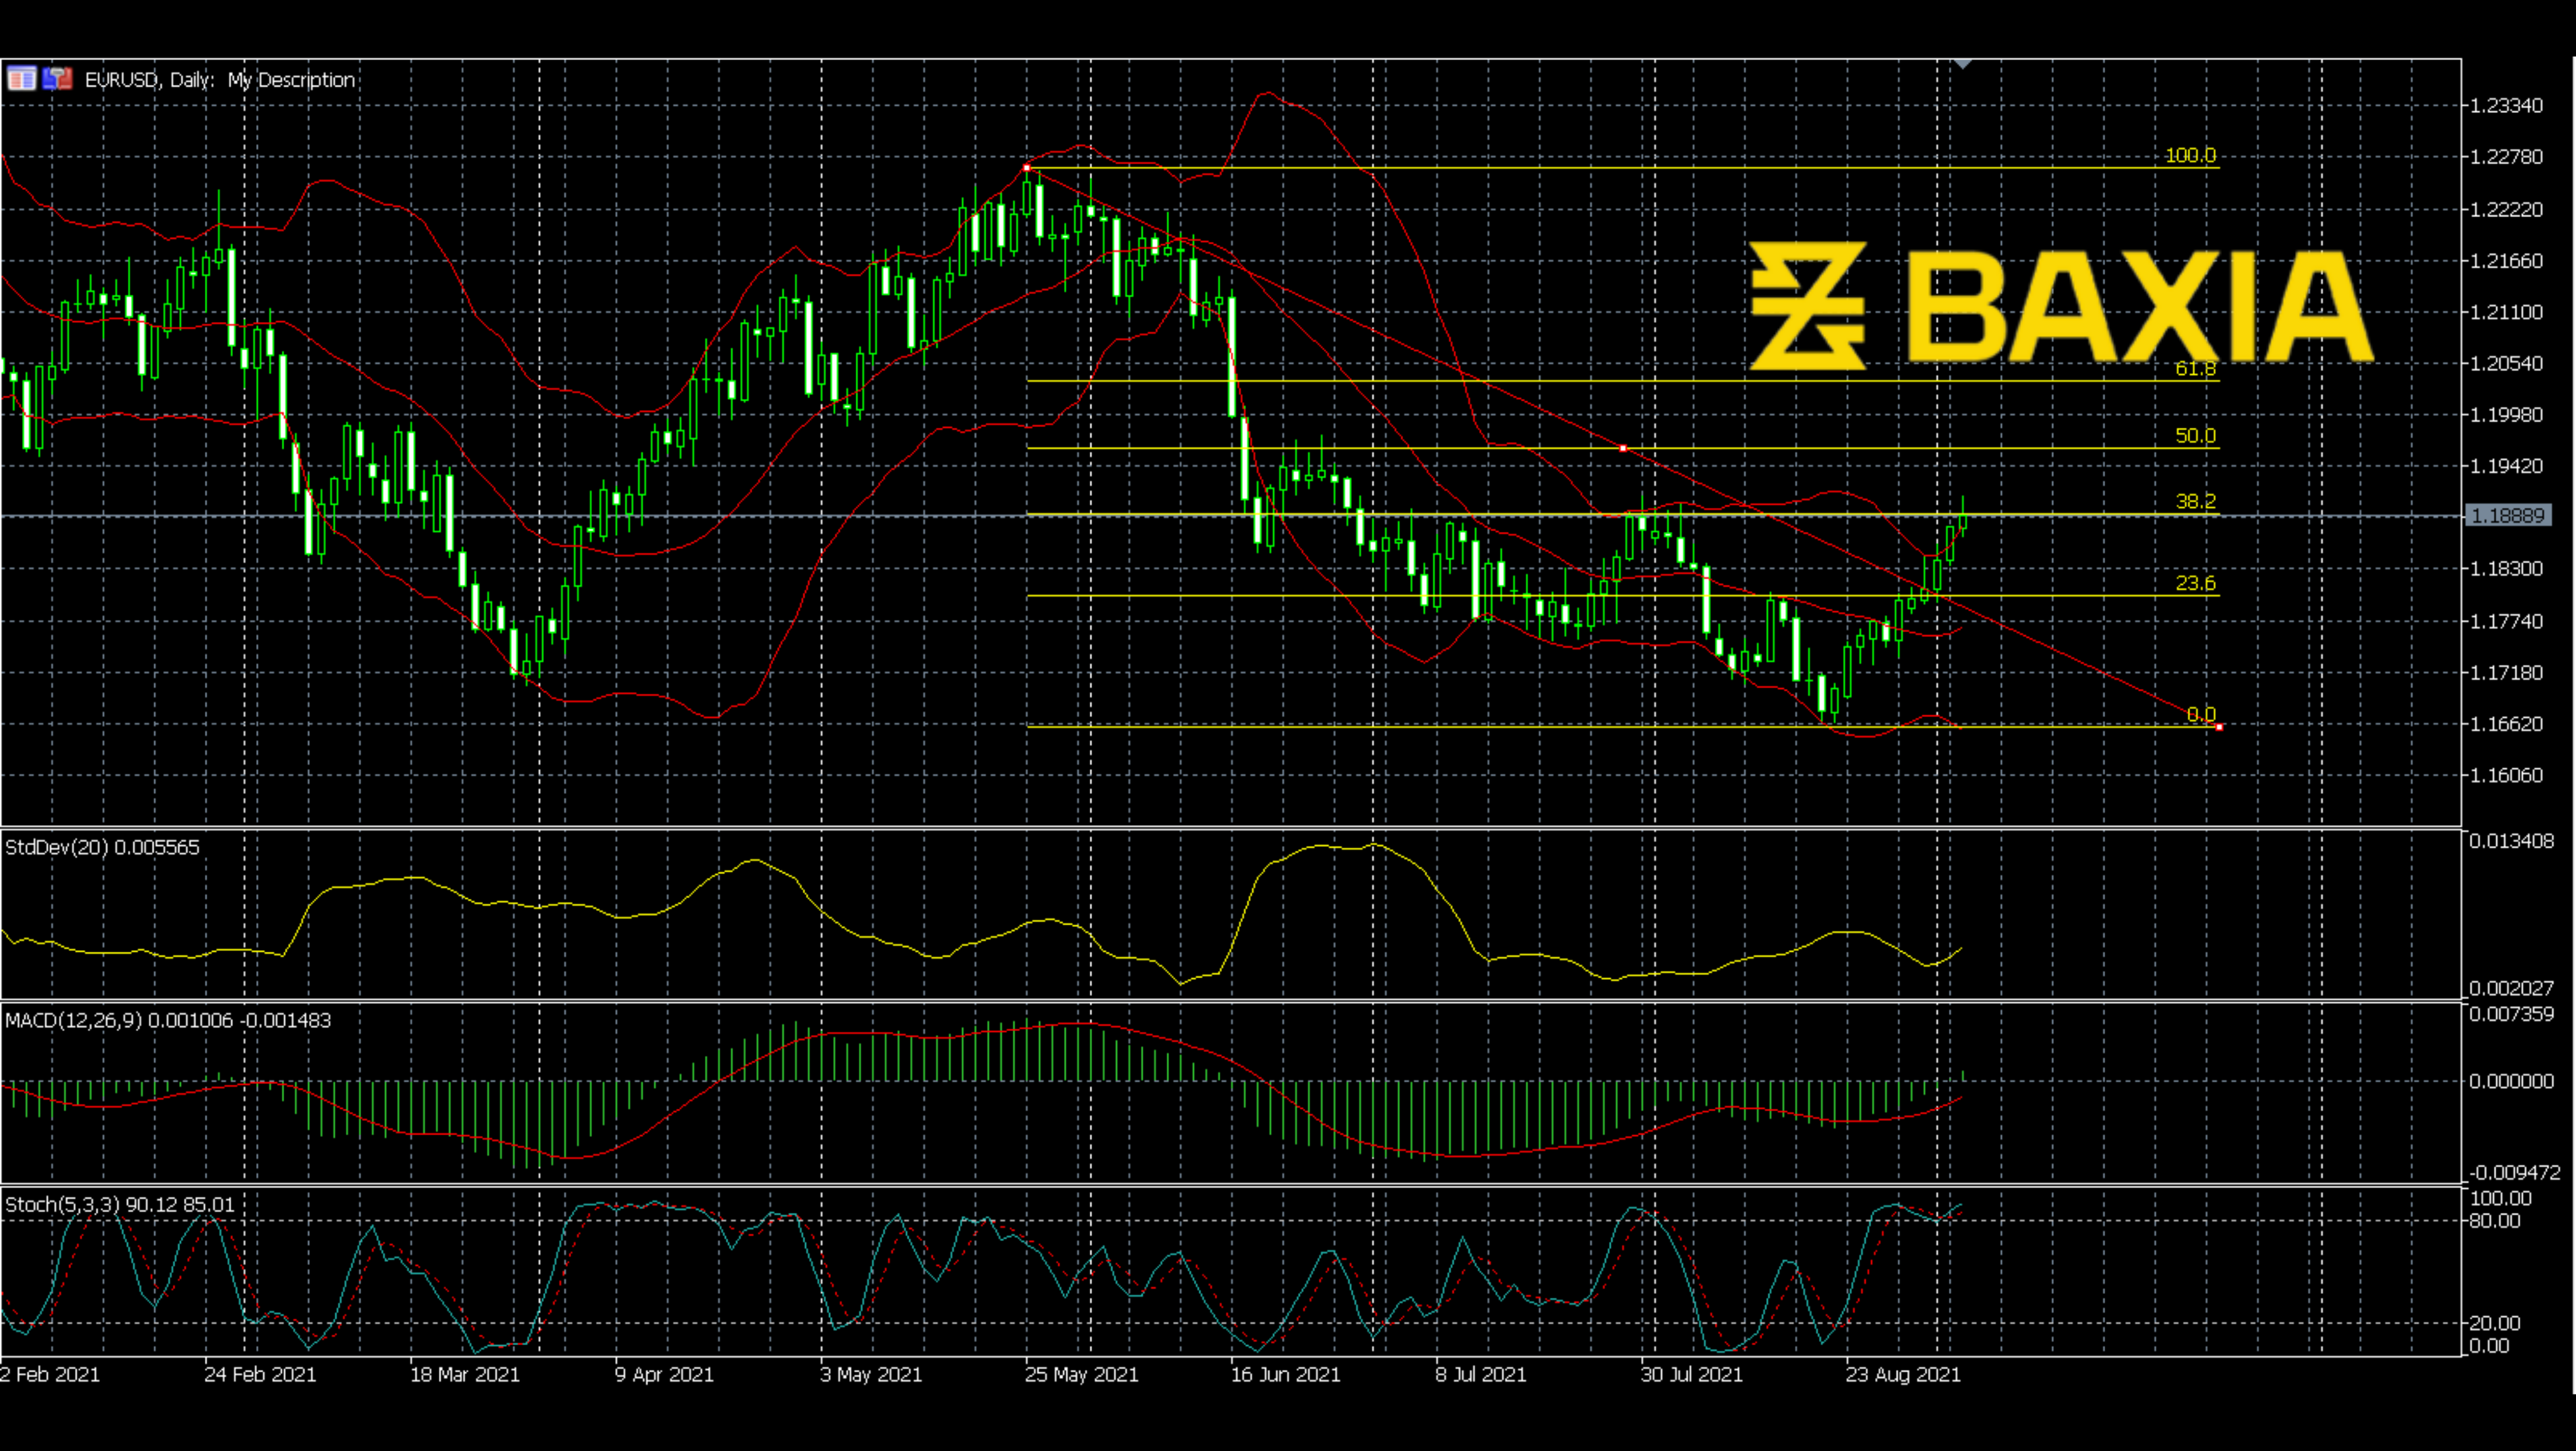
The Bollinger Bands shrunk, which is considered a breakout signal. Parabolic SAR is still making a downward trend. However, the 10 day moving average (orange line) is getting close to the 25 day moving average (pink line), which could be considered a bullish signal. Let’s keep our eyes on the price line.
We love to hear new ideas from traders and want to know what you think!
If you like this topic and want to suggest future topics that you find helpful, let us know by clicking the ‘submit your feedback’ button below.

Trading foreign exchange on margin carries a high level of risk, and may not be suitable for all investors. Before deciding to trade foreign exchange you should carefully consider your investment objectives, level of experience, and risk appetite.
Nothing contained in this website should be construed as investment advice. Any reference to an investment's past or potential performance is not, and should not be construed as, a recommendation or as a guarantee of any specific outcome or profit.