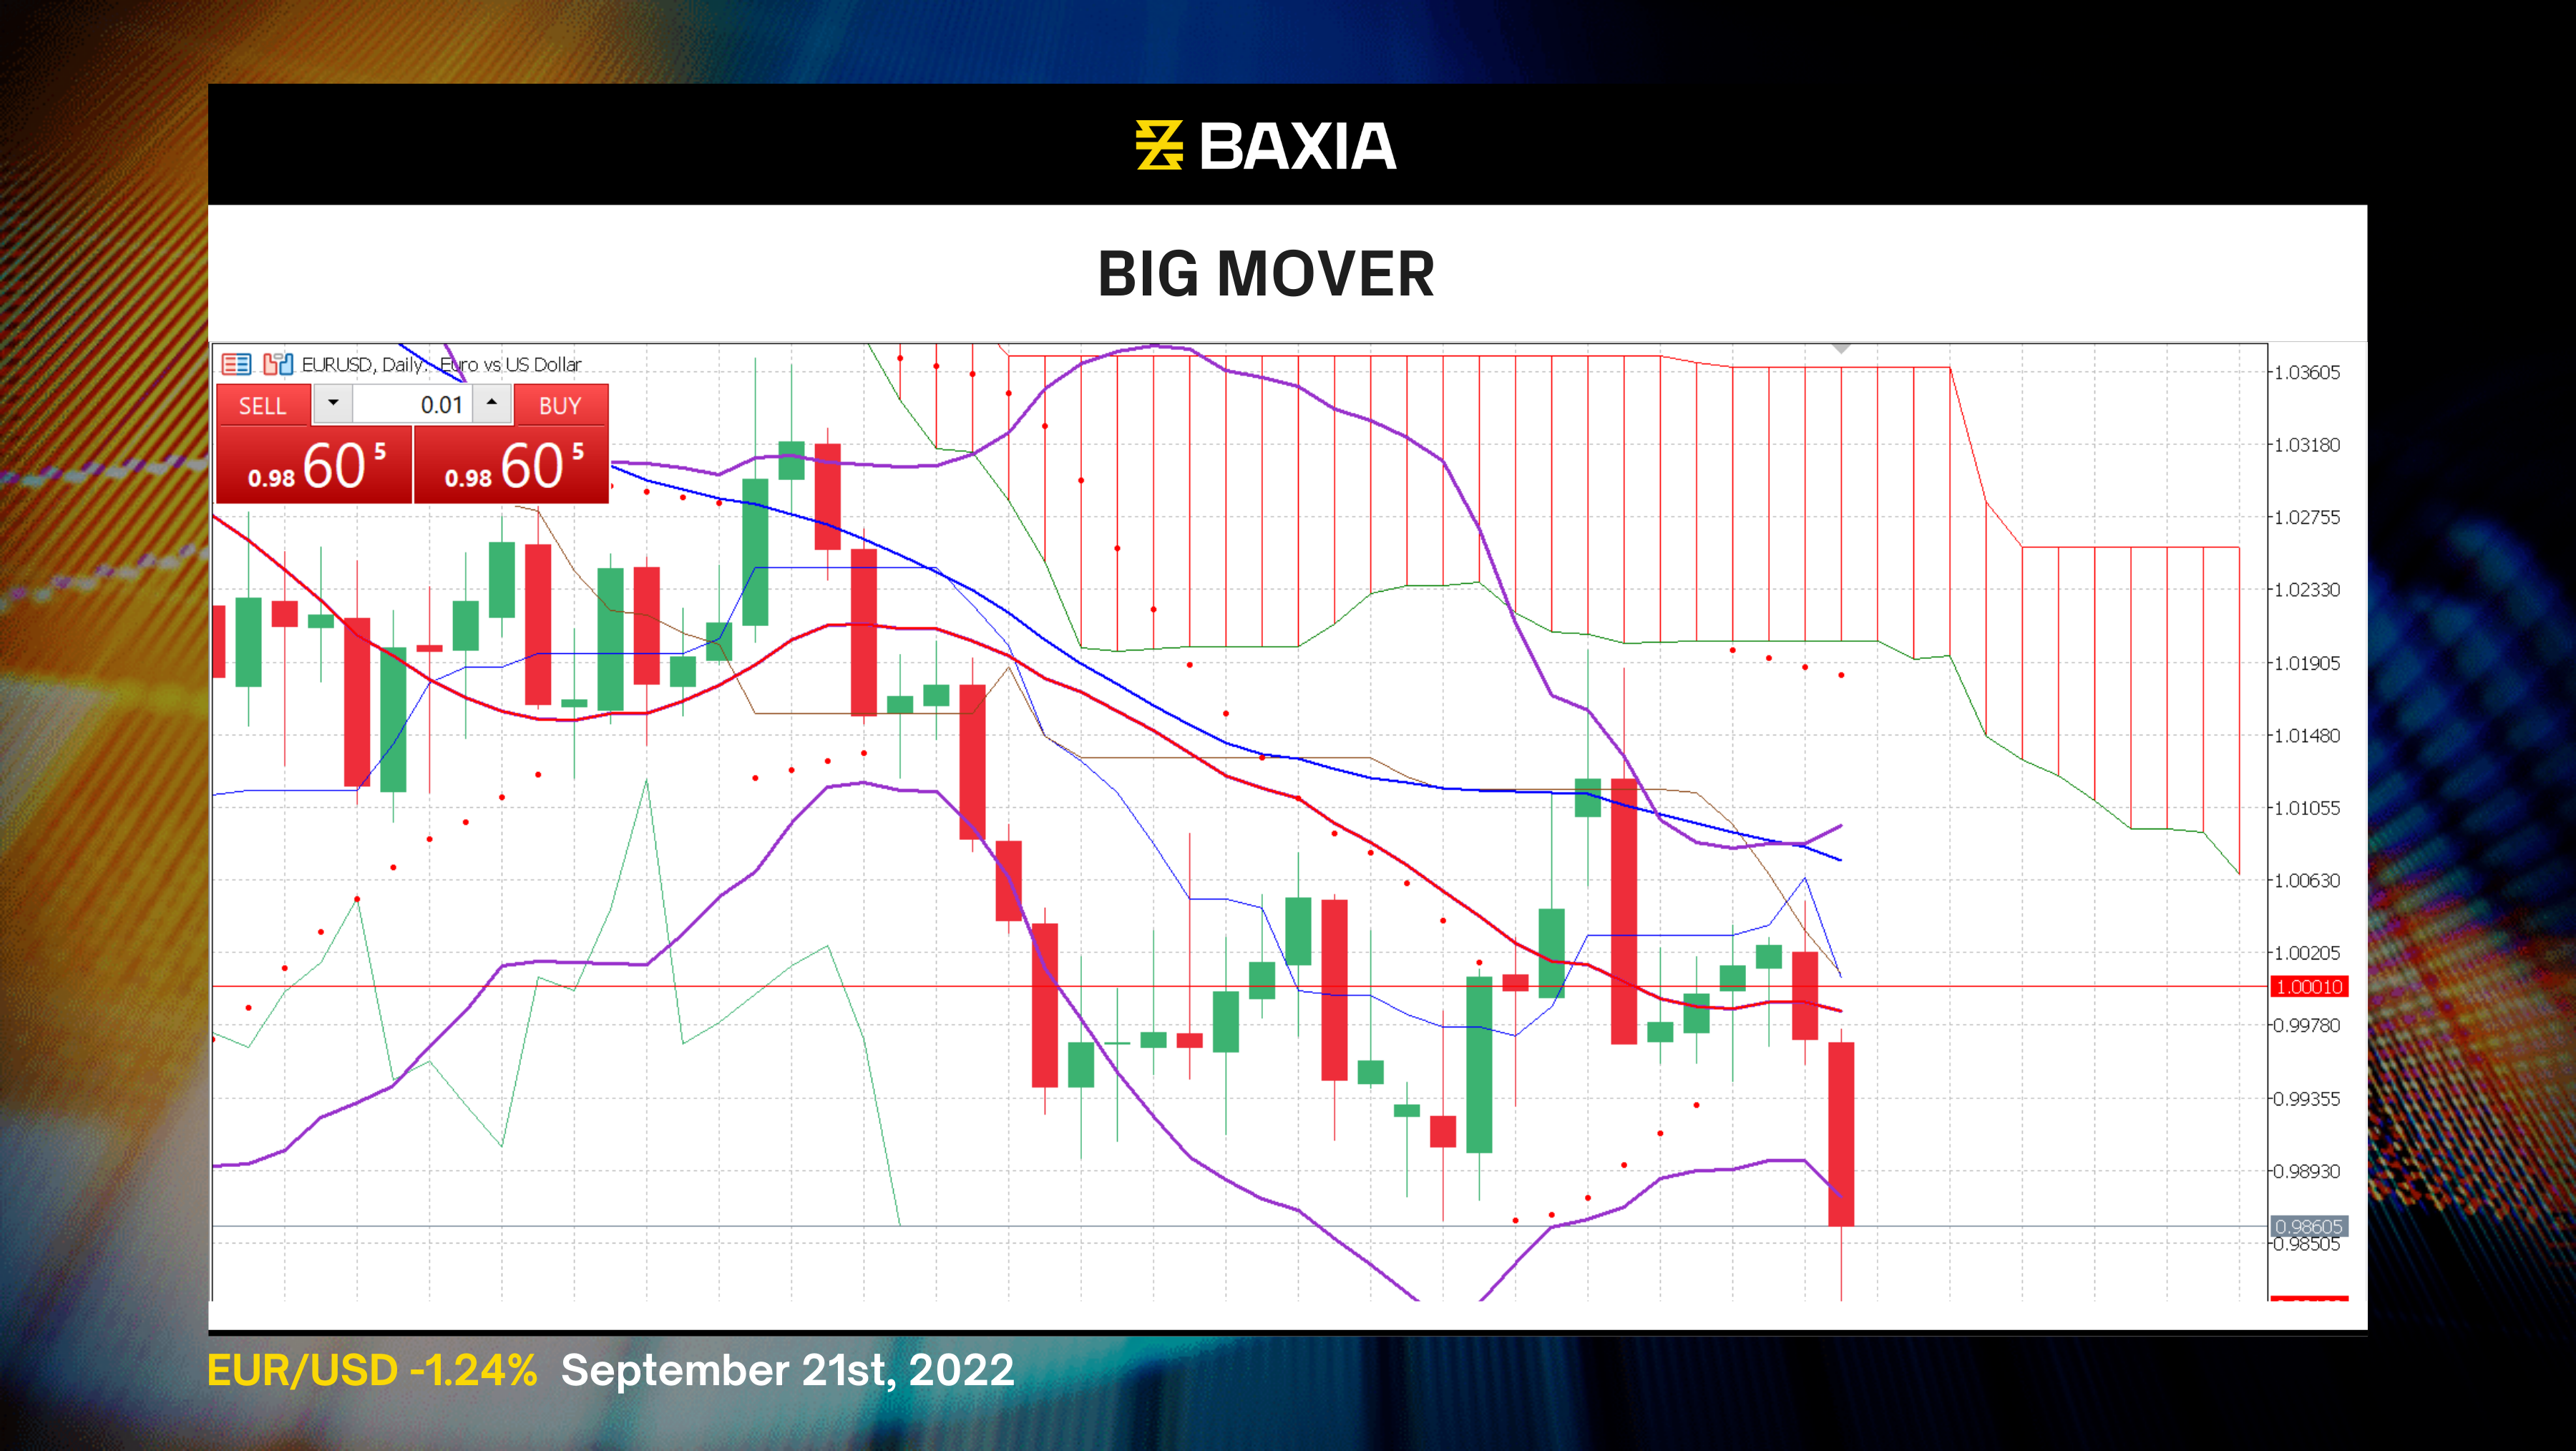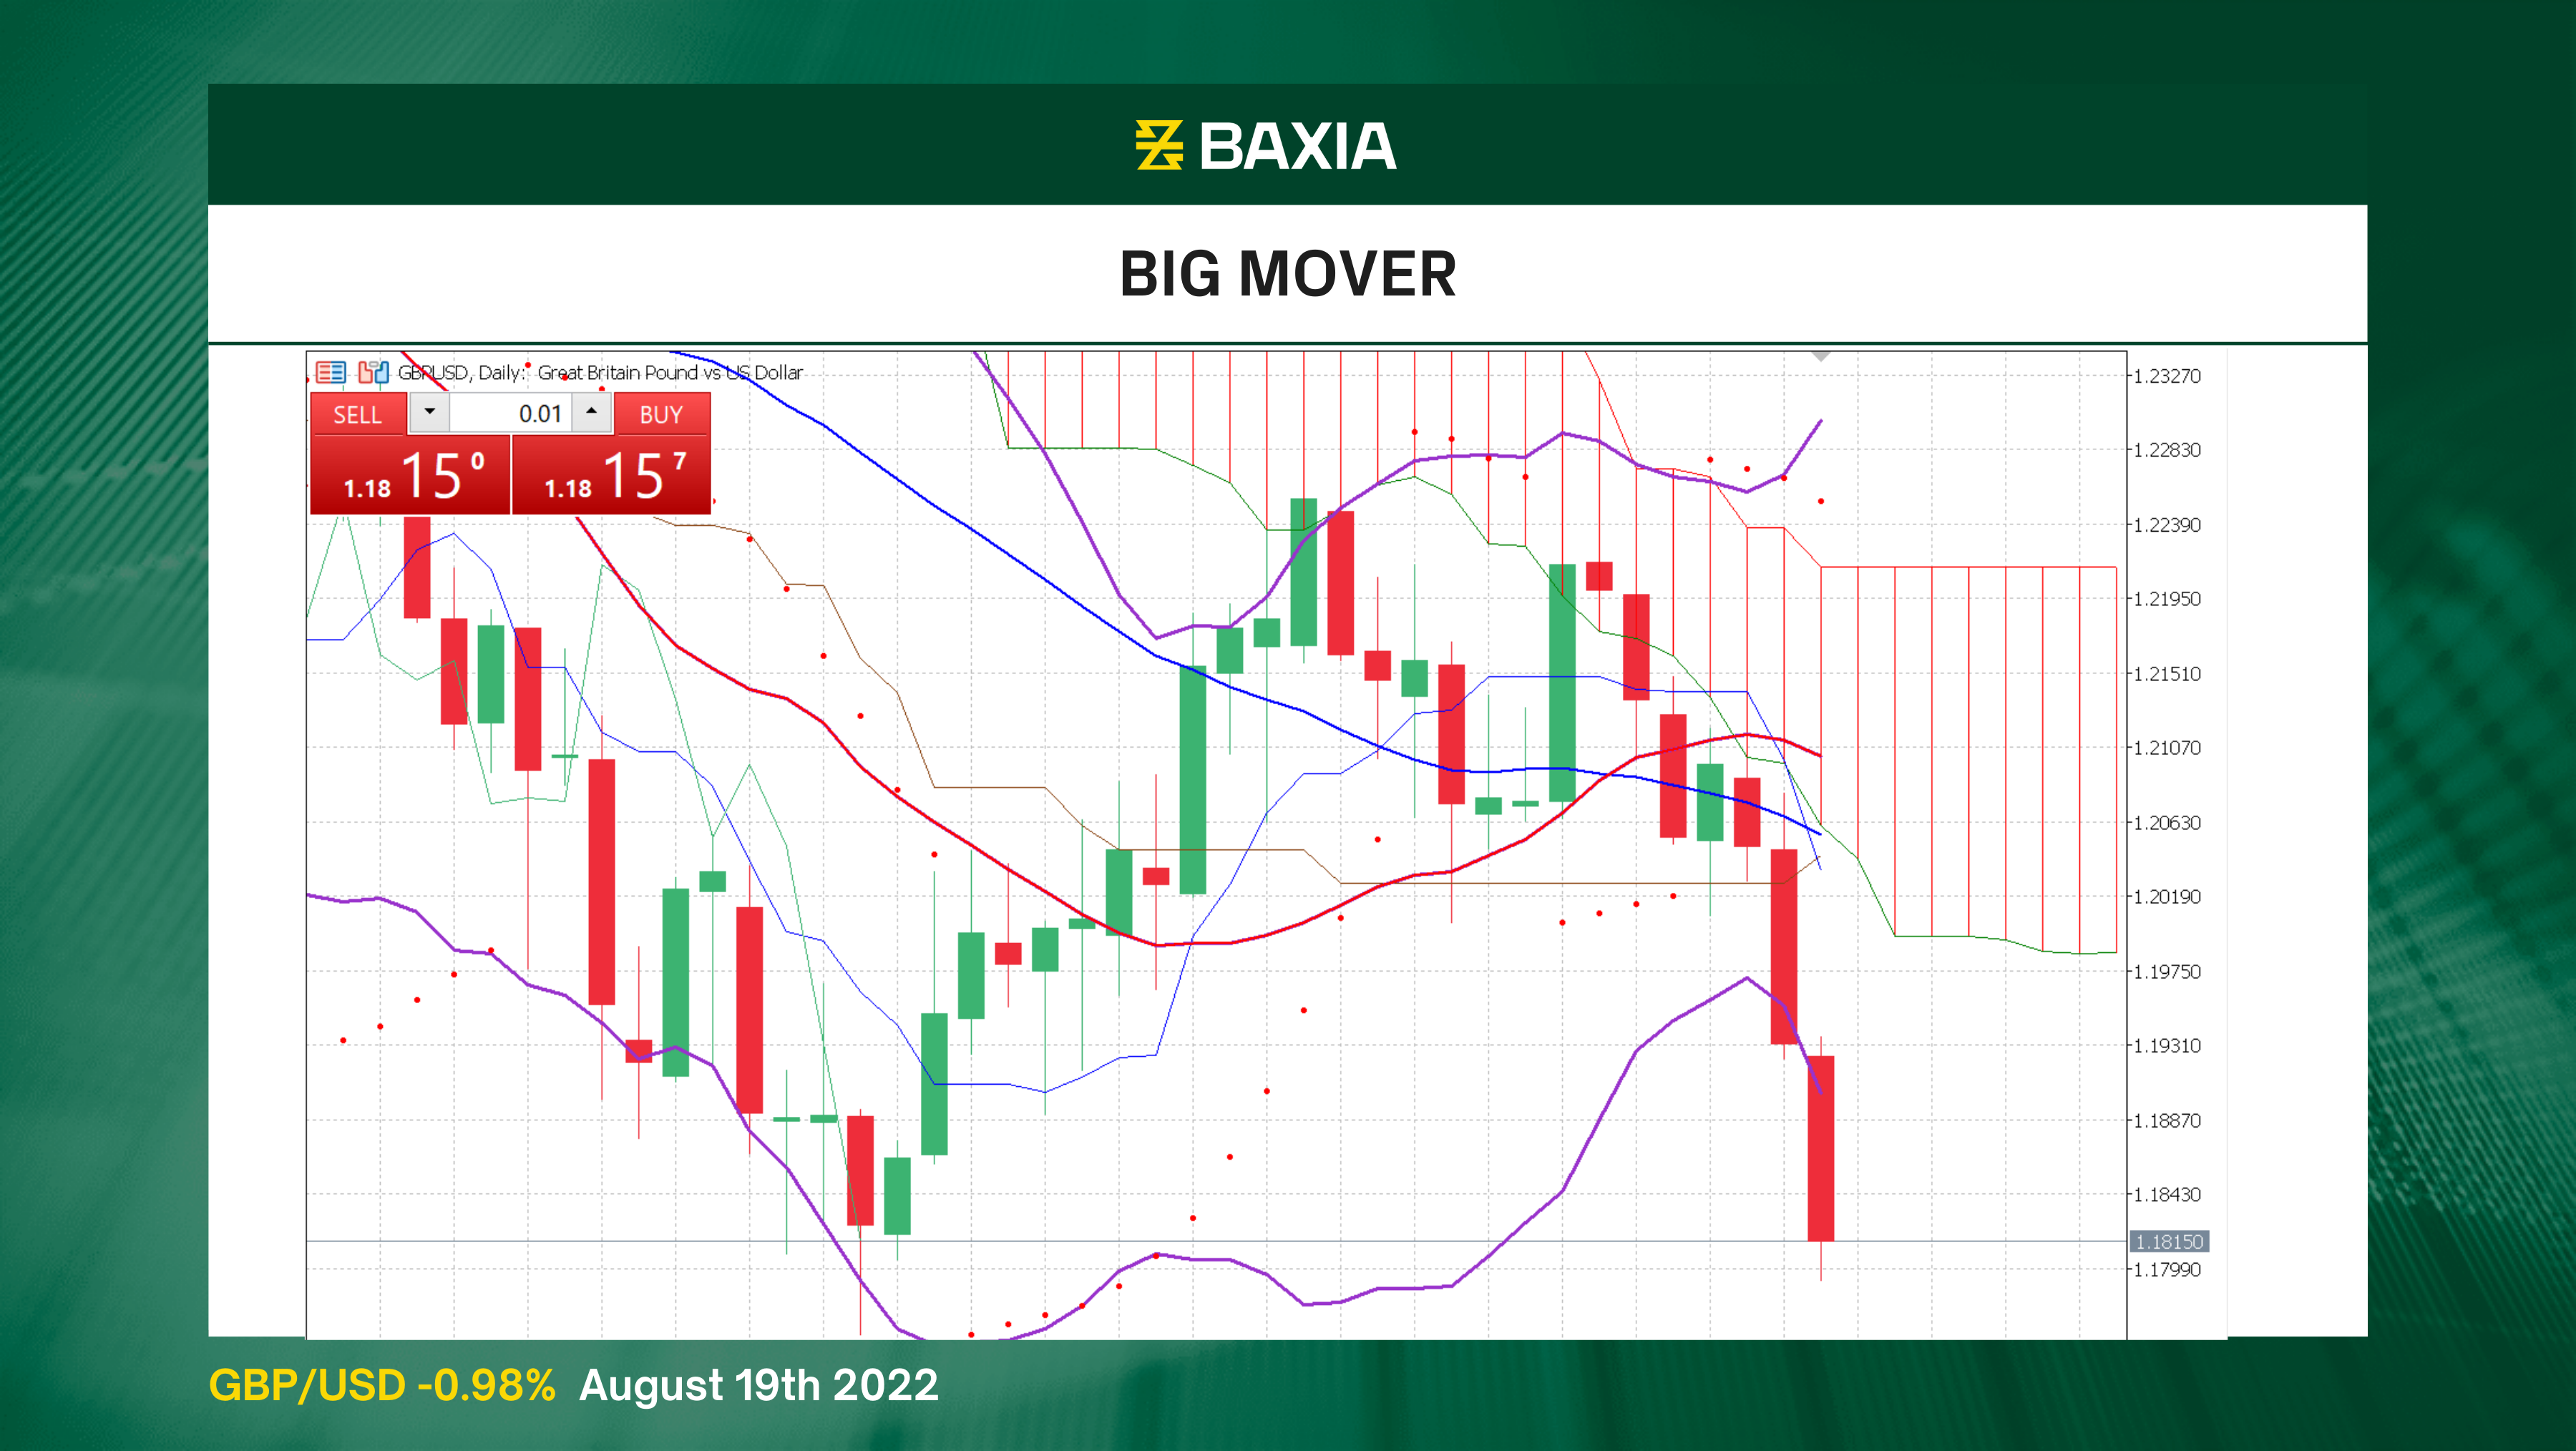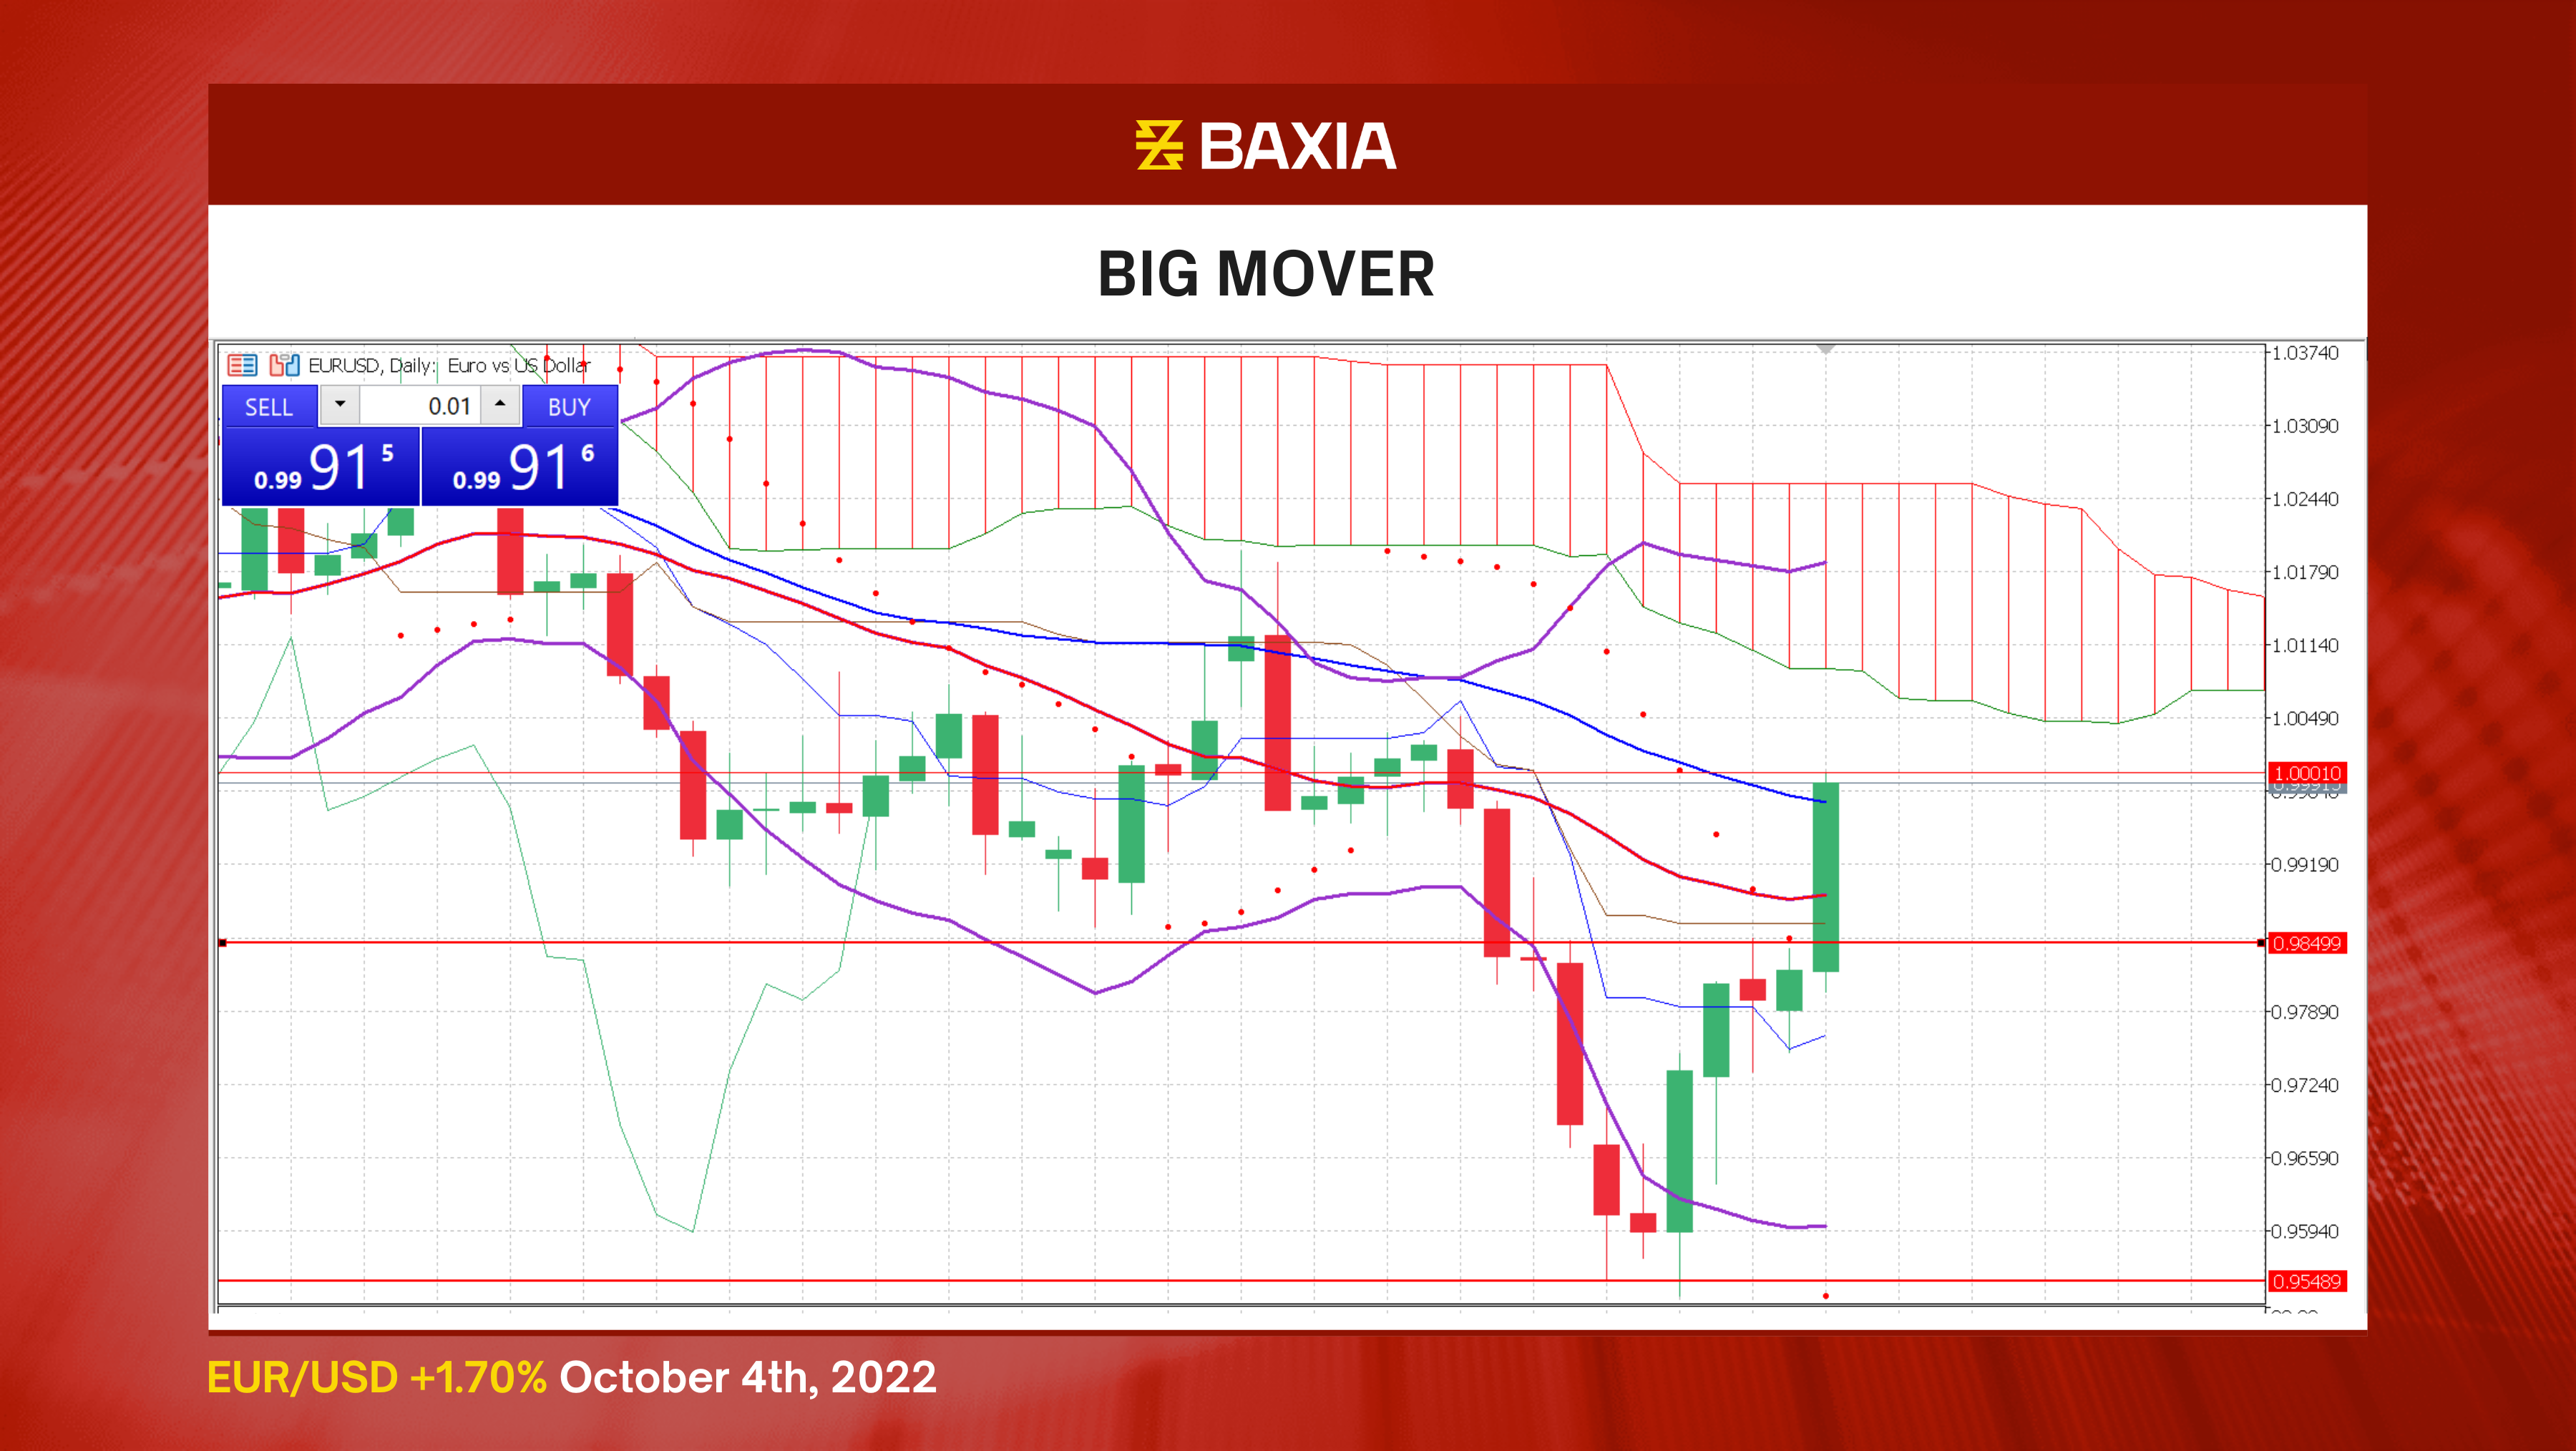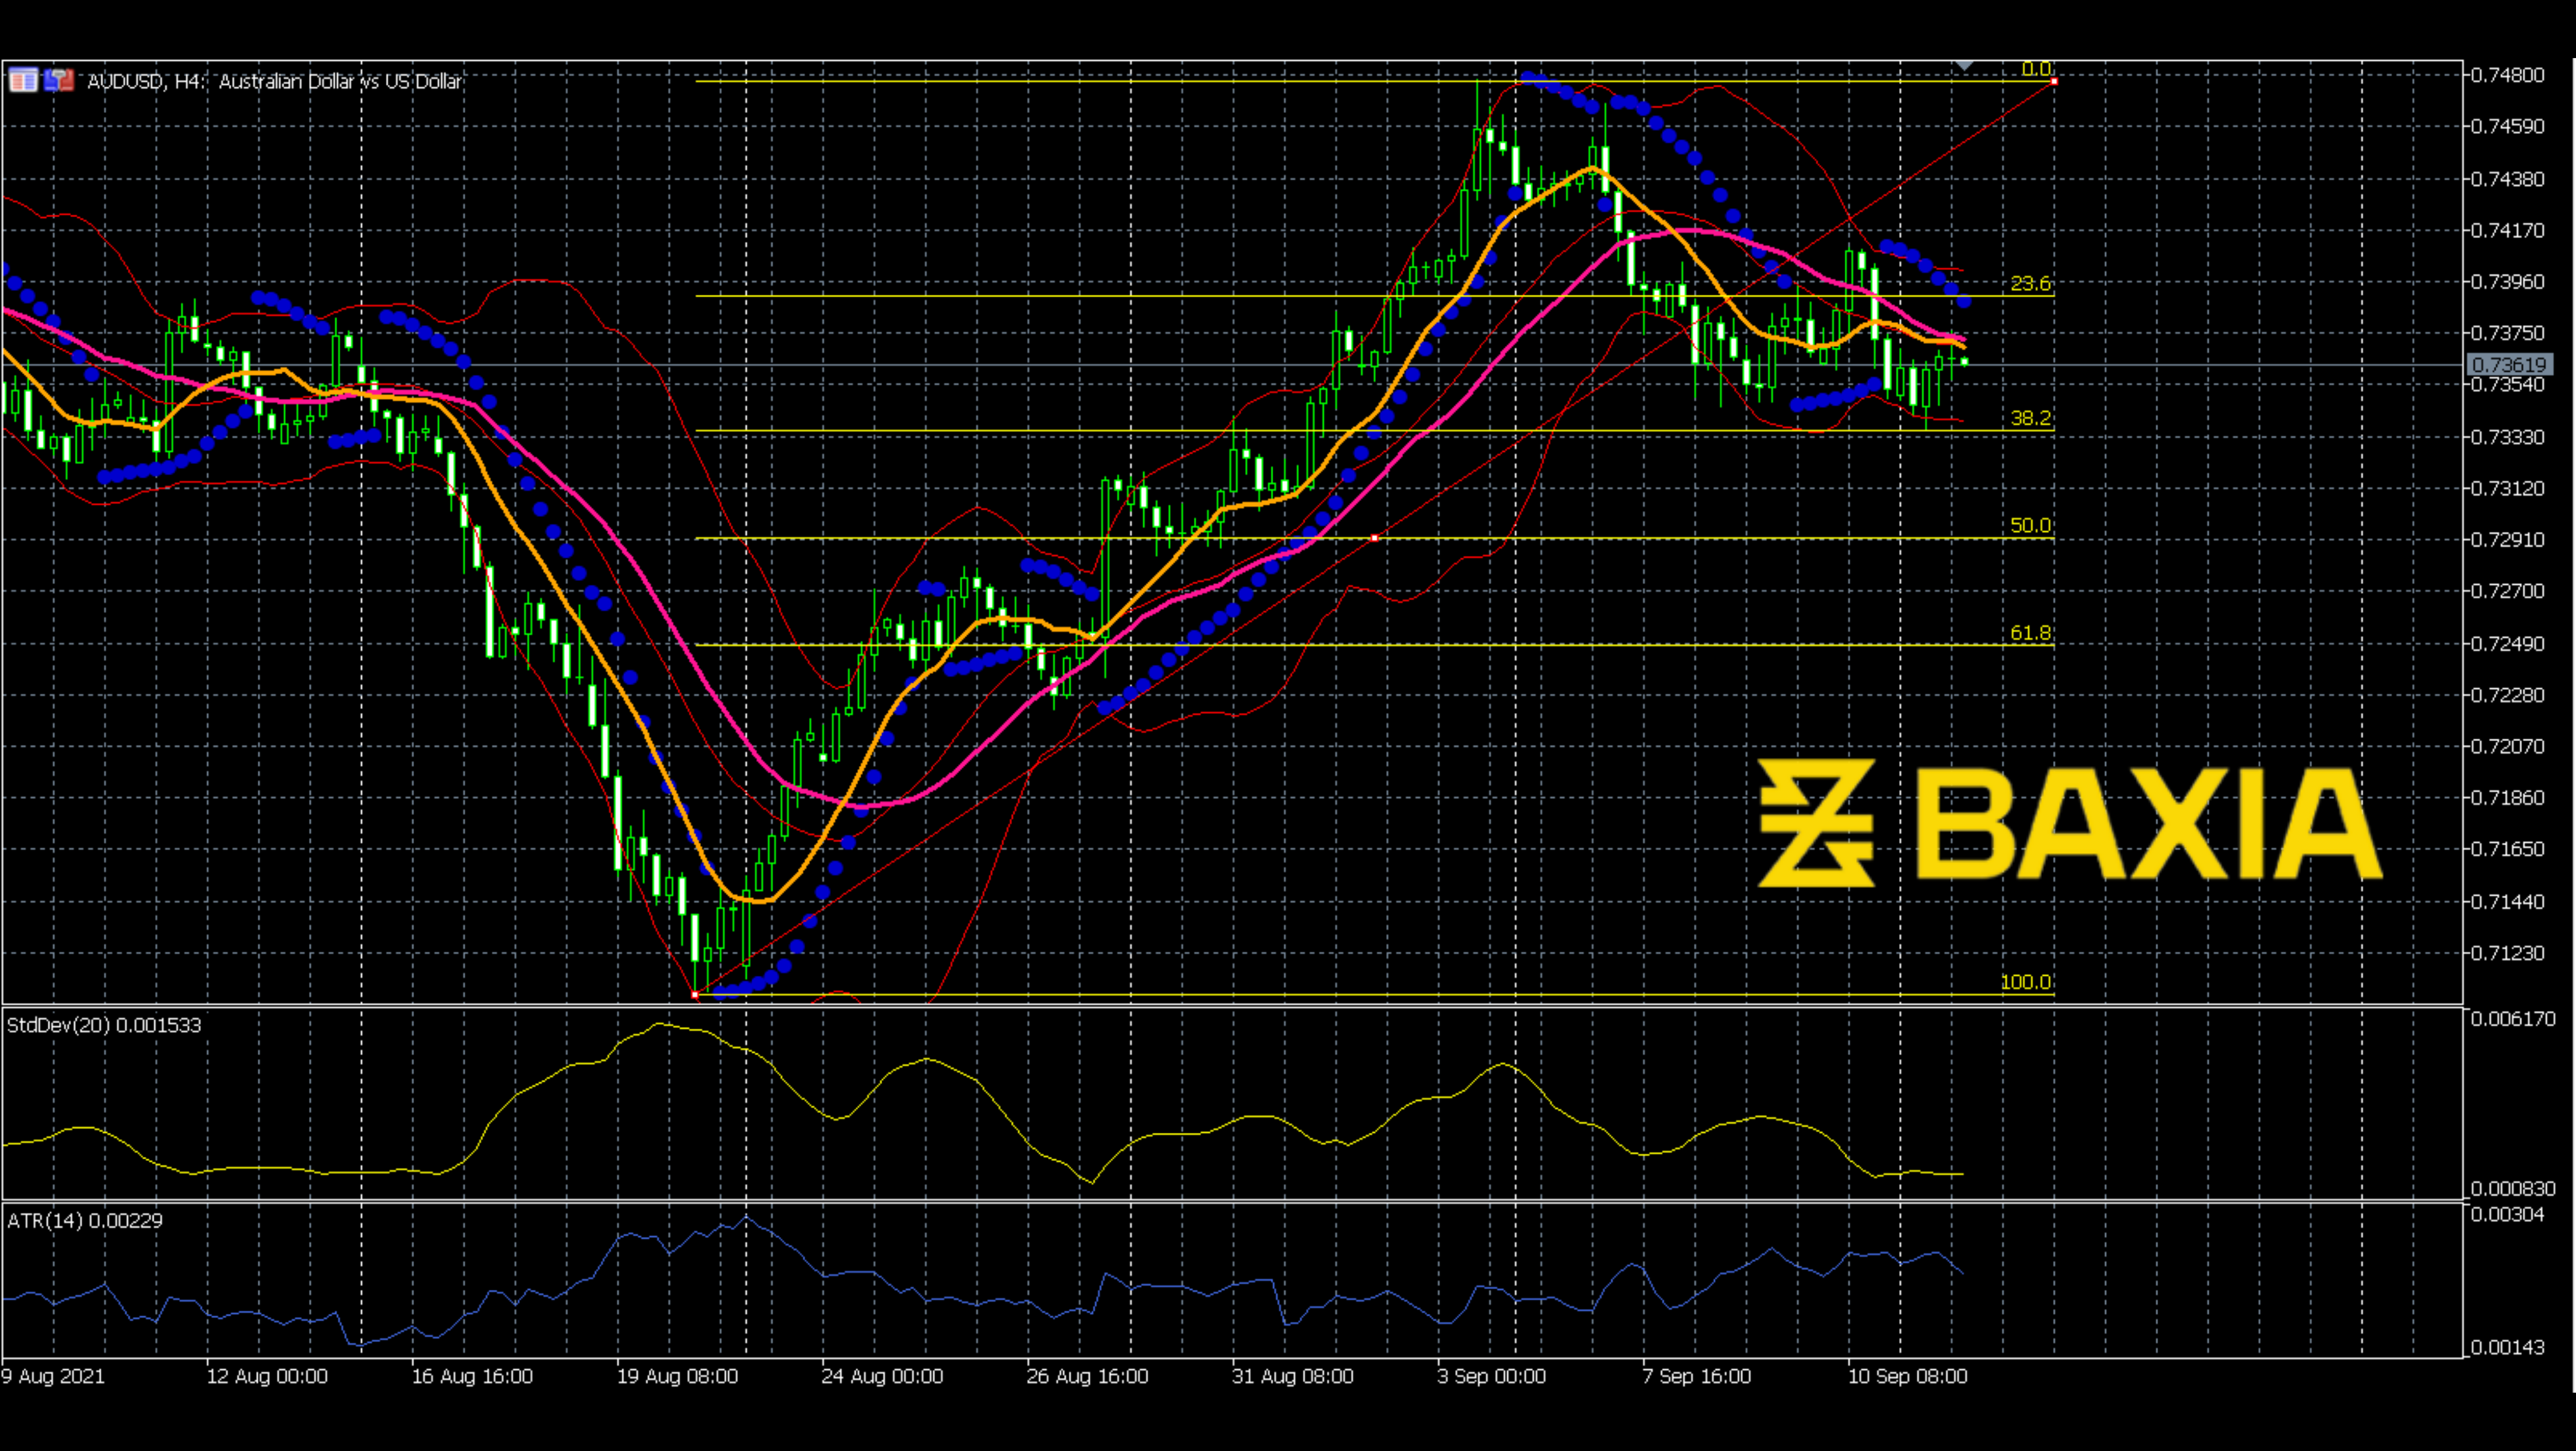

From the daily chart, we can see that the price has been going down for 62 days since May 25th. This was a long and solid downward trip for EURUSD. On Aug 19th, the price met the support, where the price line touched the lower Bollinger Band. Then the price line started to go up. Now, the price line already broke out the upper Bollinger Band and the 38.2 level Fibonacci. What’s next?
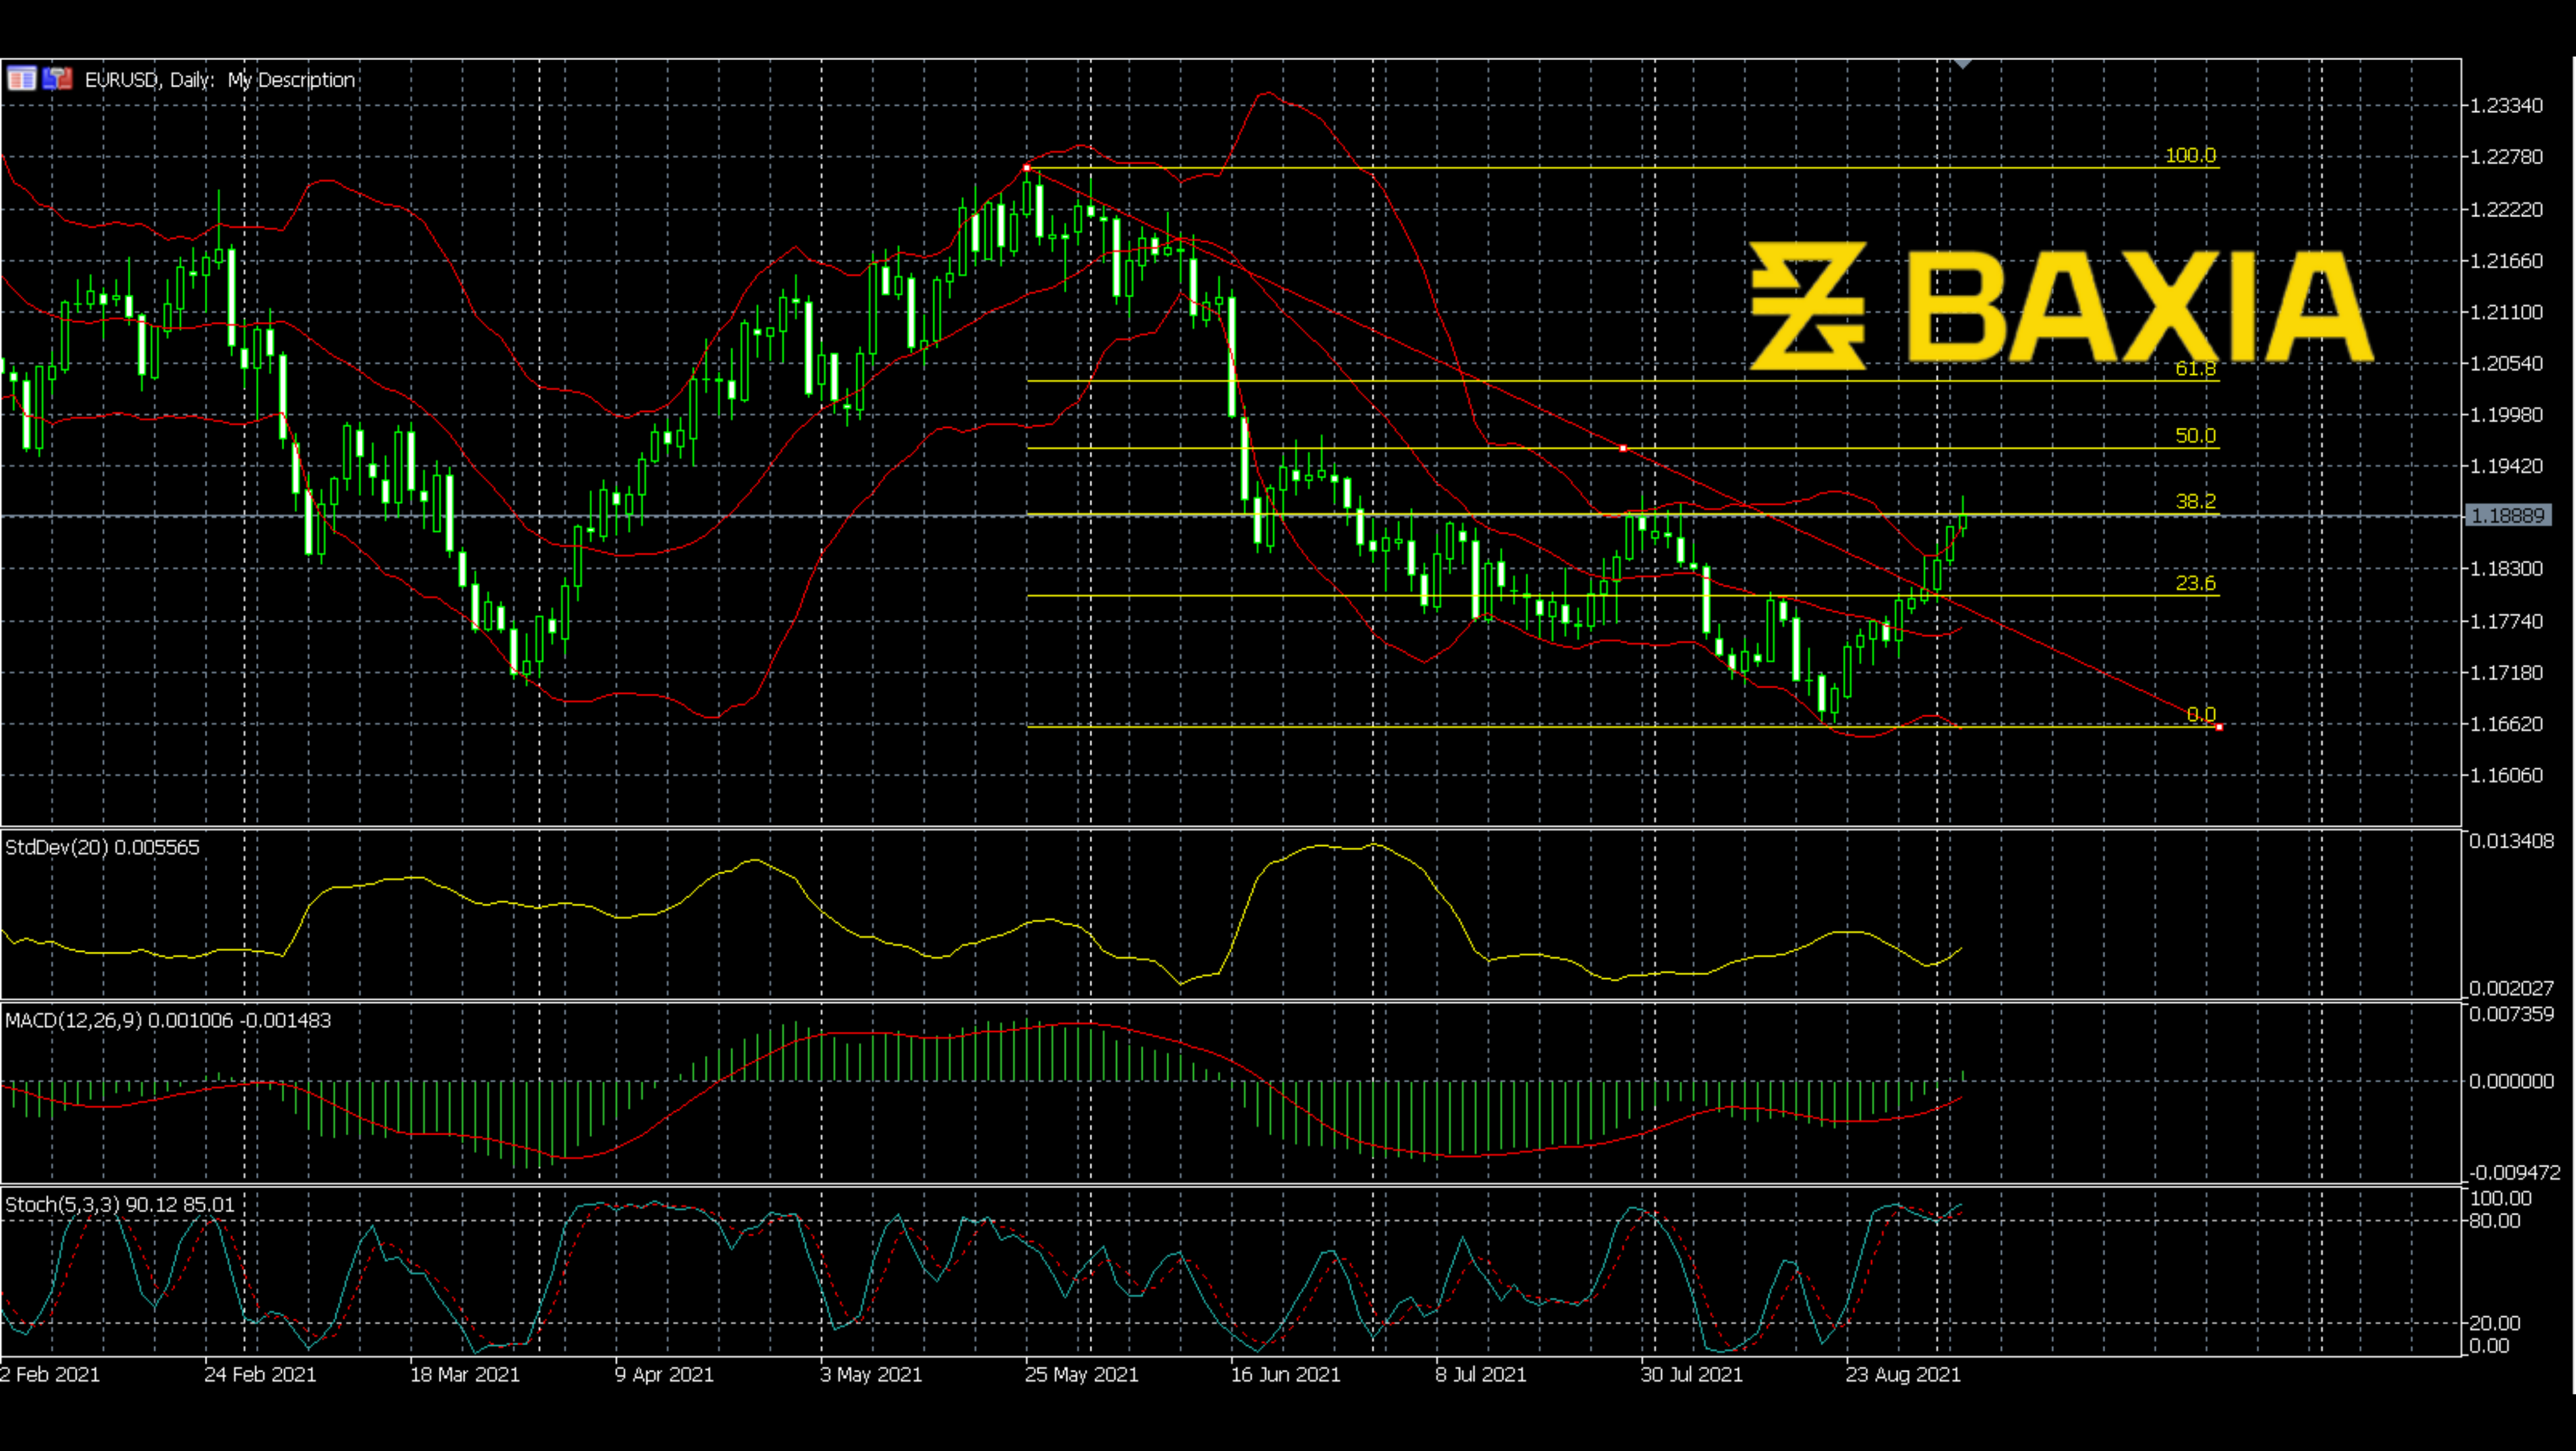
Usually, the price bounces back when it touches the Bollinger Bands; but I do not think the price could turn around this time. The Standard deviation is still at a low level, which means the price will remain in the same fluctuation range for a while. Also, the MACD just made a bullish cross. Traders may consider the Stochastics; it is already overbought. However, the overbought situation could last for a while. Let’s see if the price could reach the 61.8% level Fibonacci.
We love to hear new ideas from traders and want to know what you think!
If you like this topic and want to suggest future topics that you find helpful, let us know by clicking the ‘submit your feedback’ button below.

Trading foreign exchange on margin carries a high level of risk, and may not be suitable for all investors. Before deciding to trade foreign exchange you should carefully consider your investment objectives, level of experience, and risk appetite.
Nothing contained in this website should be construed as investment advice. Any reference to an investment's past or potential performance is not, and should not be construed as, a recommendation or as a guarantee of any specific outcome or profit.