BTCUSD faces strong resistance near the $69,000 level, challenging bullish sentiment. Technical indicators point to a mixed outlook as bears assert pressure on the cryptocurrency.
The upper side of the volume profile of the value area, marked at $69,000, has become a formidable barrier for bulls, preventing upward movement. Despite attempts to break above this key level, BTCUSD has struggled to sustain momentum, with the Exponential Moving Averages (EMA) 50 and 200 narrowing. The EMA 50 remains below the EMA 200, signaling a bearish sentiment prevailing in the market.
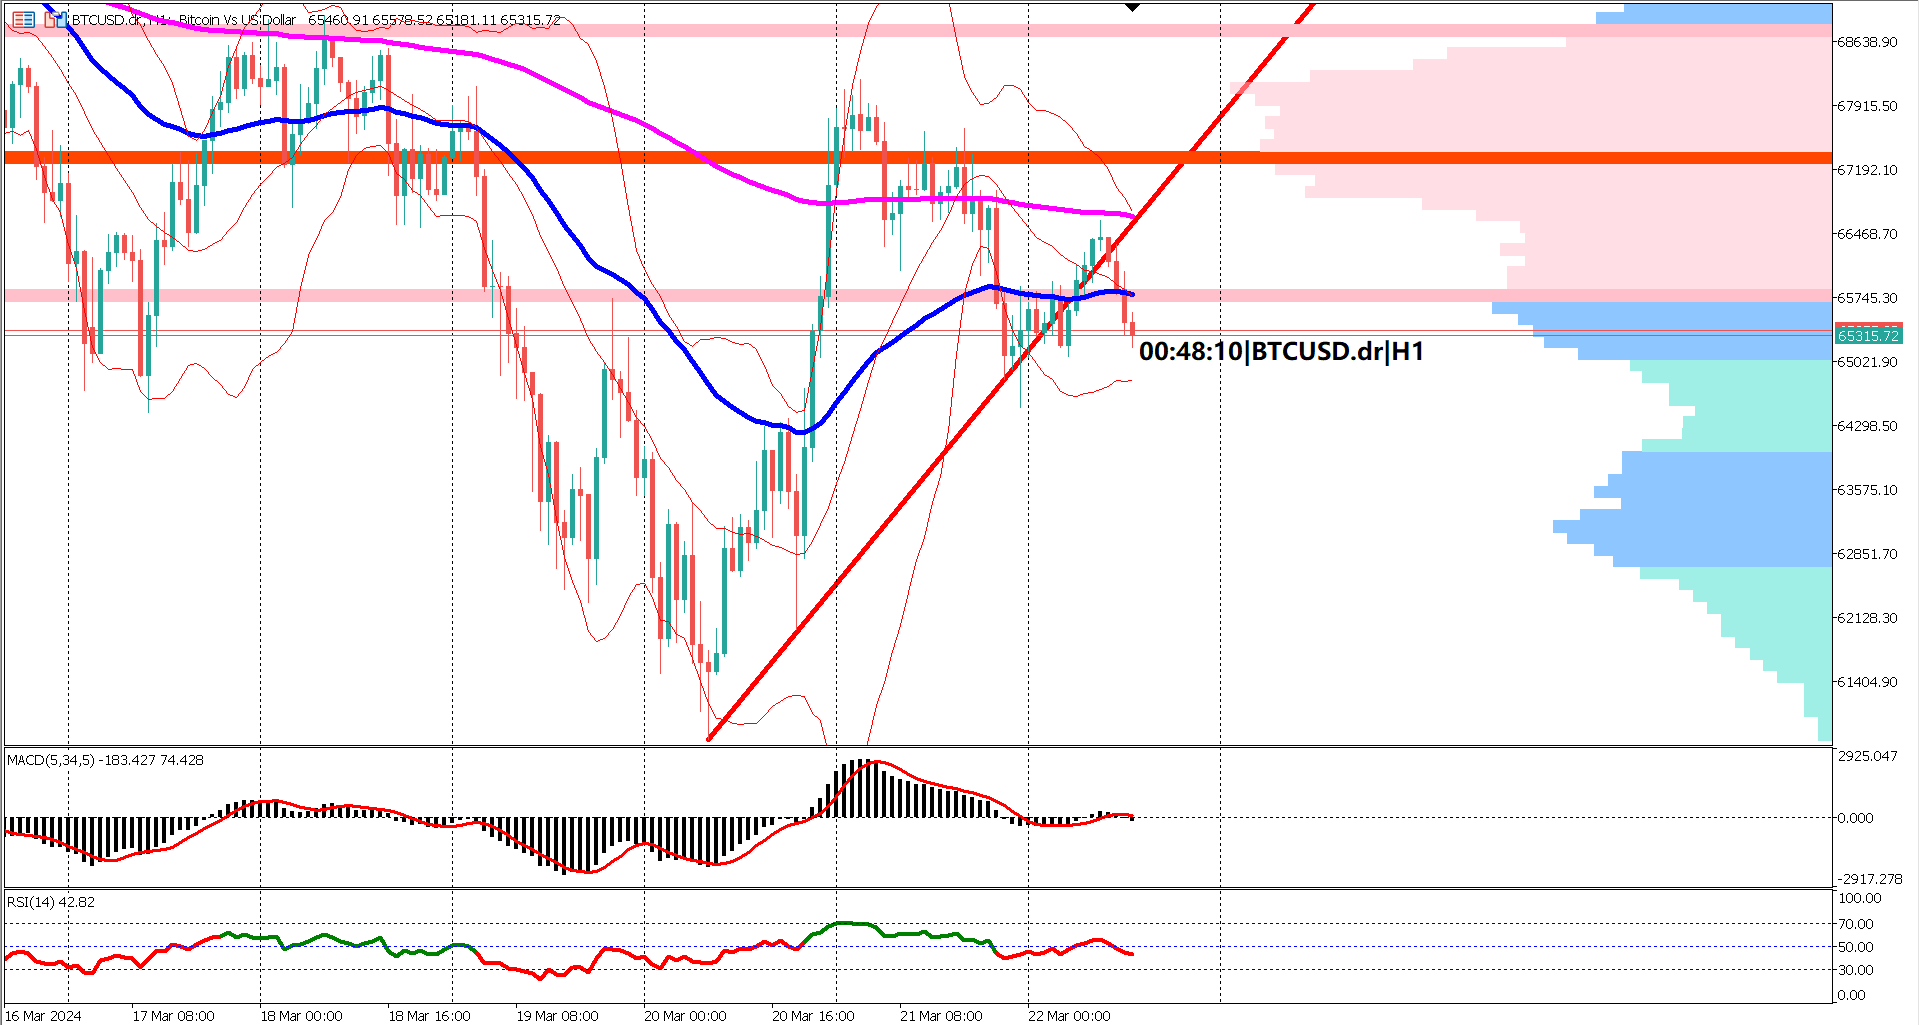
In addition, Bollinger Bands indicate recent price action, with a break below the lower band followed by a rebound near the middle band during the Asian trading session. A potential bullish continuation could be signaled if prices break above the upper band of the Bollinger Bands.
Analyzing oscillator indicators, the Moving Average Convergence Divergence (MACD) oscillates around the 0 line within a short timeframe, indicating sideways movement. Meanwhile, the Relative Strength Index (RSI) briefly dipped below the 40% level, signaling bearish momentum, before rebounding to the 50% level. Overall, oscillators present a mixed and neutral signal for BTCUSD.
Bearish Pressure: BTCUSD faces strong resistance near the $69,000 level, inhibiting bullish momentum and signaling ongoing pressure from bears.
Key Resistance Level: The upper side of the volume profile of the value area at $69,000 acts as a significant barrier for bulls, hindering upward movement in the cryptocurrency.
EMA Positioning: The EMA 50 struggles to float above the EMA 200, indicating a bearish sentiment prevailing in the market and suggesting potential challenges for bullish advancement.
Bollinger Bands Analysis: Recent price action sees BTCUSD breaking below the lower Bollinger Band before rebounding near the middle band during the Asian trading session. A break above the upper band could signal a bullish continuation.
Mixed Oscillator Signals: Oscillator indicators present mixed signals, with the MACD oscillating around the 0 line and the RSI briefly dipping below the 40% level before rebounding to 50%, indicating neutral market sentiment with a slight bearish bias.

Trading foreign exchange on margin carries a high level of risk, and may not be suitable for all investors. Before deciding to trade foreign exchange you should carefully consider your investment objectives, level of experience, and risk appetite.
Nothing contained in this website should be construed as investment advice. Any reference to an investment's past or potential performance is not, and should not be construed as, a recommendation or as a guarantee of any specific outcome or profit.