XRPUSD's bullish rally encountered resistance at 0.6426, leading to the formation of a flag pattern as prices test key support and resistance levels. Technical indicators suggest a potential continuation of the bullish trend, albeit with signs of weakening momentum.
Yesterday's rally saw XRPUSD facing resistance at 0.6426, followed by the formation of a flag pattern today. Prices broke above the Exponential Moving Average (EMA) 200, attempting to maintain their position above it while slowly testing it as support. The convergence of the EMA 50 and 200 towards a golden cross indicates strengthening bullish momentum.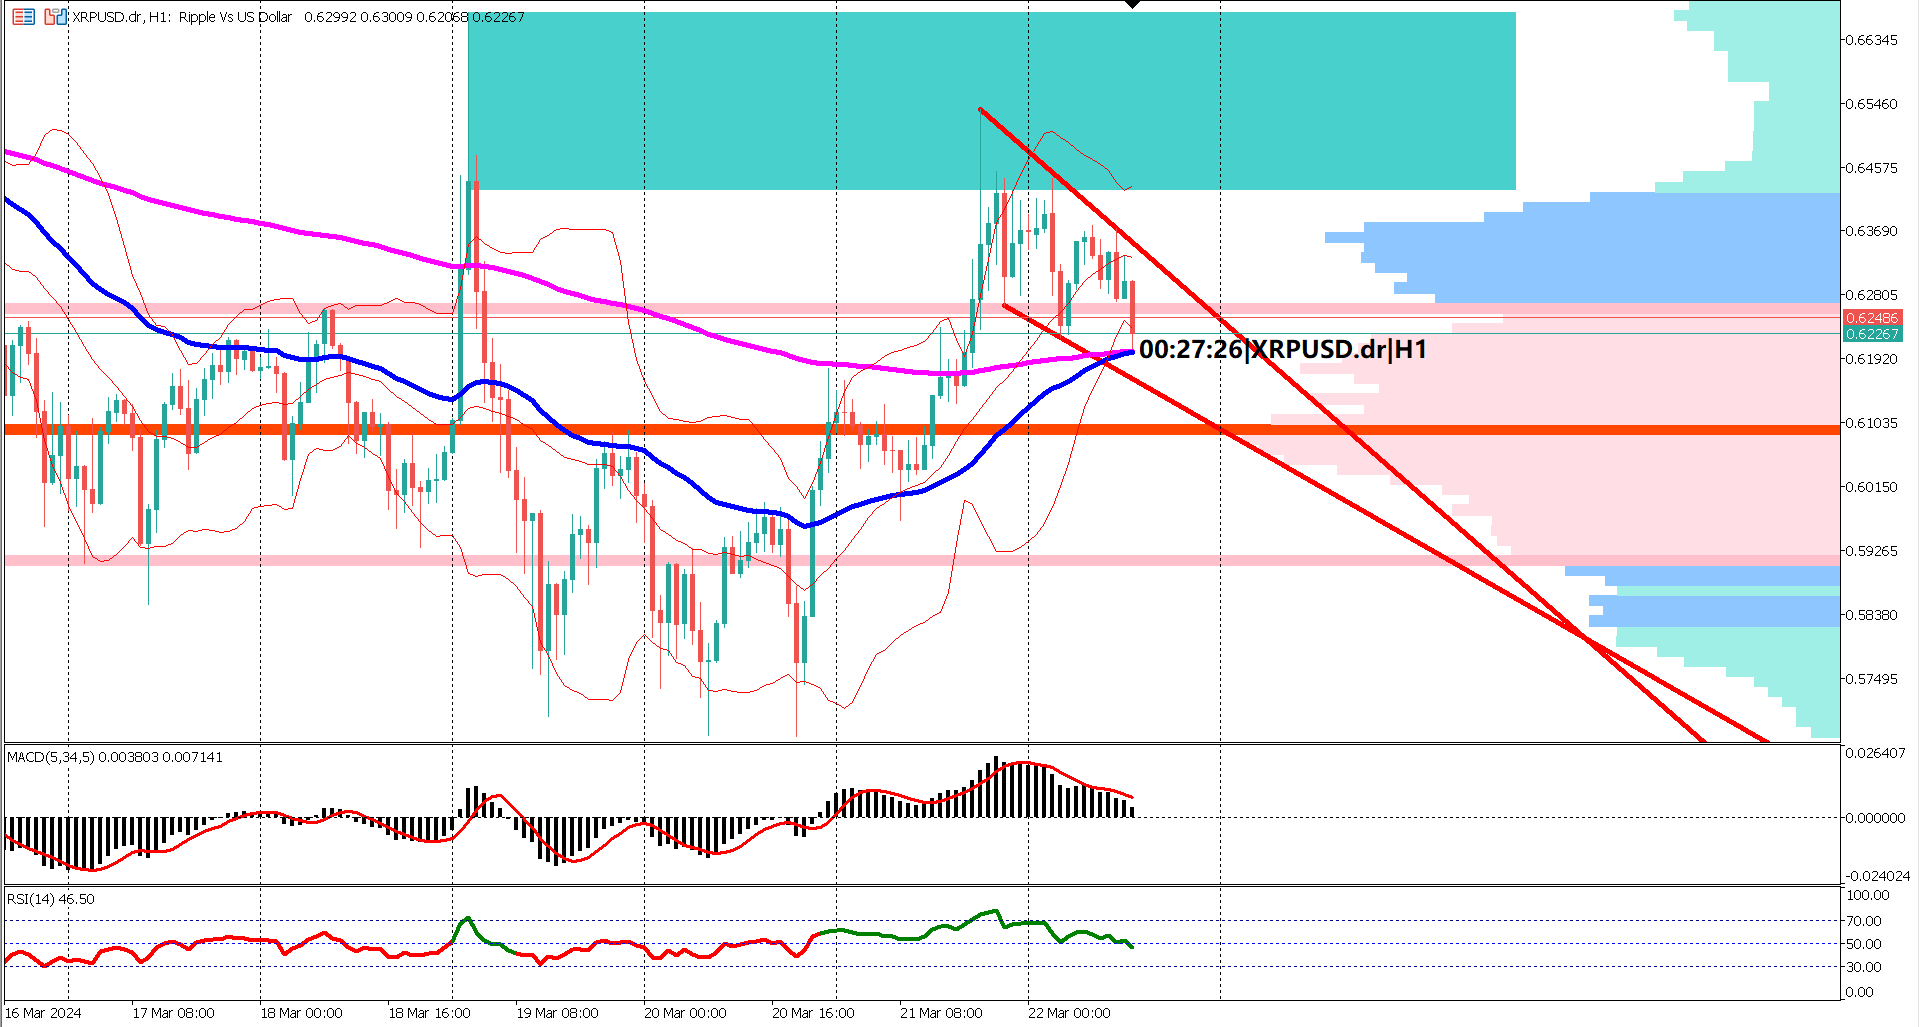
In addition to breaching the upper side of the value area at 0.6270, signaling a bullish trend, traders are closely monitoring the lower side of the value area at 0.5906 as a key support level. A break below this level could indicate a potential bearish reversal.
While the Moving Average Convergence Divergence (MACD) and Relative Strength Index (RSI) both signal bullish sentiment, there are indications of weakening momentum amidst a shallow bullish correction. The RSI's defense of the 40% level and the MACD signal line remaining above the 0 line are crucial for the continuation of the bullish trend.
Resistance and Flag Pattern: XRPUSD faces resistance at 0.6426, leading to the formation of a flag pattern as prices oscillate within a narrow range.
EMA Support: Prices broke above the EMA 200 and are testing it as support, with both the EMA 50 and 200 nearing a golden cross, indicating strengthening bullish momentum.
Value Area Breakout: Breaking above the upper side of the value area at 0.6270 confirms the bullish trend, while the lower side at 0.5906 serves as a key support level to monitor for potential reversals.
Bullish Momentum Indicators: Despite signs of weakening momentum, the MACD and RSI remain bullish. Sustaining the RSI above 40% and the MACD signal line above 0 is crucial for continued bullish sentiment.
Flag Pattern and Technical Signals: Traders closely watch XRPUSD's flag pattern formation and the interplay of key technical indicators to gauge potential price movements amidst the ongoing bullish rally.

Trading foreign exchange on margin carries a high level of risk, and may not be suitable for all investors. Before deciding to trade foreign exchange you should carefully consider your investment objectives, level of experience, and risk appetite.
Nothing contained in this website should be construed as investment advice. Any reference to an investment's past or potential performance is not, and should not be construed as, a recommendation or as a guarantee of any specific outcome or profit.