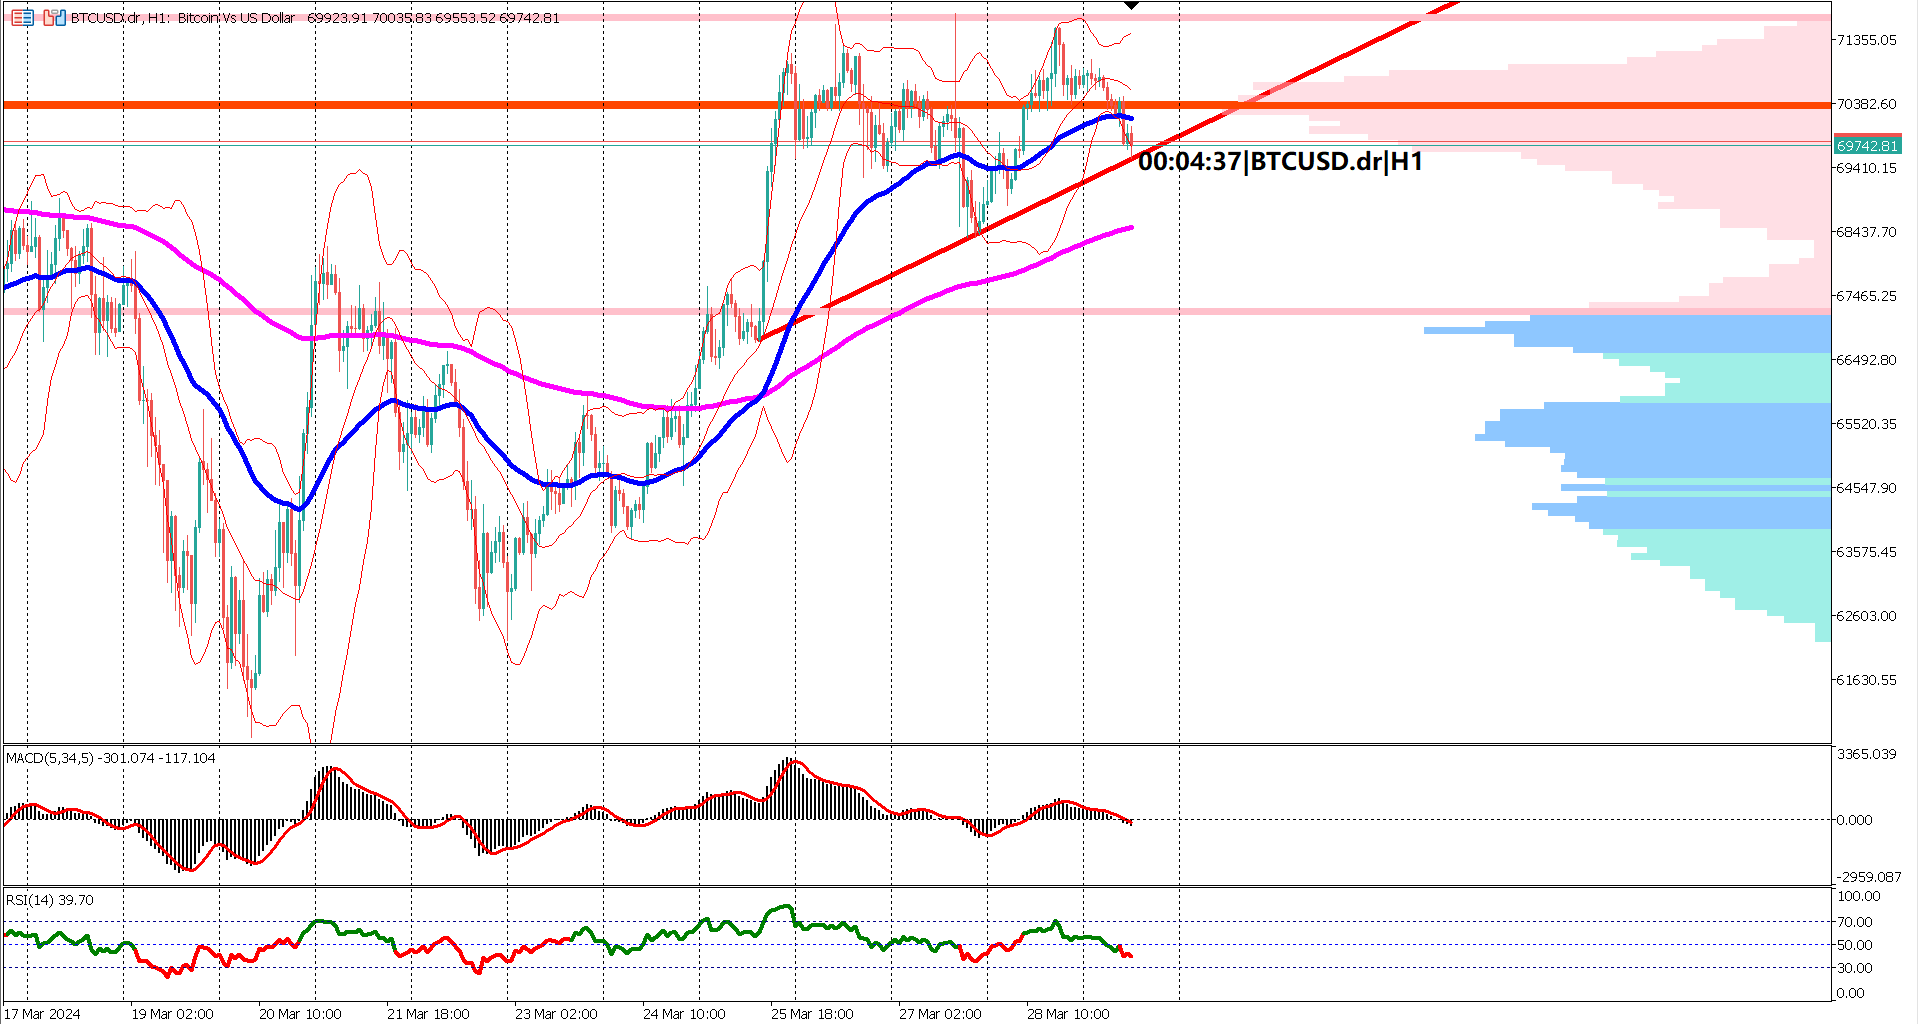
BTCUSD has entered a sideways trend over the last 3 to 4 trading days, marking a pause from the bullish rally witnessed last week spanning three consecutive trading sessions. This current consolidation phase is manifesting in the form of an ascending triangle chart pattern, typically indicative of a bullish continuation if prices breach above the pattern's upper boundary. Conversely, a downside breakout might signal a potential bearish reversal.

While the EMA 50 remains positioned above the EMA 200, signaling a bullish trend, today's market activity shows the EMA 50 curving towards the EMA 200, hinting at a possible weakening of the bullish momentum.
Observing the volume profile indicator, the market is exhibiting sideways or neutral behavior, characterized by ranging movements within the value area.
Given the current sideways movement, it's advisable to exercise caution when relying on oscillator indicators to gauge market trends, as they may provide ambiguous signals amidst such market conditions.
Traders are keeping a close watch on BTCUSD, awaiting a potential breakout from the ascending triangle pattern to discern the next directional move in the cryptocurrency market.
Forecast 2.8% vs Previous 2.8%
Trading foreign exchange on margin carries a high level of risk, and may not be suitable for all investors. Before deciding to trade foreign exchange you should carefully consider your investment objectives, level of experience, and risk appetite.
Nothing contained in this website should be construed as investment advice. Any reference to an investment's past or potential performance is not, and should not be construed as, a recommendation or as a guarantee of any specific outcome or profit.
