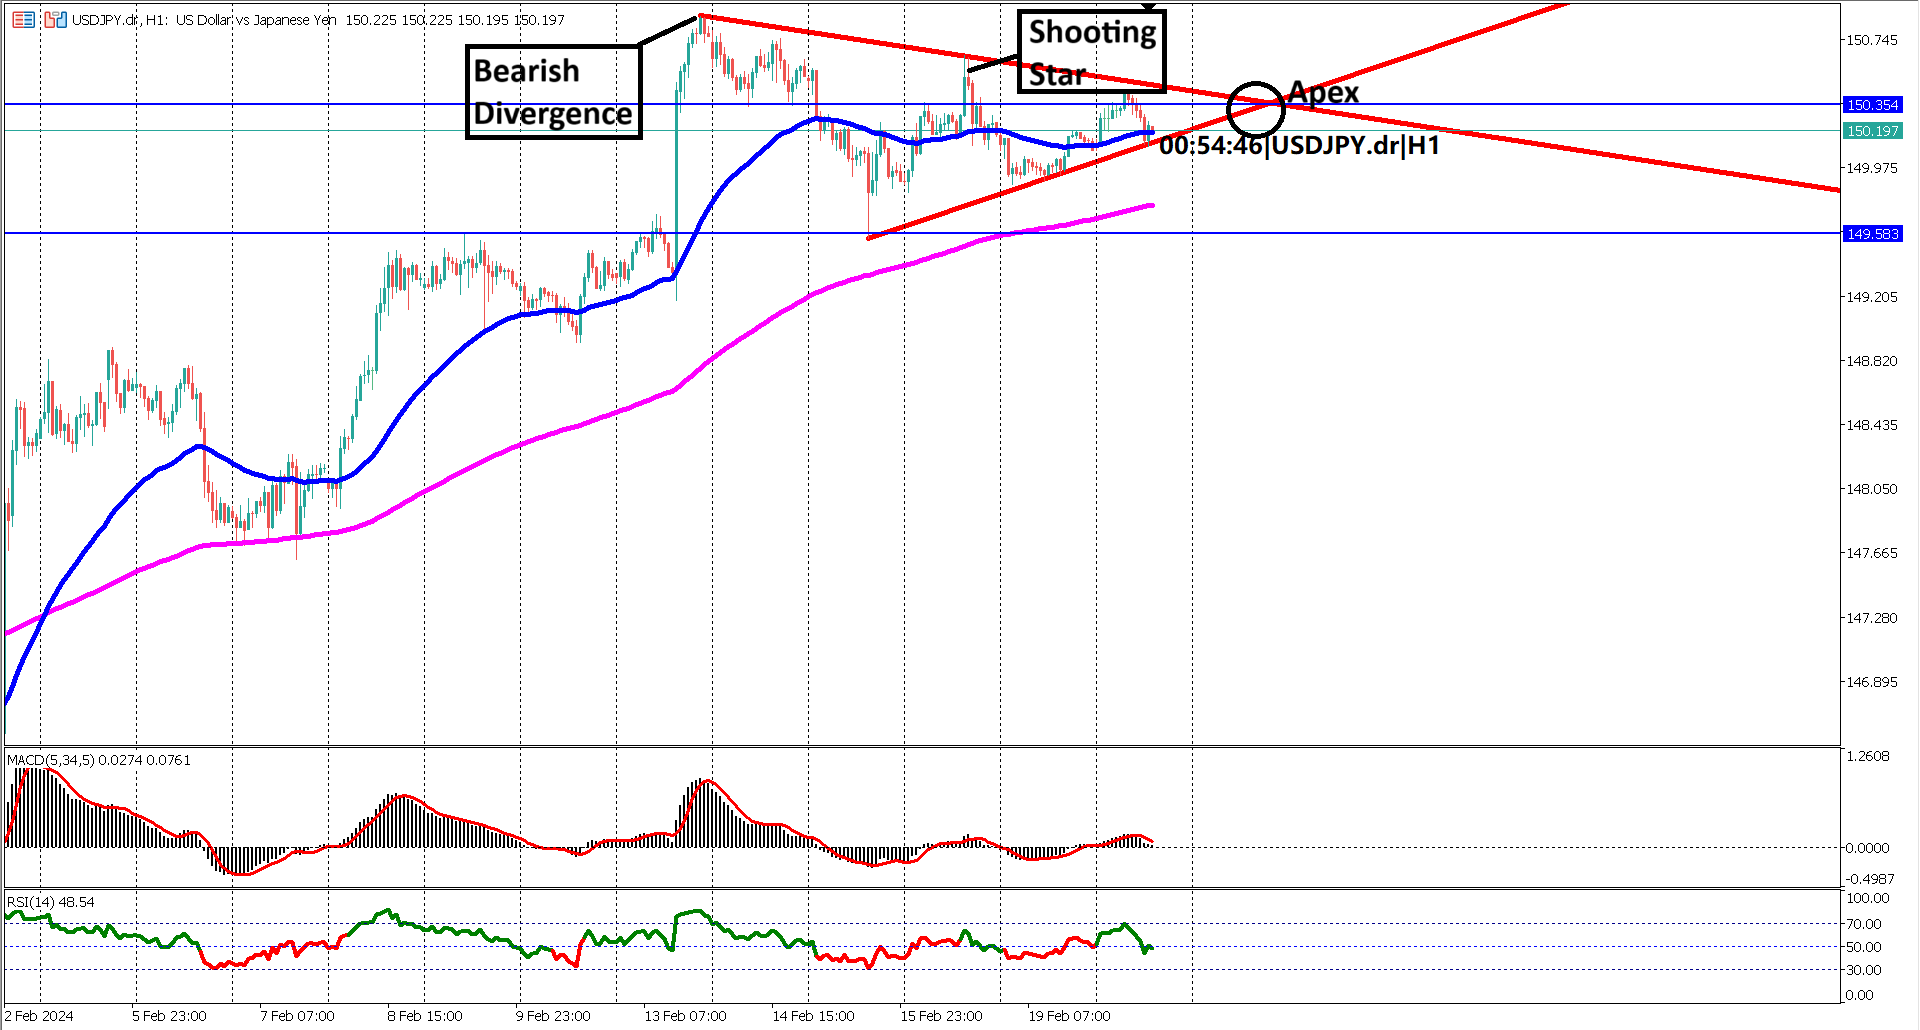

In the past 8 trading days, USD/JPY has exhibited sideways movement, forming an ascending triangle chart pattern. The upper boundary of this pattern sits at 150.88, marked by the formation of a bearish engulfing candlestick.
Despite attempts to breach the resistance zone, notably last Friday, the market faced rejection, experiencing a subsequent 45-pip decline. During today's Asian and European sessions, USD/JPY once again approached the resistance but failed to breach it. Following the initial rejection, it's probable that prices will retest the support at the ascending trendline.
Breaking above the key resistance at 150.88 could lead USD/JPY towards the next significant level at 151.20.
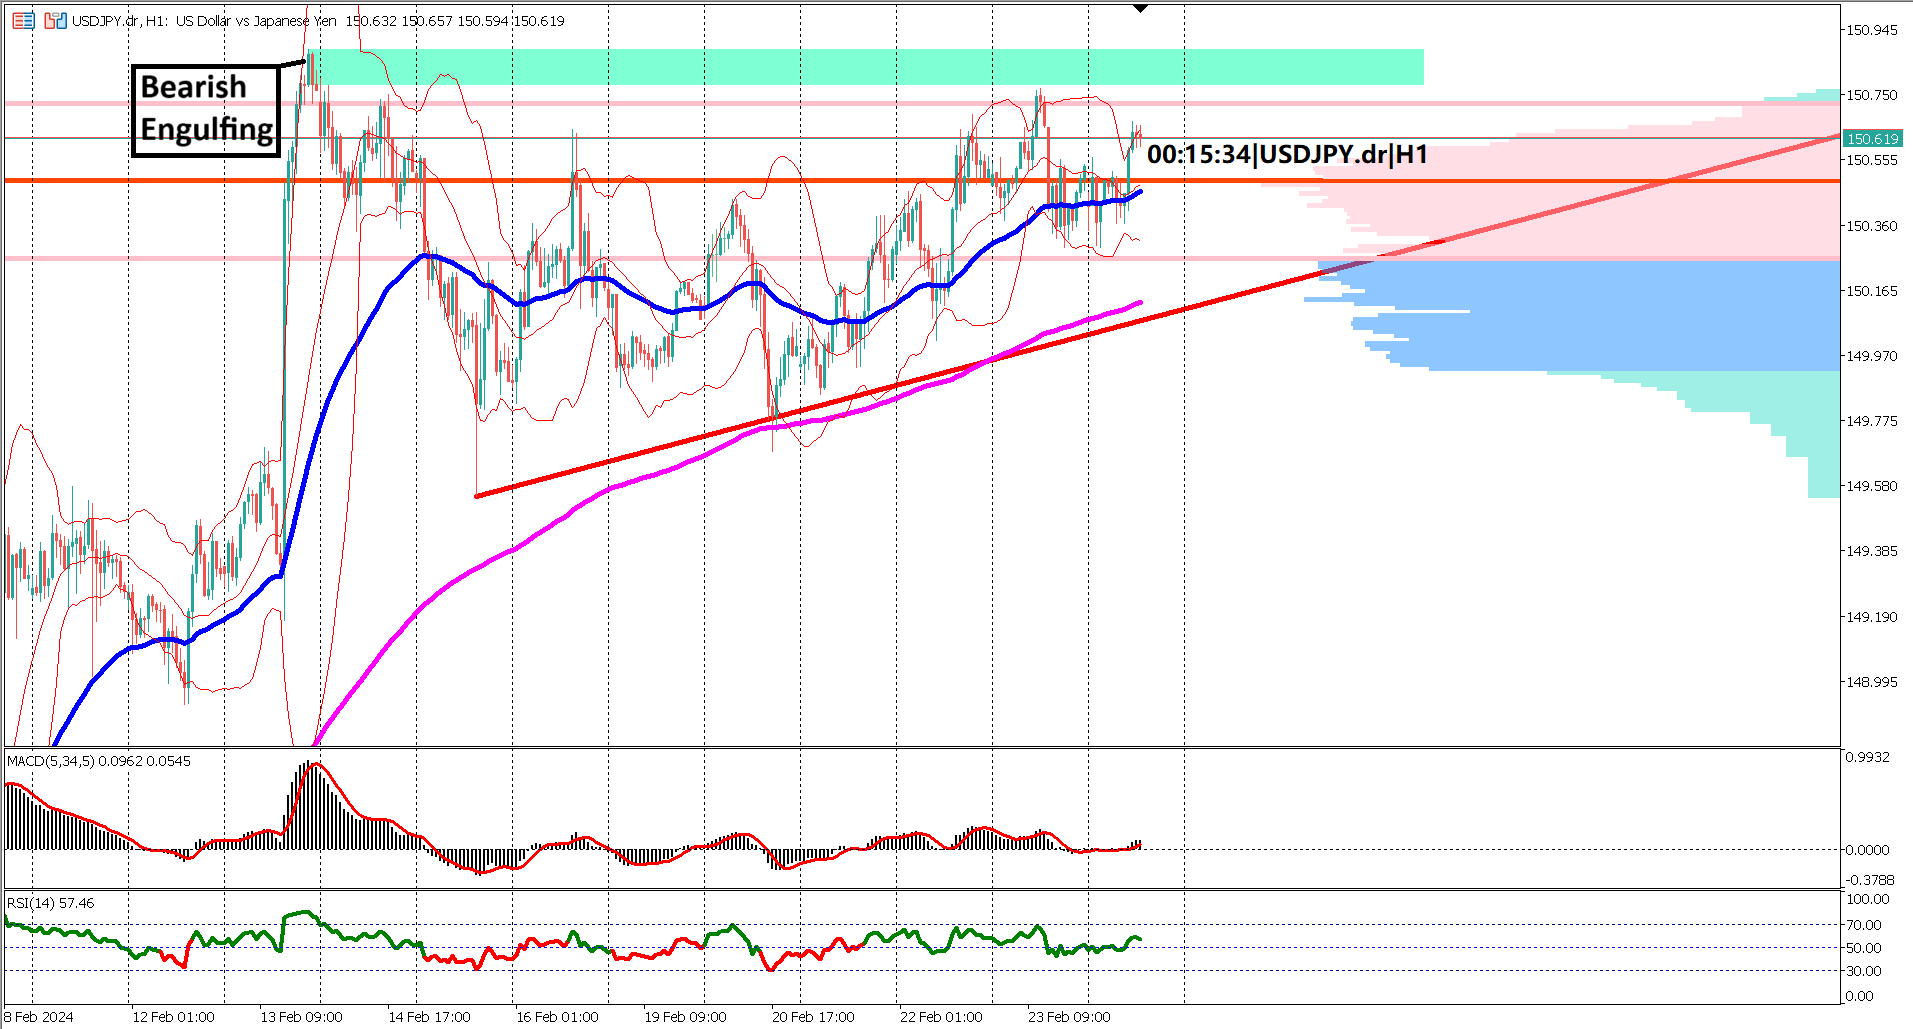
Examining the EMA 50 and EMA 200, their width has narrowed compared to 7 trading days ago. However, the bullish trend remains robust as the EMA 50 diverges from the EMA 200. Should the short-term bearish pressure intensify, the EMA 200 could serve as crucial support. A breach below both the EMA 200 and the ascending trendline would signal a potential bearish reversal.
Analysis of the Bollinger Bands reveals current price action occurring on the upper side of the band. Although prices have broken above the upper band multiple times in recent days, a breach below the lower band would suggest a retest of either the ascending trendline or the EMA 200.
Lastly, while oscillator indicators currently signal bullish momentum, relying solely on them during choppy market conditions, as seen with the ascending triangle formation, may be less reliable.
Key Takeaways:
Forecast 680K vs Previous 664K

Trading foreign exchange on margin carries a high level of risk, and may not be suitable for all investors. Before deciding to trade foreign exchange you should carefully consider your investment objectives, level of experience, and risk appetite.
Nothing contained in this website should be construed as investment advice. Any reference to an investment's past or potential performance is not, and should not be construed as, a recommendation or as a guarantee of any specific outcome or profit.