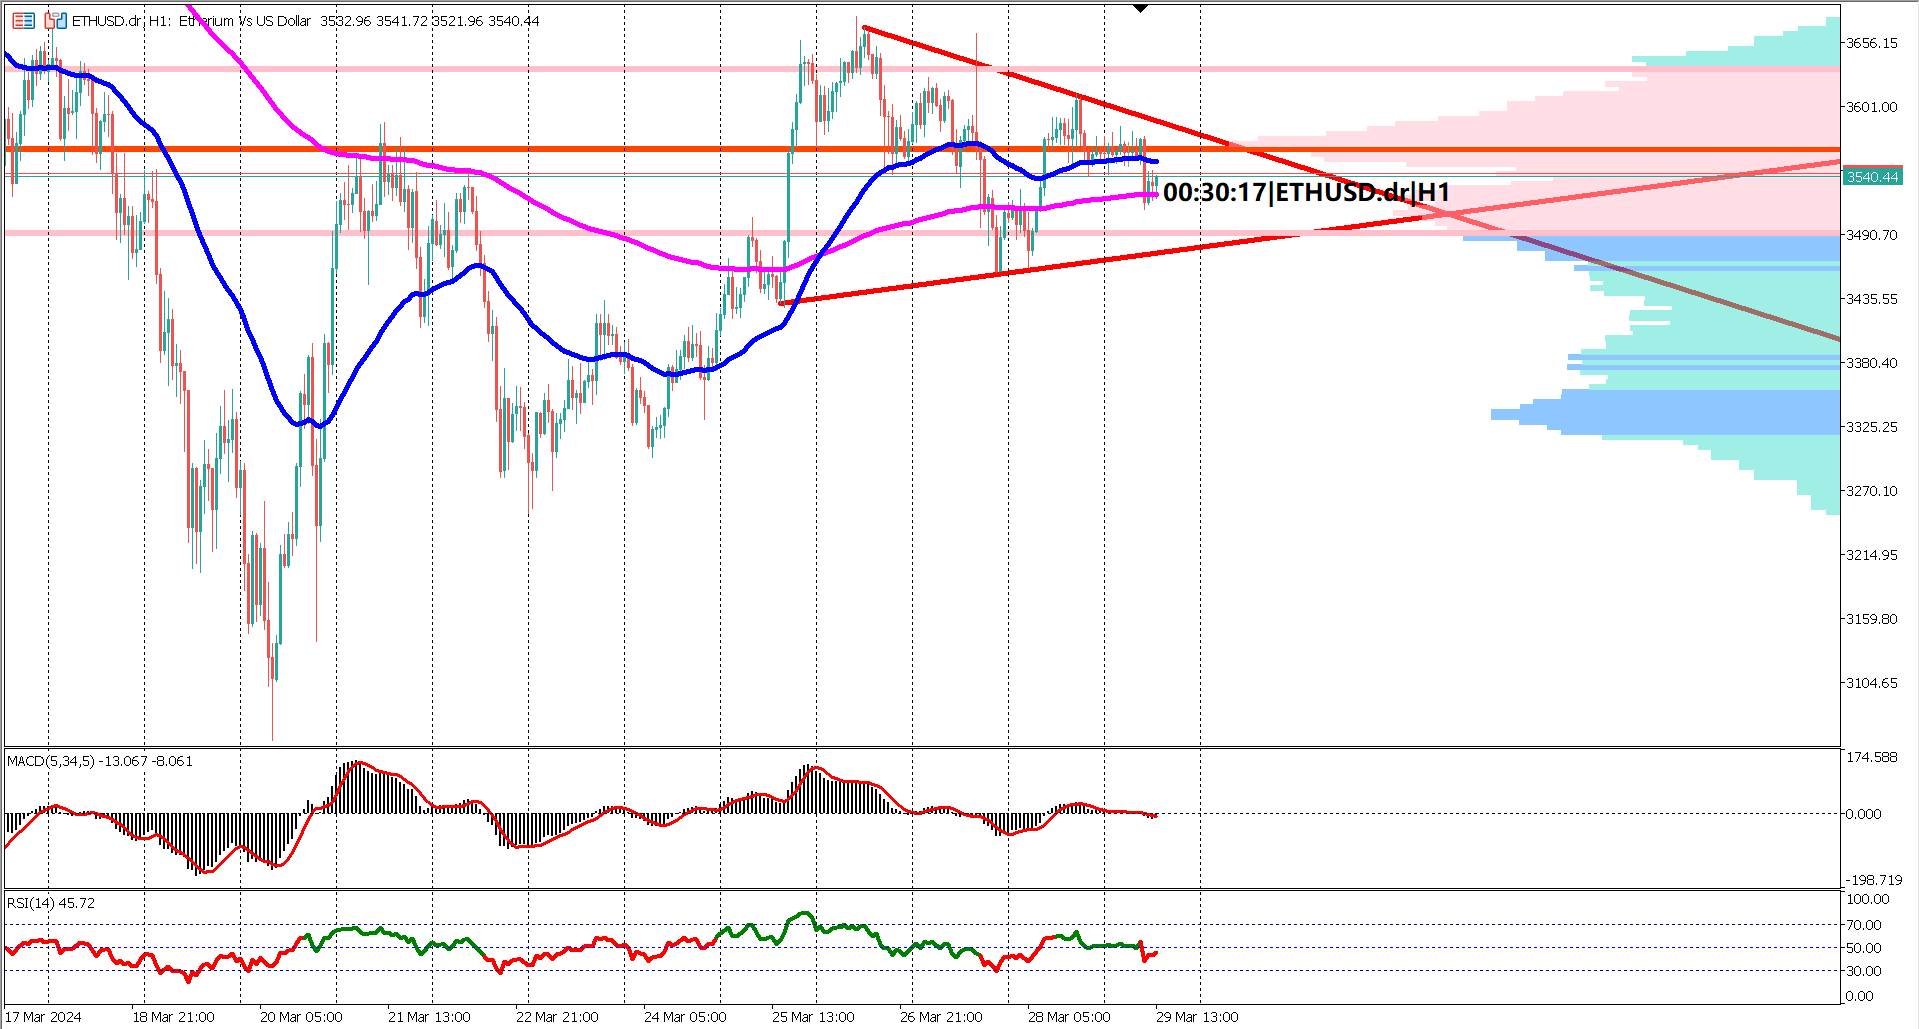
Ethereum (ETH) has entered a period of consolidation after a strong rally last week. The price has been trading sideways for the past 3-4 days, forming a symmetrical triangle chart pattern. This pattern can indicate a continuation of the previous uptrend if prices break above the triangle, but a break below could signal a potential reversal.
Technical indicators are sending mixed messages. The 50-day Exponential Moving Average (EMA) remains above the 200-day EMA, suggesting a bullish trend, but weakening momentum. The narrowing gap between the EMAs raises the possibility of a "death cross" if prices fall below the triangle.
The volume profile indicator shows neutral market sentiment, with prices hovering within a specific range (the value area). Support sits at the bottom of the value area, around $3488.
Analysts advise caution when interpreting oscillator indicators during consolidation phases as they may generate conflicting signals. The next move for ETHUSD depends on whether the price breaks above or below the symmetrical triangle pattern. A breakout above could indicate a continuation of the rally, while a break below might suggest a potential downtrend.
Forecast 2.8% vs Previous 2.8%
Trading foreign exchange on margin carries a high level of risk, and may not be suitable for all investors. Before deciding to trade foreign exchange you should carefully consider your investment objectives, level of experience, and risk appetite.
Nothing contained in this website should be construed as investment advice. Any reference to an investment's past or potential performance is not, and should not be construed as, a recommendation or as a guarantee of any specific outcome or profit.
