
BTCUSD is at a critical juncture on its 4-hour chart, exhibiting signs of resilience in the midst of a consolidation wedge after a remarkable 9 to 11 weeks of bullish momentum. The bulls demonstrate remarkable strength, evident in the formation of substantial bullish candles within the confines of the wedge, despite the ongoing sideways movement.
A notable feature on the chart is the transformation of a resistance level into a support zone, identified within the range of 35483-34973 (blue rectangle). The significance of this zone cannot be overstated, and a break below could usher in a bearish phase for BTCUSD.
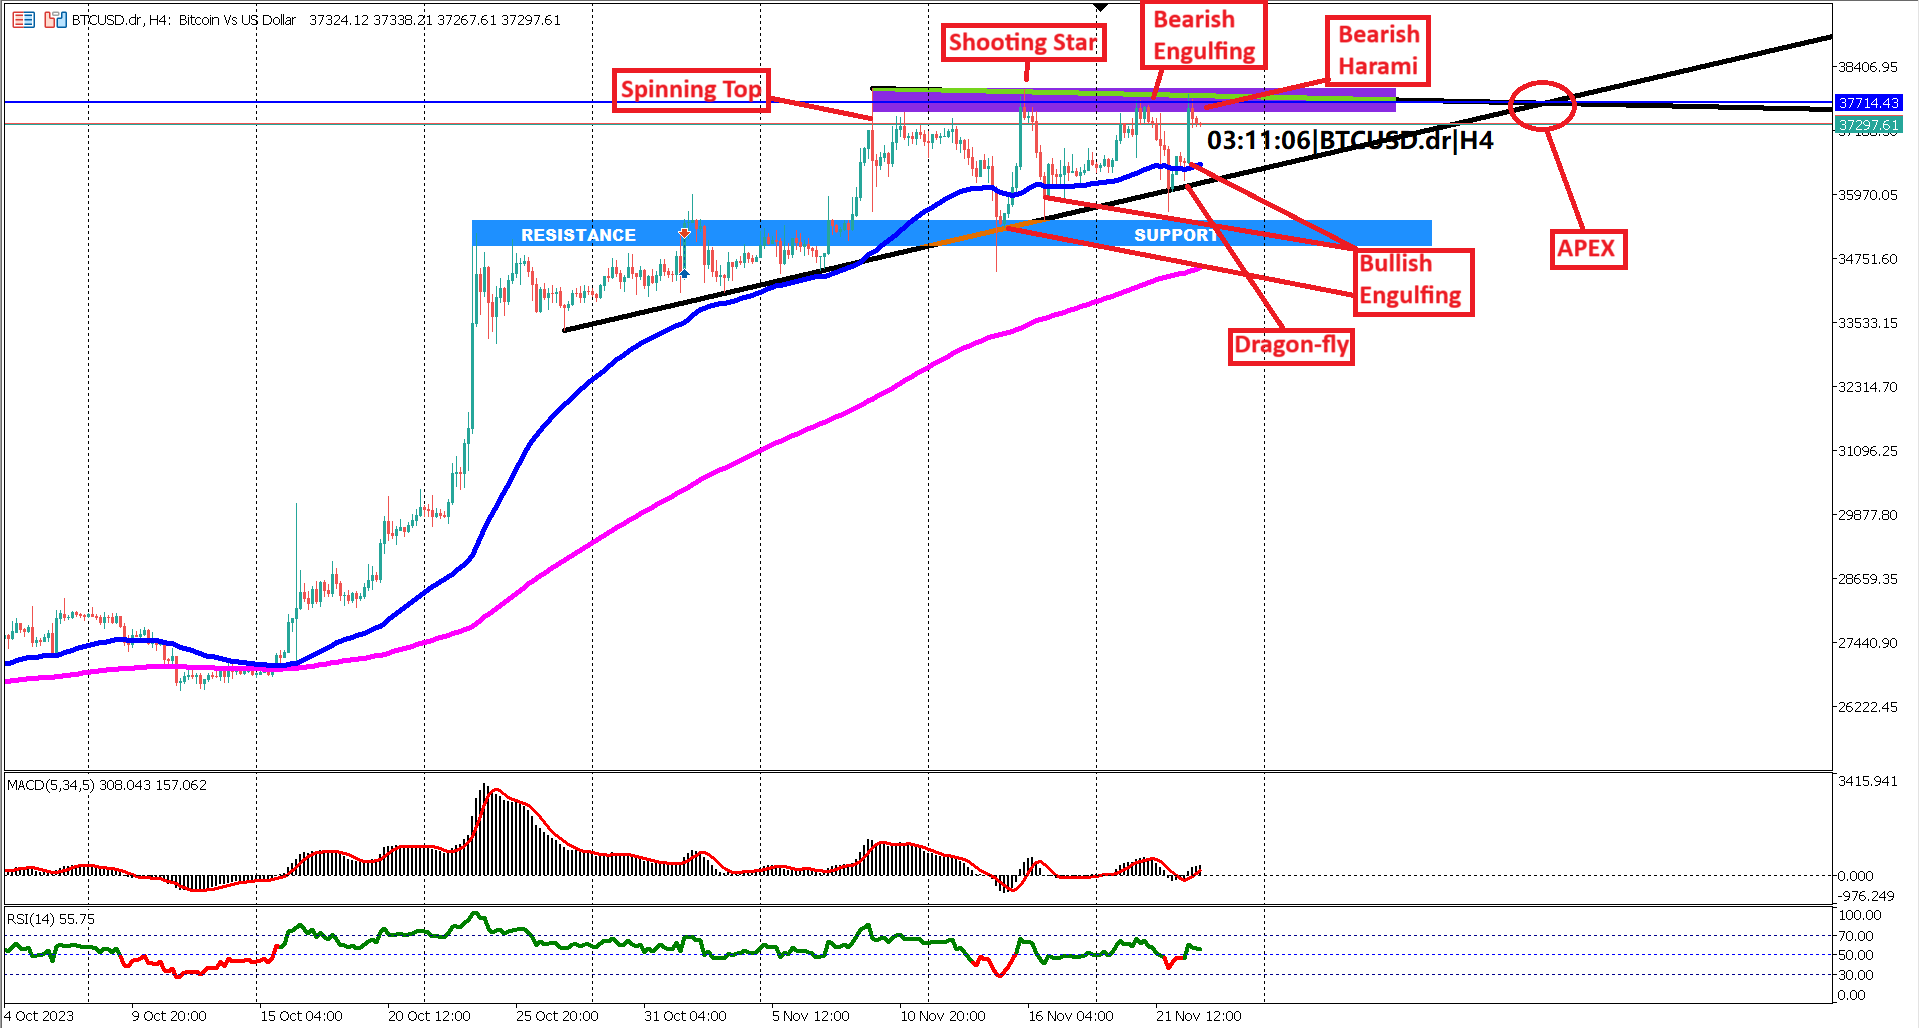
The boundary of the wedge proves to be a dynamic zone, with multiple instances of bullish and bearish candlestick patterns emerging as the price approaches. Traders are advised to pay close attention to these patterns, as they can provide valuable insights into potential market movements.
A key resistance level materializes at the apex of the wedge, denoted by a red circle, precisely at 37714.43. A decisive close above this level has the potential to trigger increased bullish appetite and influence the overall market sentiment.
From a technical standpoint, the trend remains decidedly bullish, supported by the relationship between the EMA 50 and EMA 200. With the EMA 50 consistently above the EMA 200 and the price hovering above both, the chart reflects a robust bullish trend.
The Relative Strength Index (RSI), with a period of 14, recently crossed the 60 level, indicating a bullish sentiment. As long as the RSI remains above 40 since the last cross to 60, the prevailing sentiment, according to RSI, remains bullish. Additionally, the MACD histogram and signal line are comfortably above the 0 line, further reinforcing the overall bullish stance.
In conclusion, BTCUSD faces a crucial juncture as it navigates the consolidation wedge. Traders are advised to closely monitor key support and resistance levels, along with the emerging candlestick patterns, for strategic decision-making. The apex resistance at 37714.43 stands as a focal point, and any developments around this level could have a significant impact on the cryptocurrency's trajectory in the coming sessions.
Key Economic Releases to Watch Today
NZD, Core Retail Sales (QoQ)
Forecast -0.8%% vs Previous -1%

Trading foreign exchange on margin carries a high level of risk, and may not be suitable for all investors. Before deciding to trade foreign exchange you should carefully consider your investment objectives, level of experience, and risk appetite.
Nothing contained in this website should be construed as investment advice. Any reference to an investment's past or potential performance is not, and should not be construed as, a recommendation or as a guarantee of any specific outcome or profit.