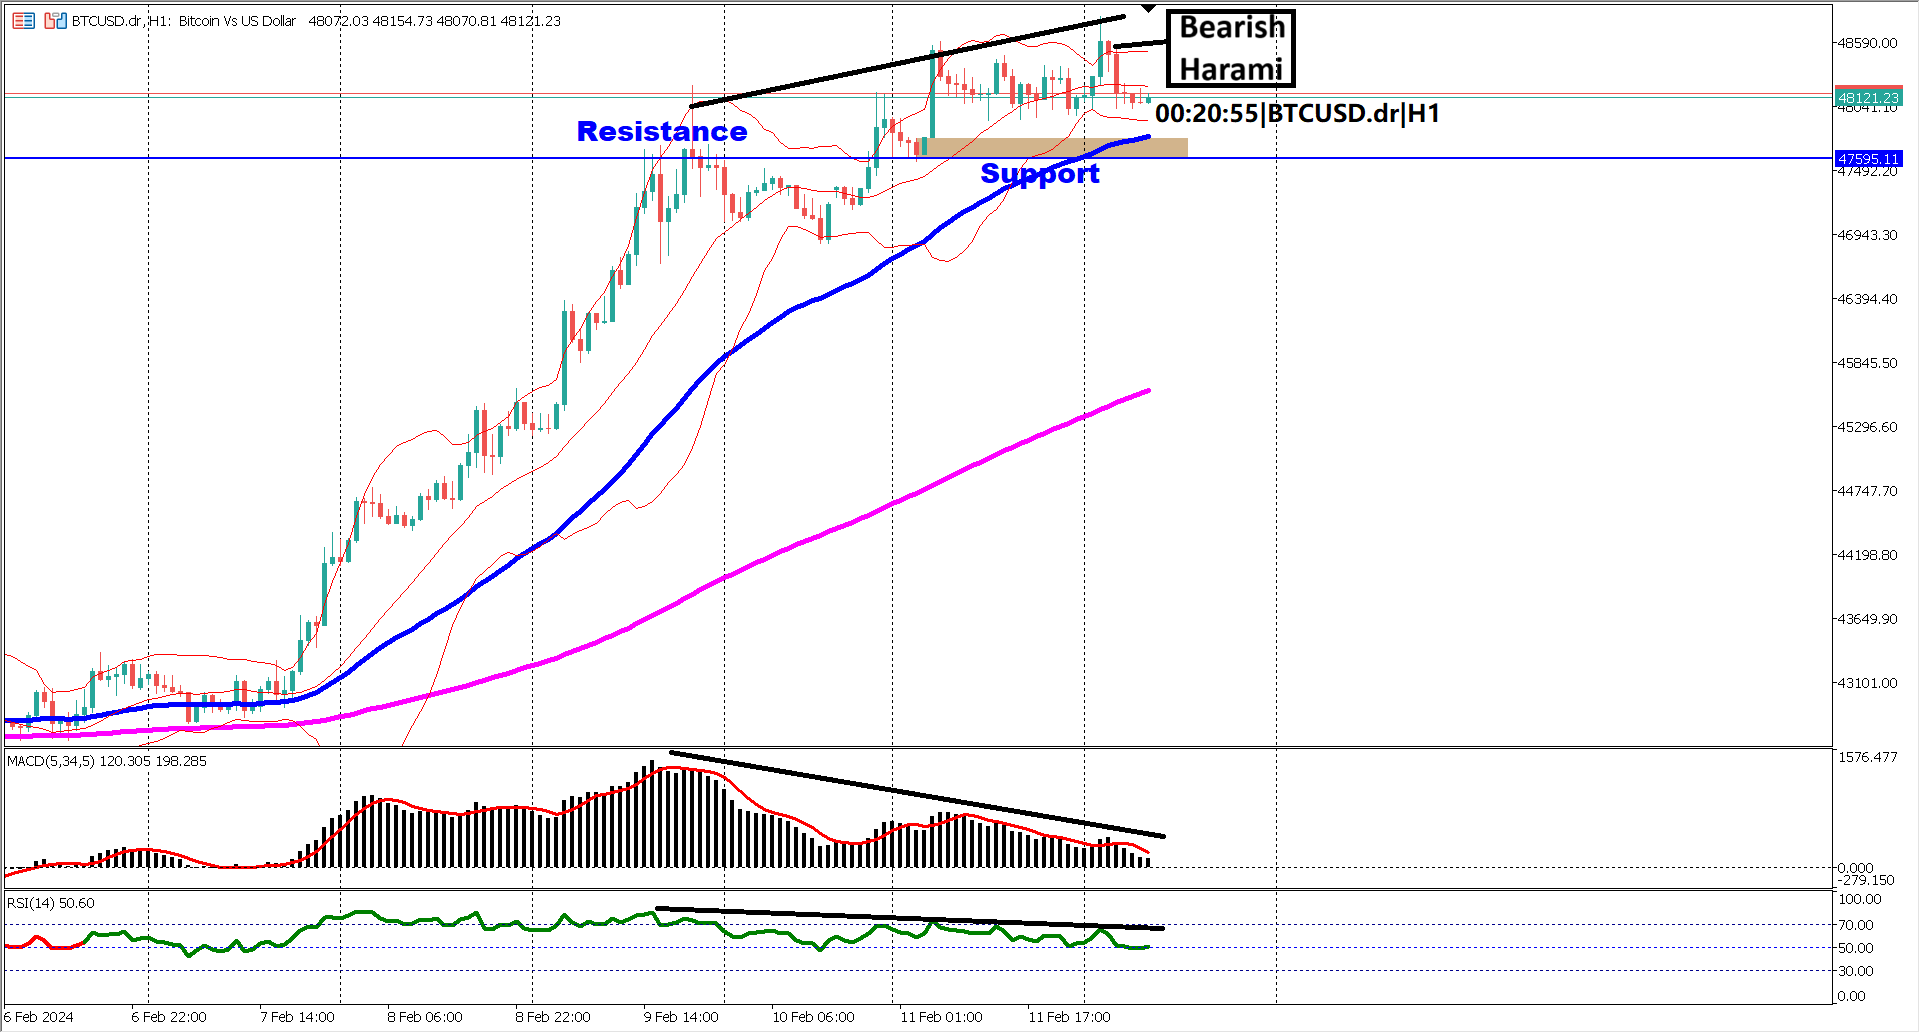

Over the last four trading days, BTC/USD has exhibited steady trading, forming a symmetrical triangle chart pattern. However, the recent price action saw the cryptocurrency retracing 50% of its recent bullish rally, potentially signaling a shift in market sentiment. Additionally, there was a brief dip below the EMA 50. Nevertheless, the market swiftly rebounded, re-entering the symmetrical triangle pattern, breaking above the descending trendline, and reclaiming ground above the EMA 50.
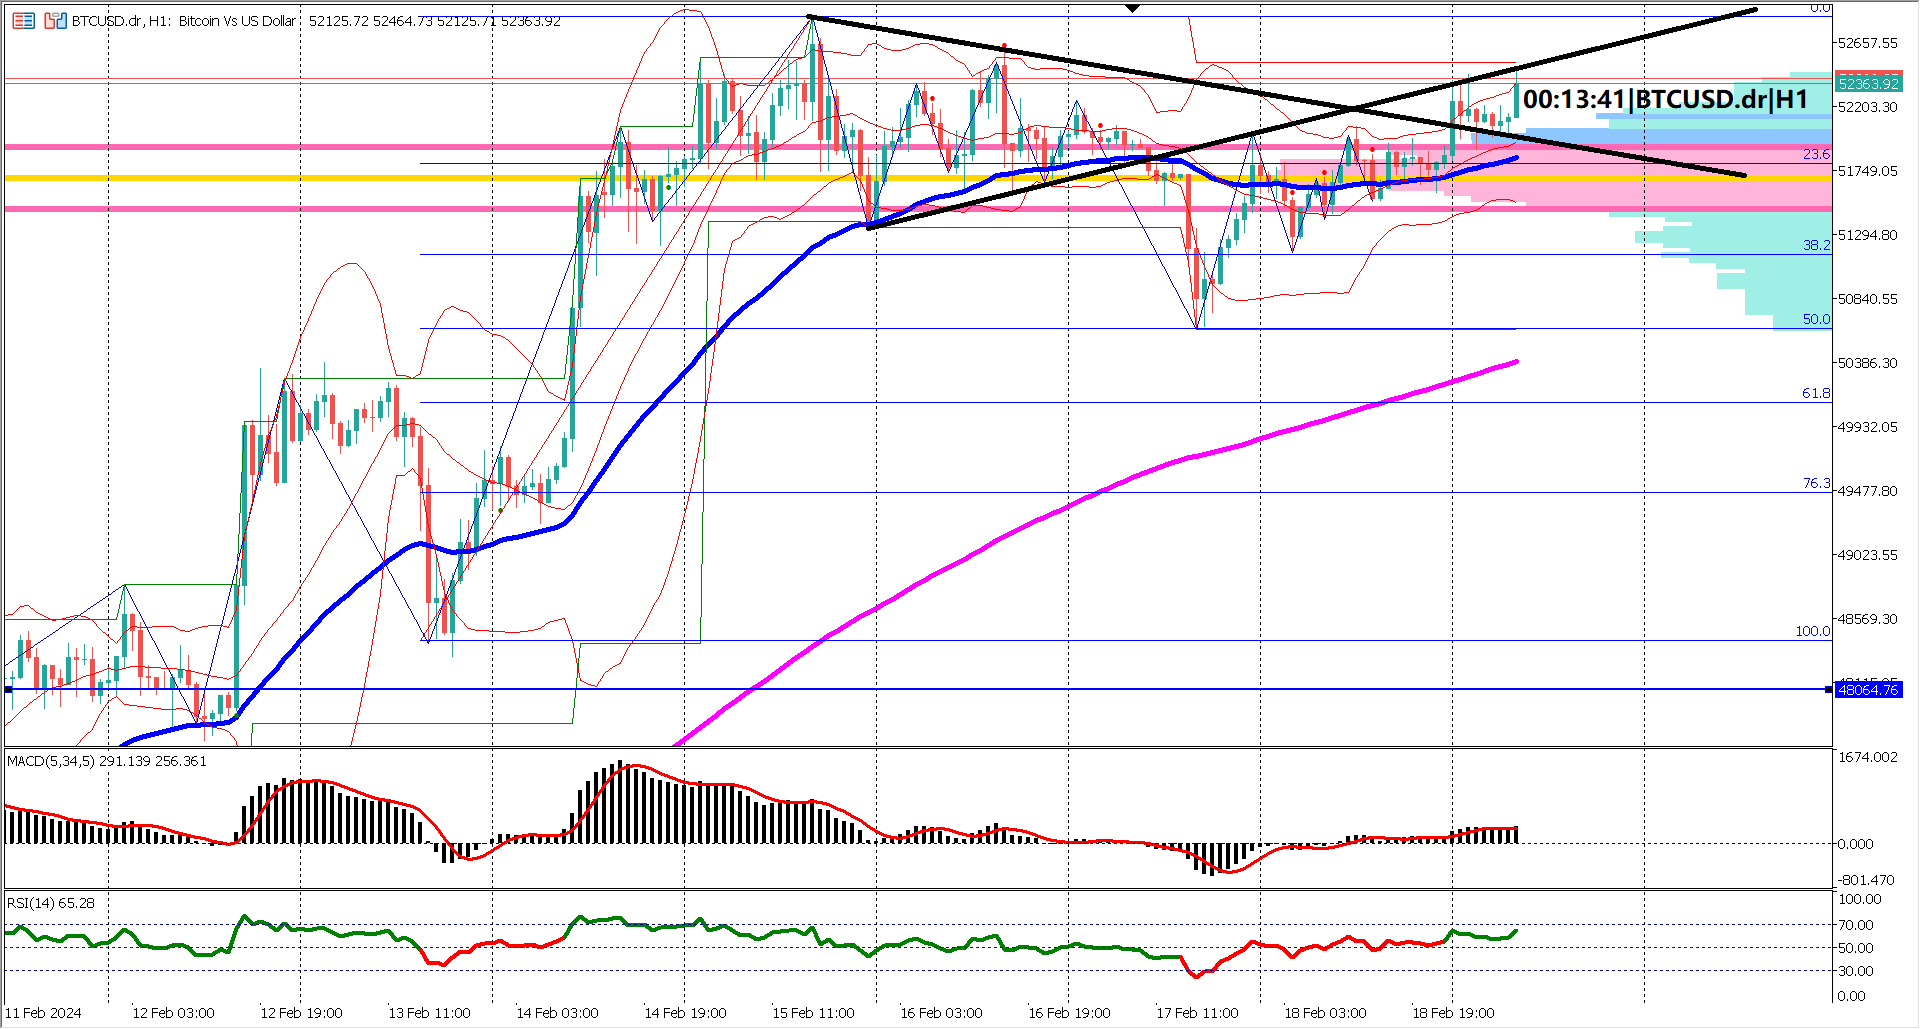
Key support is identified at $51,000, while resistance looms at the recent swing high of $52,500. These levels are crucial in determining the next major move for BTC/USD.
Examining the EMA 50 and 200, both indicators paint a bullish picture. The EMA 50 is angling upwards, mirroring the trajectory of the EMA 200, indicating sustained bullish momentum. Furthermore, the considerable distance between the two averages suggests that the bullish momentum remains robust.
Turning to oscillator indicators, both the MACD and RSI confirm the bullish bias. The MACD's signal line maintains its position above the zero line, signifying bullish momentum. Meanwhile, the RSI, over the past eight trading hours, has consistently traded above 40% since its recent breakout above 60%, signaling growing strength in bullish sentiment, particularly evident during today's Asian trading session.
In summary, the bullish trend in BTC/USD remains solid. With the potential for price to defend the $50,000 trading range, the cryptocurrency is poised to target the $55,000 level in the near term.
Forecast 0.7% vs Previous -4.9%

Trading foreign exchange on margin carries a high level of risk, and may not be suitable for all investors. Before deciding to trade foreign exchange you should carefully consider your investment objectives, level of experience, and risk appetite.
Nothing contained in this website should be construed as investment advice. Any reference to an investment's past or potential performance is not, and should not be construed as, a recommendation or as a guarantee of any specific outcome or profit.