
Friday brings the latest U.S. employment survey, a pivotal report that may influence the Federal Reserve's monetary policy. Anticipated to create market volatility, it's expected that U.S. employers added 180,000 jobs in October, holding the unemployment rate steady at 3.8%. Additionally, monthly earnings are projected to rise by 0.3%, contributing to an annual increase of 4.3%. Wage growth is significant to the Fed as it hints at inflation trends and their alignment with the 2.0% target. Watch closely for market reactions following this release.
In particular, the price movements of XRP (Ripple) and BNB (Binance Coin) have been the subject of keen interest. Let's delve into the recent price actions of these two prominent cryptocurrencies ahead of the pivotal economic report release.
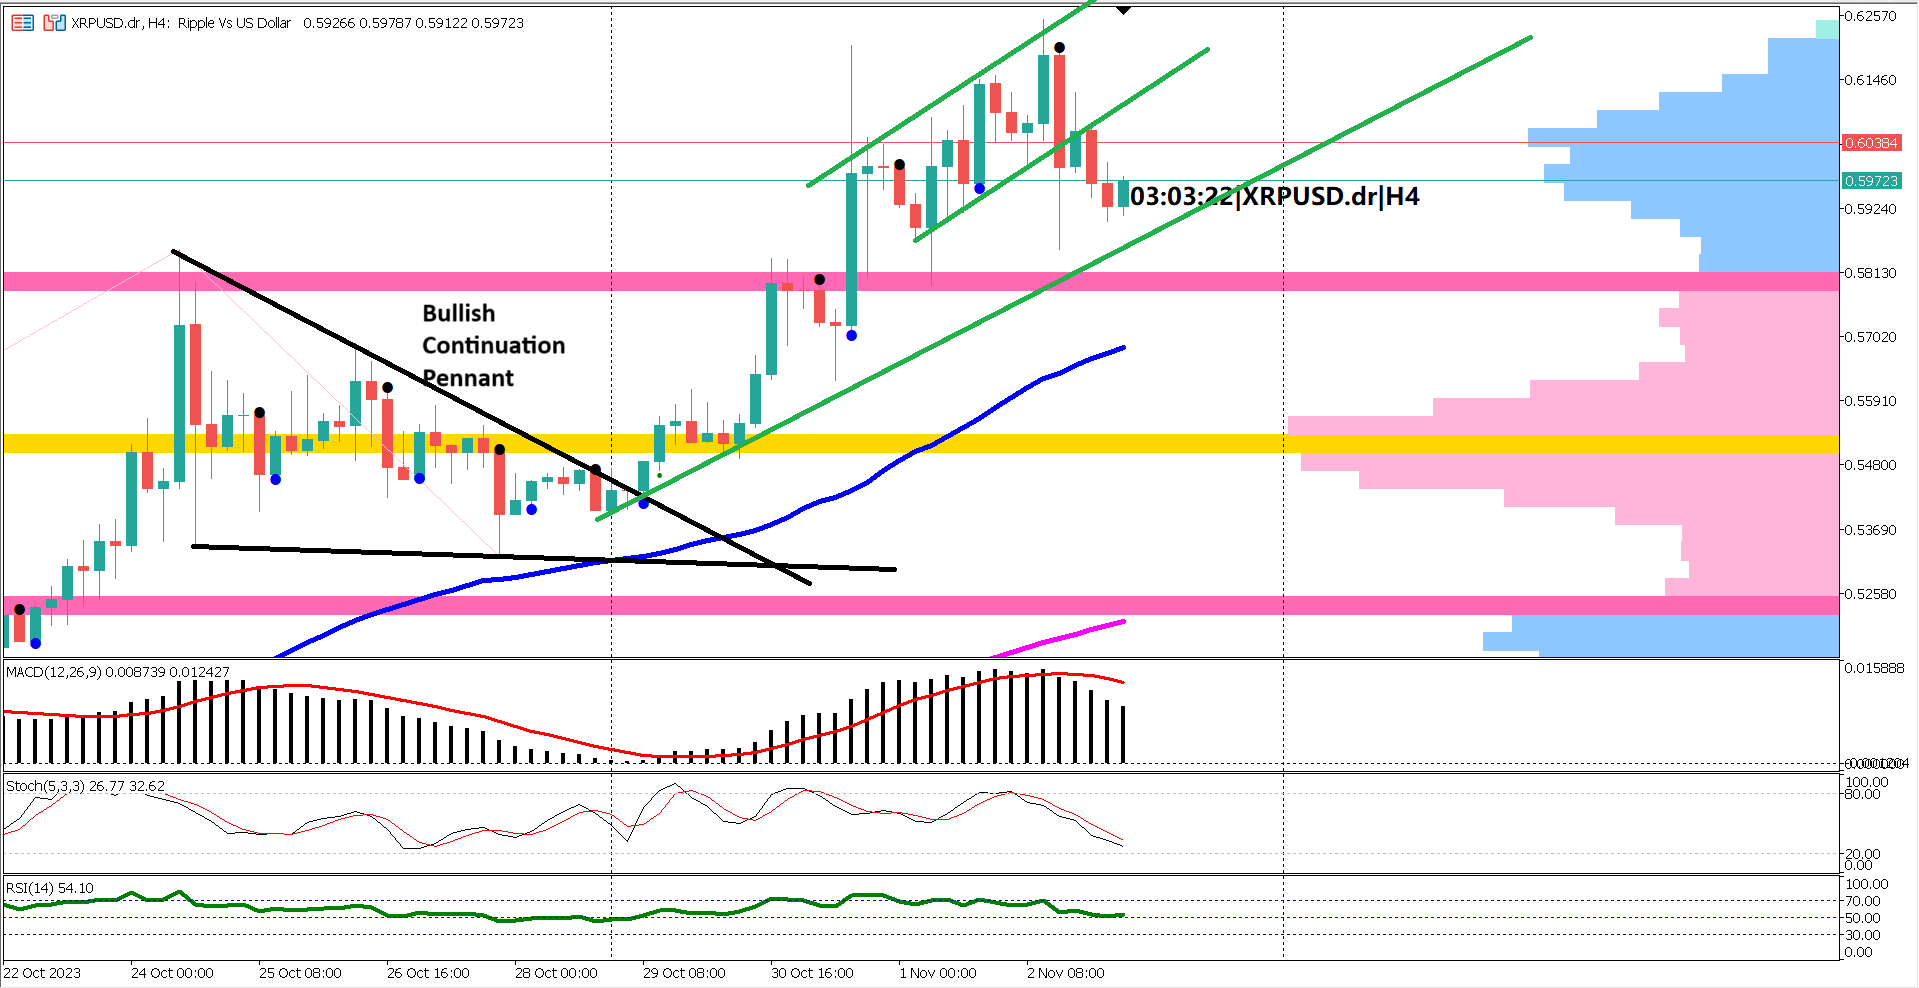
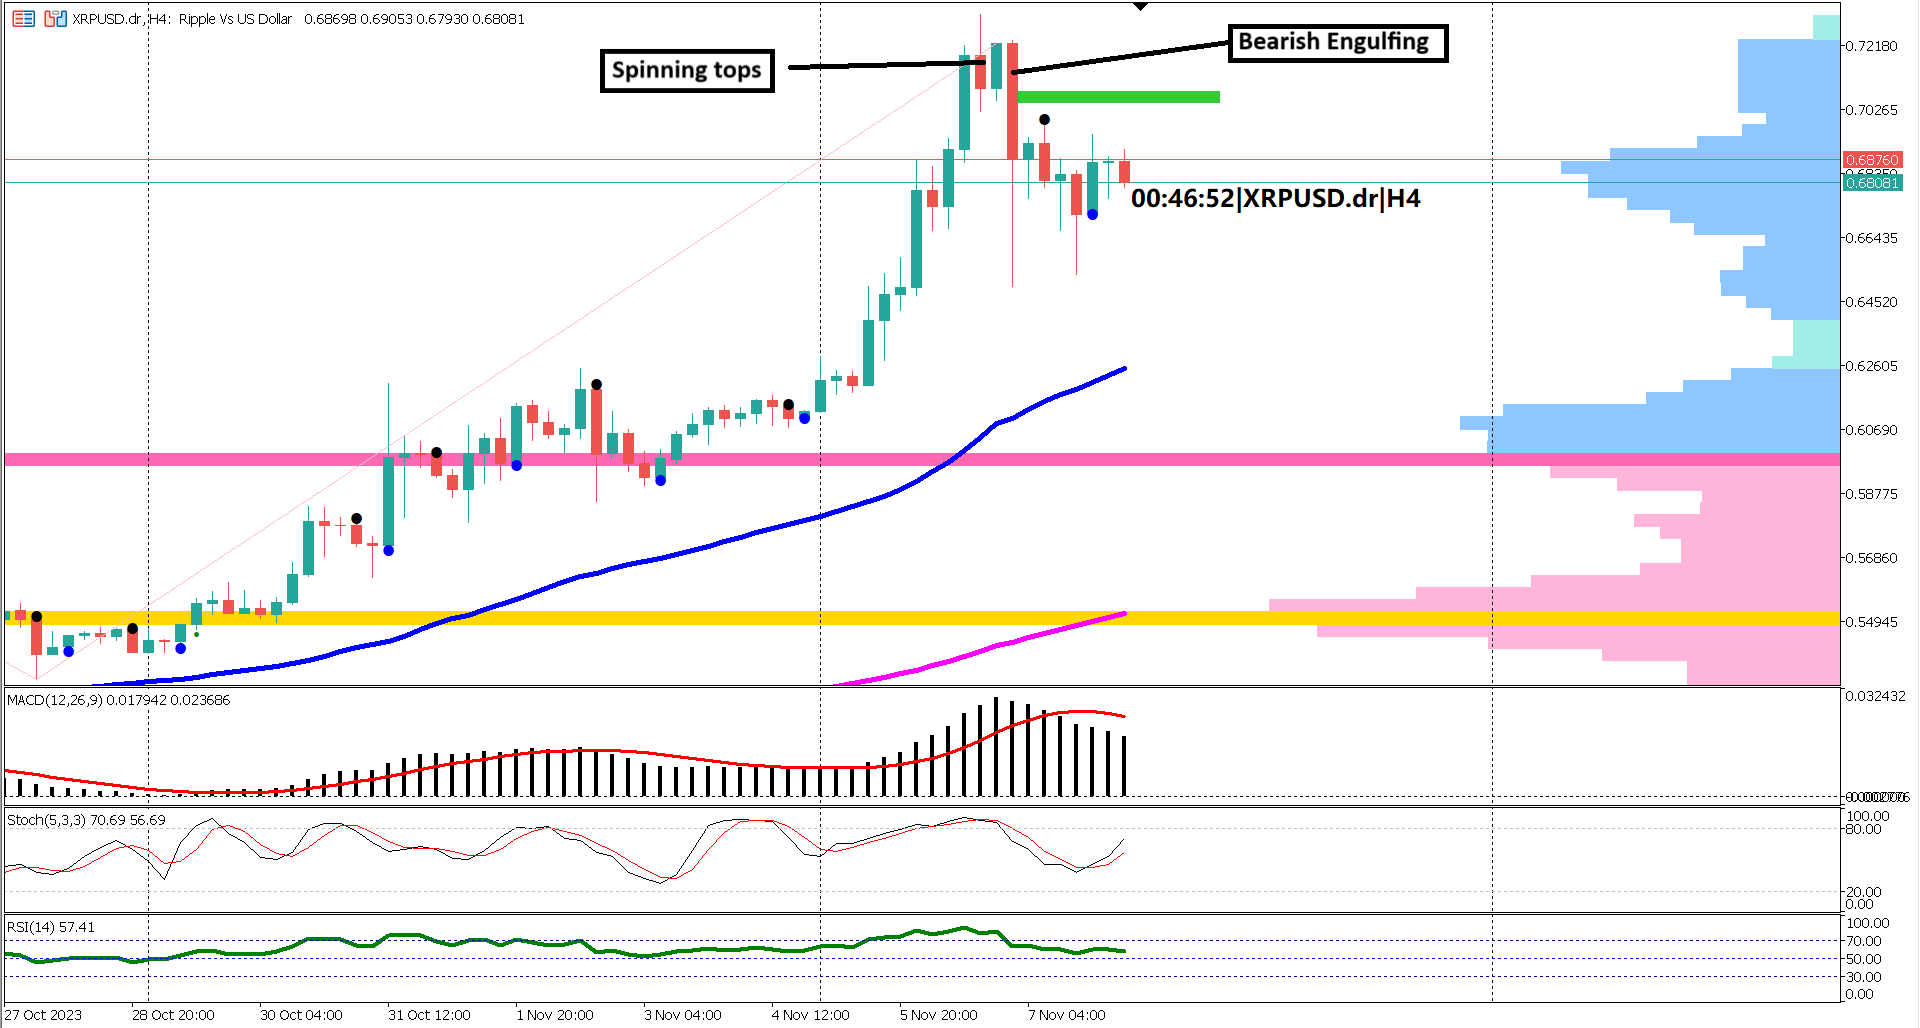
Examining the 4-hour timeframe chart, early November witnessed a break in the bullish continuation pattern, swiftly followed by the breach of the high of the pennant pattern at 0.5800. The market maintained its upward trajectory, reaching its zenith on November 2, 2023, at 0.62505. As the price action exhibited signs of exhaustion, manifested by congested candles forming a tight range channel with an upward slope, a notable development transpired. A large bearish engulfing candle emerged, signaling the commencement of a short-term bearish trend within the broader bullish market—a phenomenon often referred to as a bullish correction.
One of the key levels to monitor is a zone that previously served as resistance and now presents itself as a probable support area at 0.5800.
Turning our attention to the slower-moving indicators, the EMA 50 and EMA 200, the overarching trend remains bullish, denoted by the EMA 50's position above the EMA 200. It is worth noting that the EMA 50 has been endeavoring to catch up with the rapid pace of price movement, currently in a sideway consolidation phase, awaiting alignment with the prevailing trend. Importantly, the EMA 50 holds the potential to act as a short-term key support level, validated by the emergence of a bullish candlestick pattern either near or at the EMA 50.
The Relative Strength Index (RSI) has exhibited a sustained presence above the 40-level benchmark, signifying a robust and healthy bullish trend. Moreover, a prospective buying opportunity is anticipated, particularly if the RSI maintains its position above 40 and a bullish cross materializes in the stochastic oscillator. This would be especially noteworthy if the stochastic crossover occurs while the oscillator is beneath the 50-level threshold, indicating a pullback.
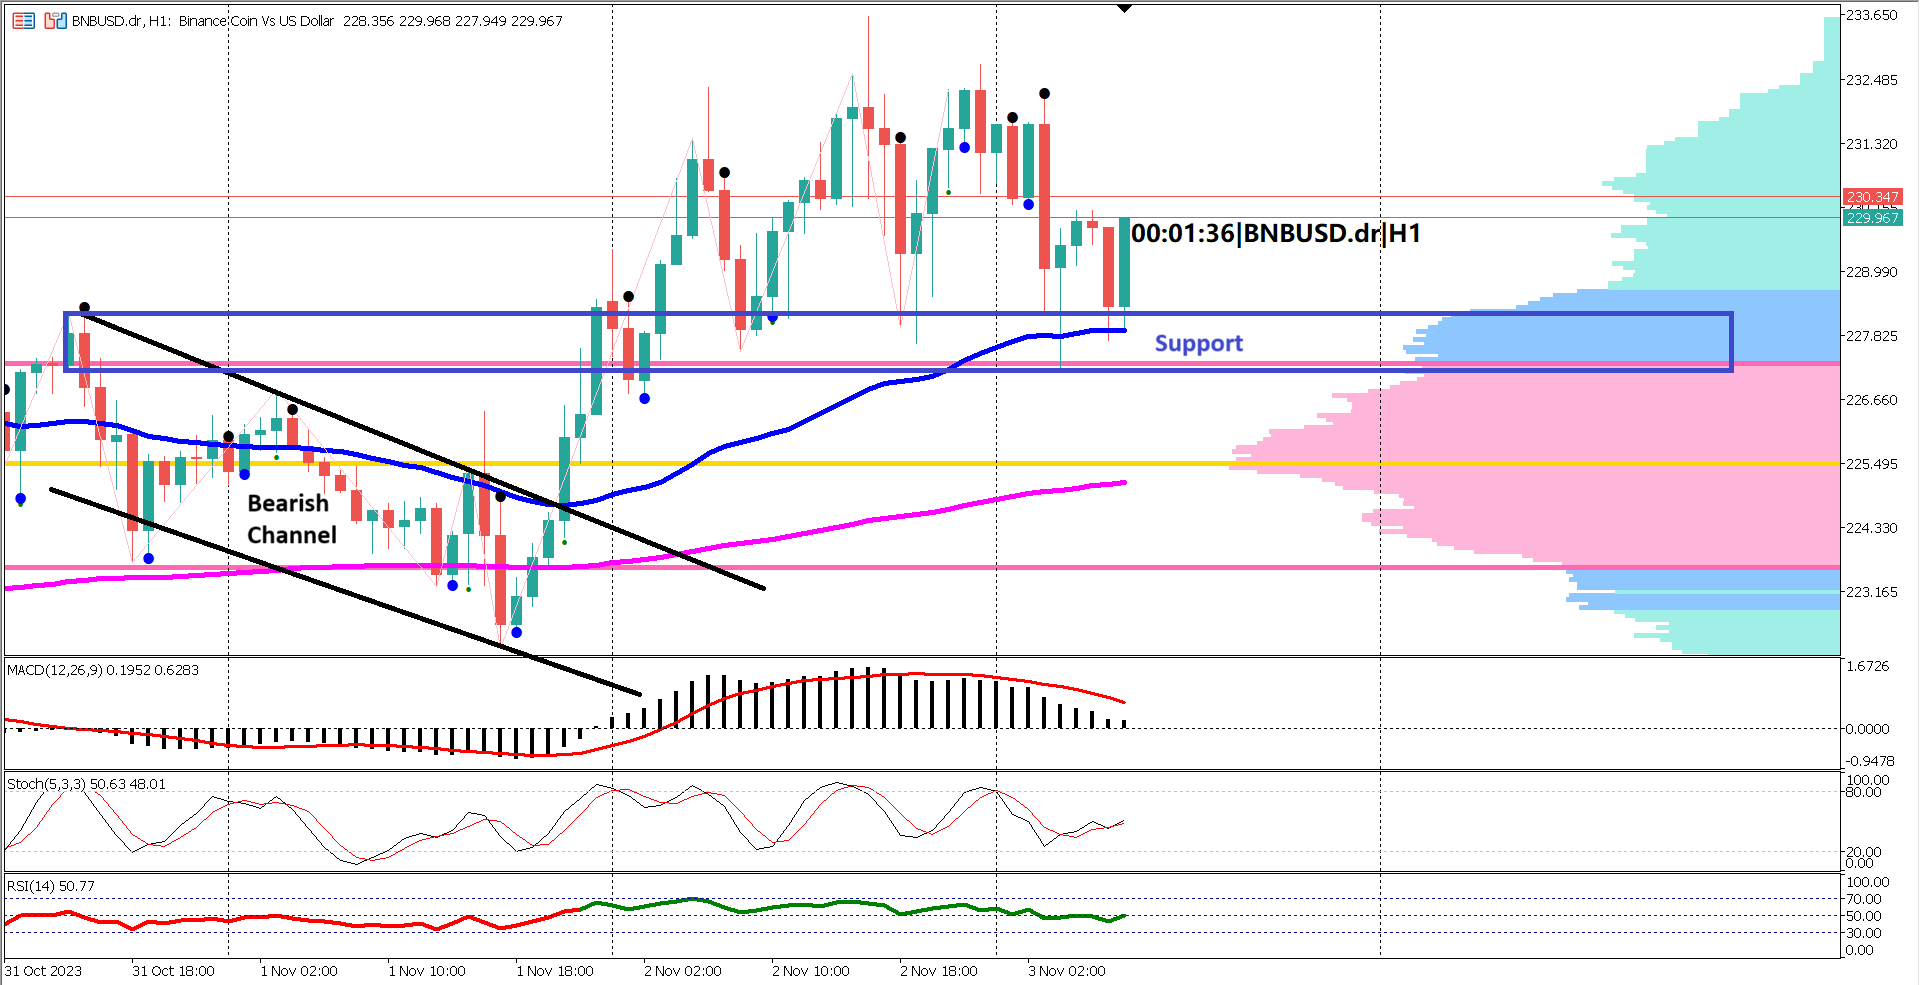
Transitioning to the 1-hour timeframe chart, we observe BNB's recent price action. The cryptocurrency embarked on a bearish trajectory over the last few days, reflecting a short-term bearish phase or a bullish correction. However, a significant shift occurred when the market broke above the upper boundary of the bearish channel during the New York trading session on Wednesday. Subsequently, during Thursday's Asian trading session, the market not only surpassed the high of the bearish channel at 228.54 but continued to register consecutive higher highs and higher lows throughout the Thursday trading session.
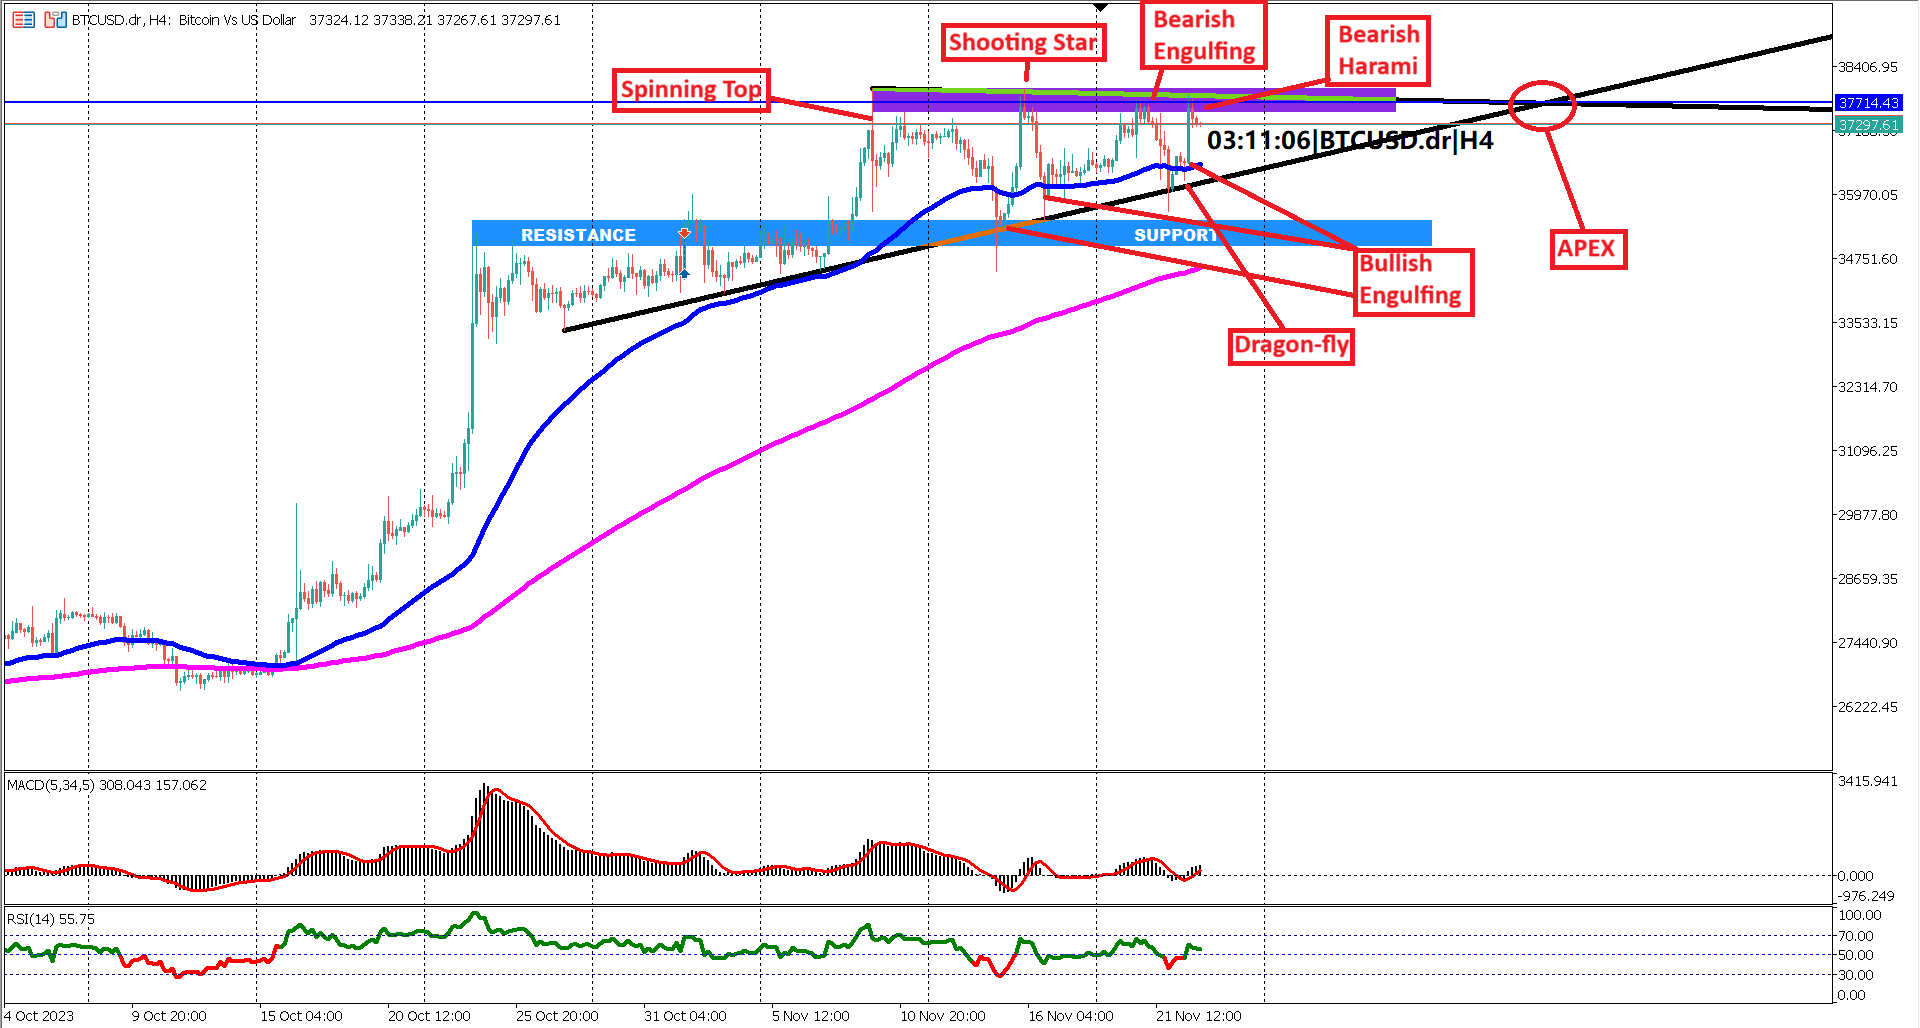
This bullish rally demonstrated signs of exhaustion, notably marked by the emergence of spinning top candlestick patterns at the peak of the uptrend. Consequently, a sharp correction ensued, propelling prices toward the EMA 50, a common level for retracement in bullish trends.
In consonance with the EMA indicators, specifically the EMA 50 and EMA 200, the prevailing trend remains decidedly bullish, as reflected in the EMA 50's position above the EMA 200. The price retracement encountered support at the EMA 50, signified by the emergence of a bullish engulfing candlestick. This event is a compelling indicator of the bullish trend's continued momentum.
The RSI has consistently held above the 40-level threshold since Thursday. This persistence of the RSI above 40 affirms the underlying strength and health of the bullish trend. Investors are encouraged by the potential for a bullish crossover in the stochastic oscillator, particularly when such a crossover unfolds with the oscillator positioned below the 50-level mark. This confluence suggests an attractive opportunity for traders to consider long
Forecast 0.3% vs Previous 0.2%
Forecast 3.8% vs Previous 3.8%
Forecast 180K vs Previous 336K

Trading foreign exchange on margin carries a high level of risk, and may not be suitable for all investors. Before deciding to trade foreign exchange you should carefully consider your investment objectives, level of experience, and risk appetite.
Nothing contained in this website should be construed as investment advice. Any reference to an investment's past or potential performance is not, and should not be construed as, a recommendation or as a guarantee of any specific outcome or profit.