
In the fast-paced realm of financial markets, the SP500, a benchmark index, has navigated a rollercoaster of movements over the past week. A decline spanning six consecutive trading days set the stage for a remarkable turnaround during Friday's New York trading session.
The trigger for this abrupt shift was the release of the Non-Farm Payroll (NFP) data, coupled with a lower unemployment rate. The market responded emphatically to the positive economic indicators, propelling the index into a strong bullish bounce. However, this upward surge encountered a formidable hurdle at the 4719 level, serving as immediate resistance.
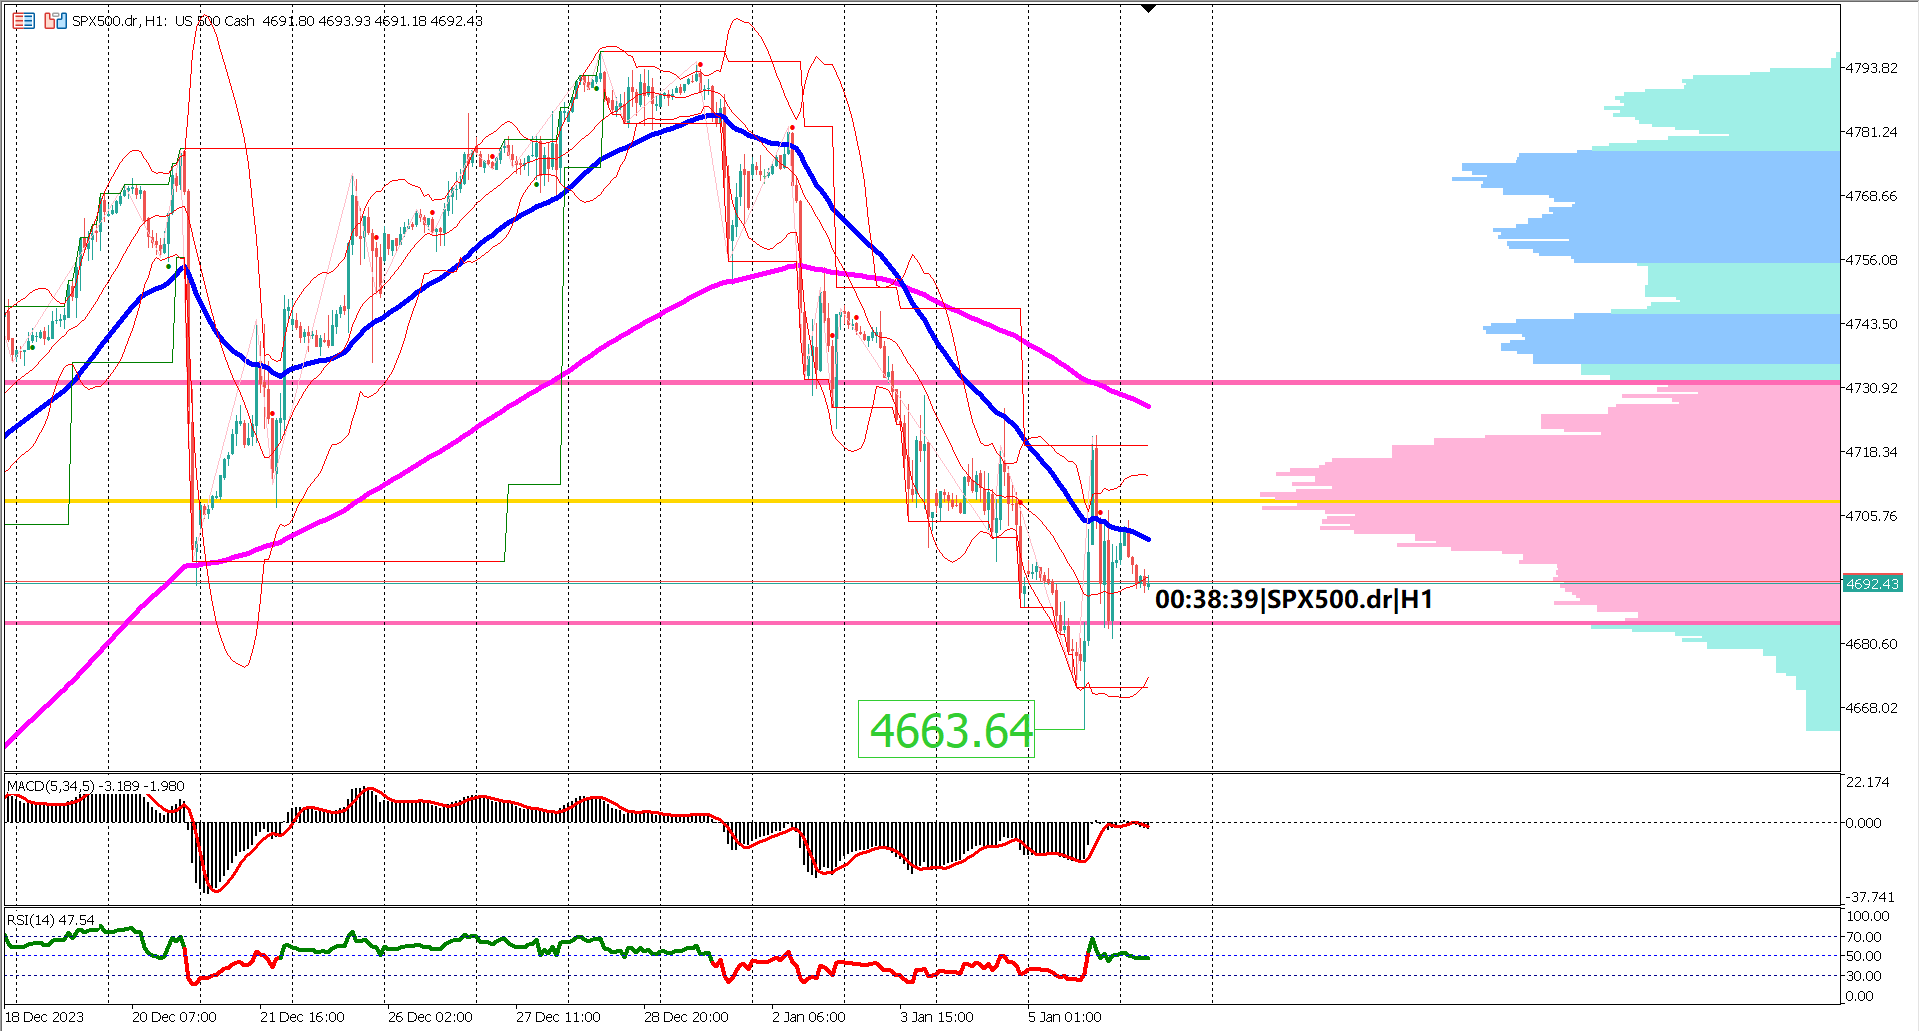
Amid the excitement of the rebound, market participants are cautiously considering the possibility of a 'dead cat bounce.' To confirm this notion, the SP500 would need to breach the recent swing low at 4663, indicating a resurgence of bearish momentum.
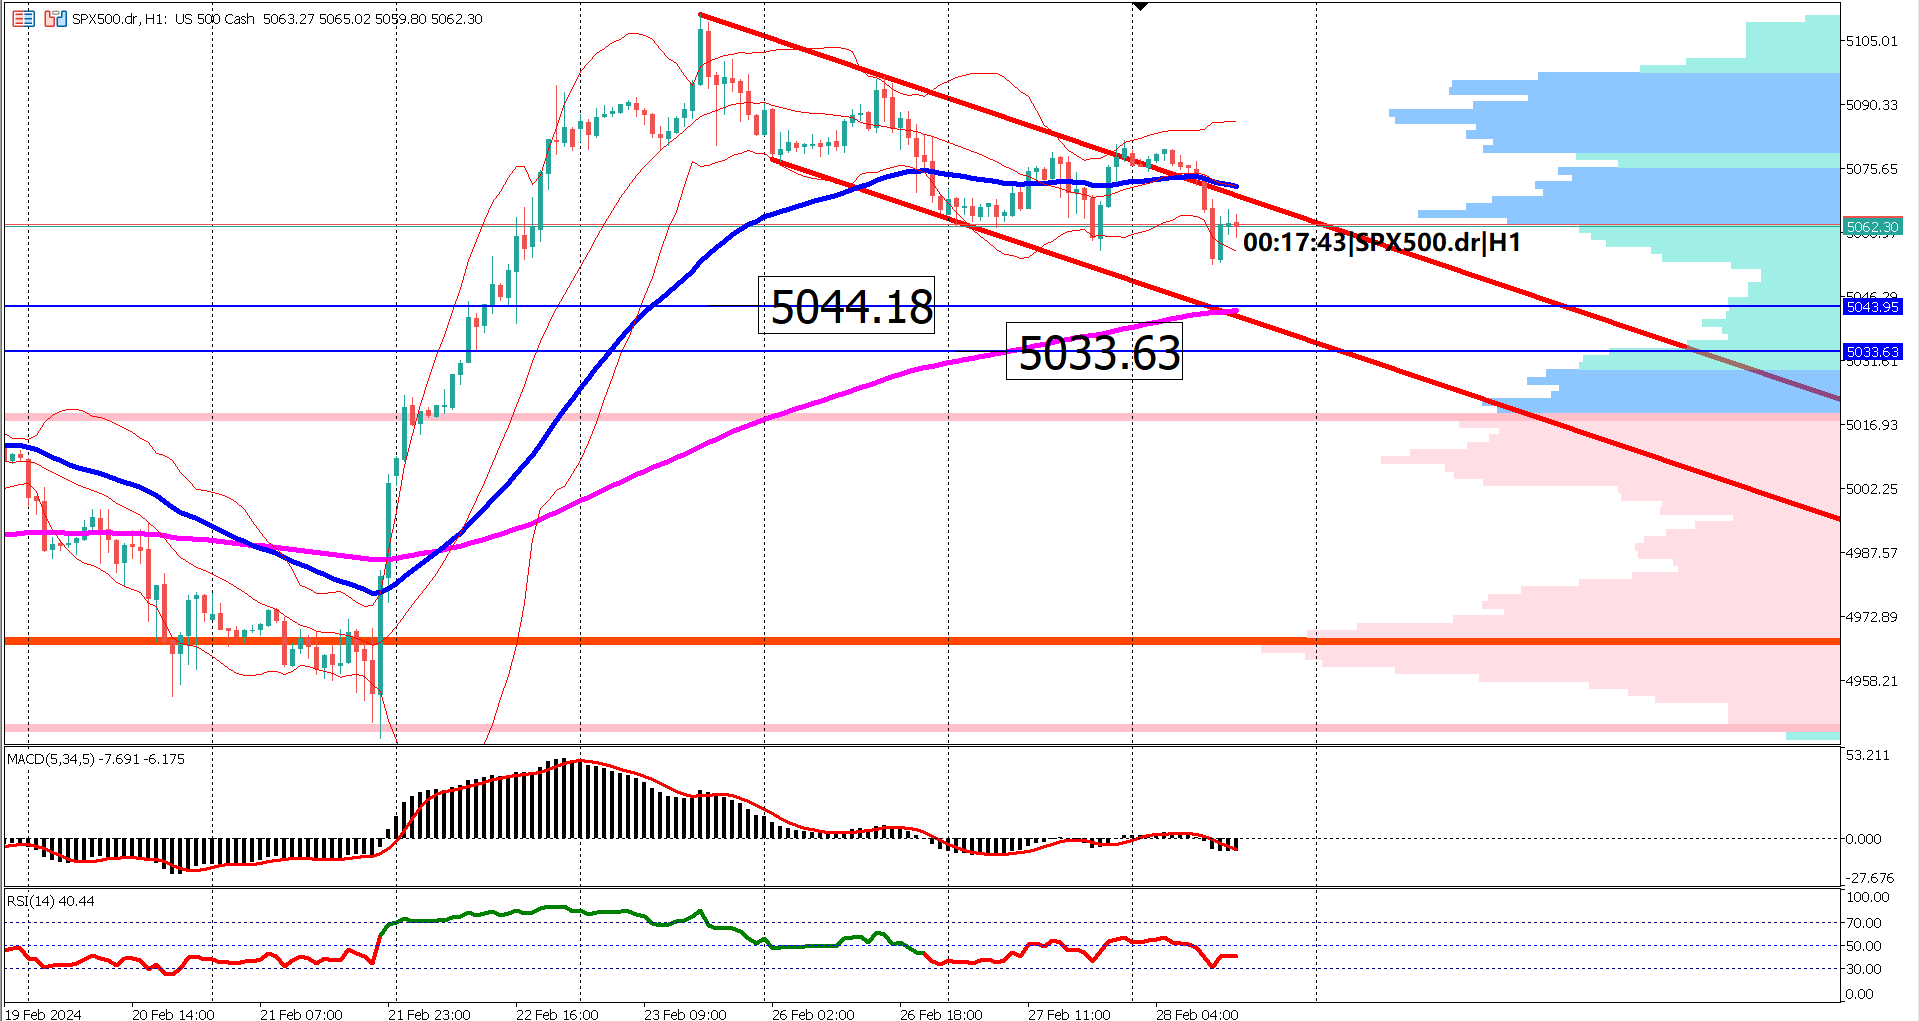
Delving into the technical analysis on the 1-hour timeframe reveals key insights. The Exponential Moving Averages (EMA) 200 and 50 present a picture of persistent bearish momentum, with both lines pointing downwards. The convergence of EMA 50 towards EMA 200, if it occurs, would signal a potential weakening of the prevailing bearish trend.
A glance at the Bollinger Bands postulates an intriguing narrative. Following a prolonged decline lasting five days, prices managed to briefly breach above the upper band, finding support at the middle of the band. The critical juncture lies in the confirmation of this support or its failure, marked by a decisive move either above the upper band or below the lower band.
The Volume Profile indicator reflects a market in a state of neutrality, having surpassed the midpoint of the value area. Breaking above the upper side of the value area could herald a bullish reversal, while a breach in the opposite direction may signify a continuation of the bearish trend, thus substantiating the dead cat bounce scenario.
The MACD indicator adds another layer to the analysis, indicating a neutral trend after an extended bearish phase. The histogram and signal line hovering around the zero level signify a state of equilibrium, awaiting a decisive shift in market sentiment.
The RSI indicator, having breached the 60% level since the NFP news, showcases bullish resilience. The RSI's coiling at the 50% level has prevented a dip below 40%, suggesting that the bullish momentum is robust. A break below 40% could signal a further weakening of the SP500.
In conclusion, the SP500's major trend remains bearish, with a minor bullish trend creating an overall neutral landscape. Traders and investors keenly await signals from these key indicators, as any shift towards a bullish reversal would significantly impact market dynamics. Caution is the watchword in these uncertain times, with the market poised for potential twists and turns based on future developments.

Trading foreign exchange on margin carries a high level of risk, and may not be suitable for all investors. Before deciding to trade foreign exchange you should carefully consider your investment objectives, level of experience, and risk appetite.
Nothing contained in this website should be construed as investment advice. Any reference to an investment's past or potential performance is not, and should not be construed as, a recommendation or as a guarantee of any specific outcome or profit.