
Amidst anticipation of the US GDP news release, the SP500 is under scrutiny, with economists forecasting a 3.3% growth in the 2023 Q4 GDP. This vital economic indicator serves as a barometer of economic health, potentially impacting the SP500. A favorable GDP outcome could bolster the US economy, thus appreciating the SP500.
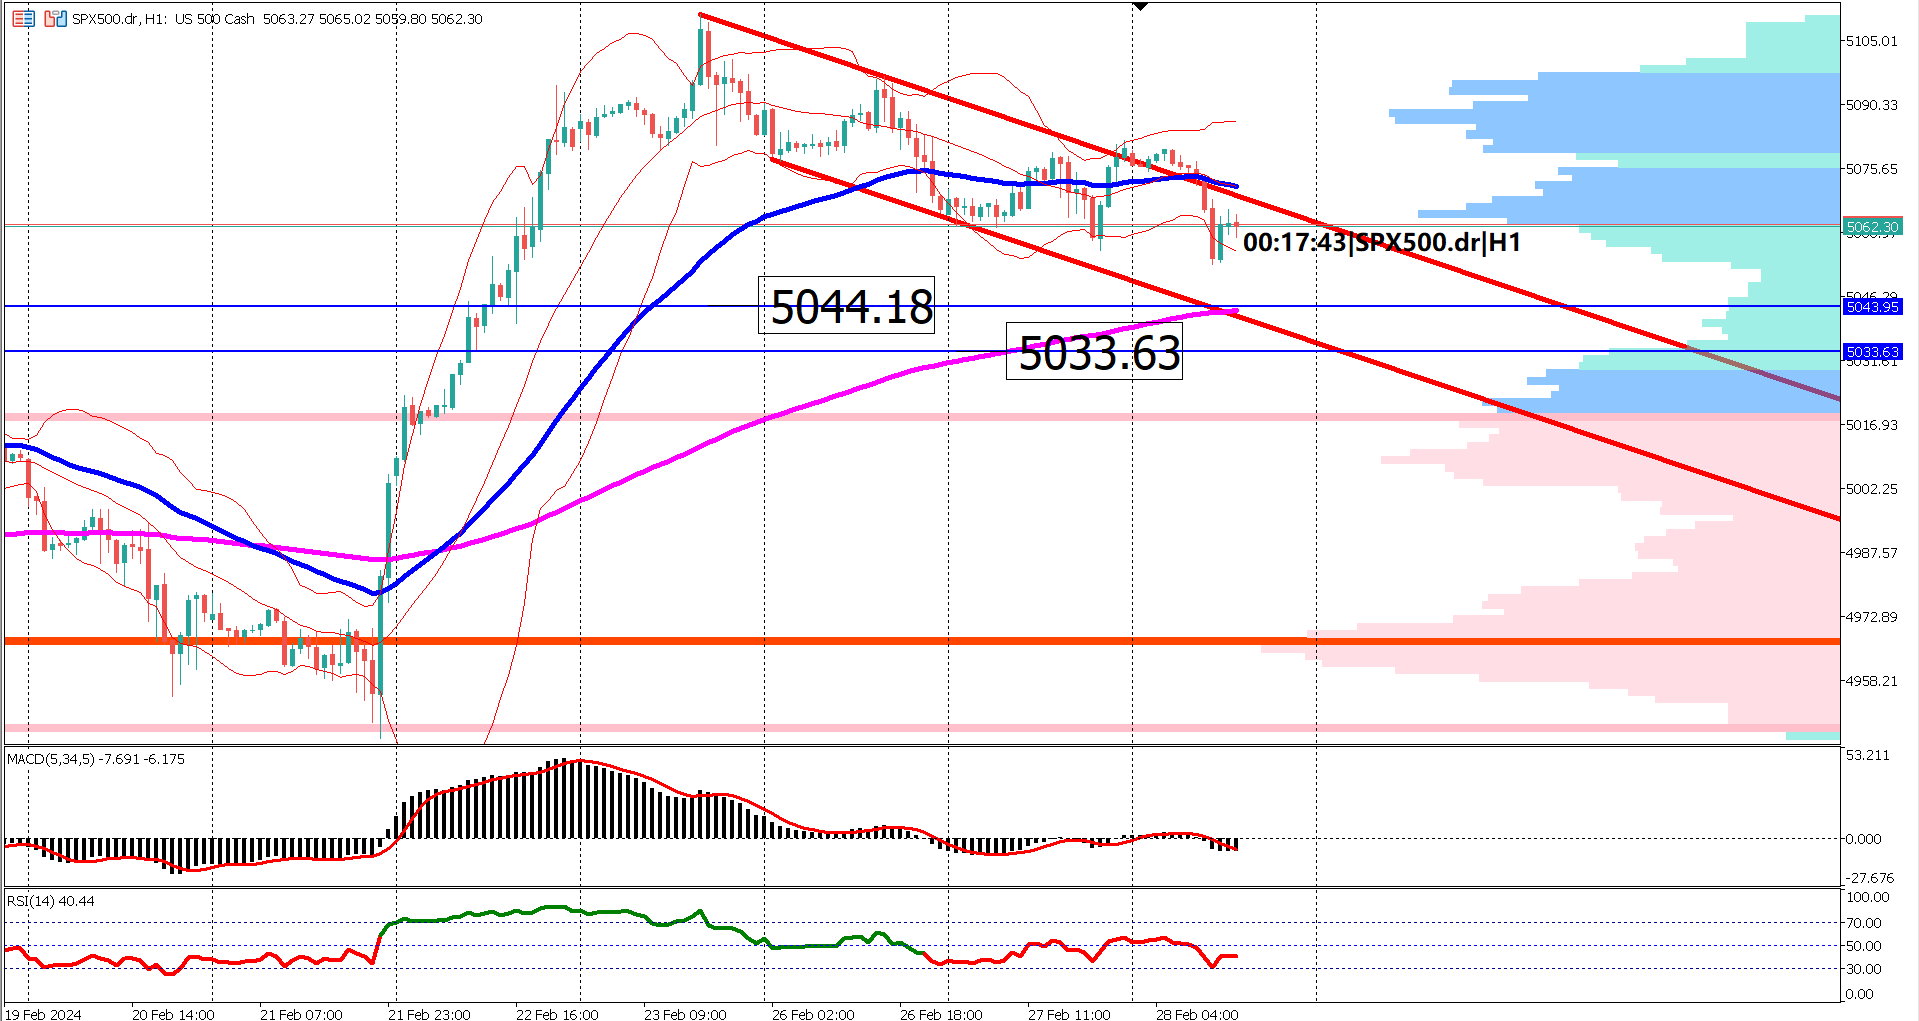
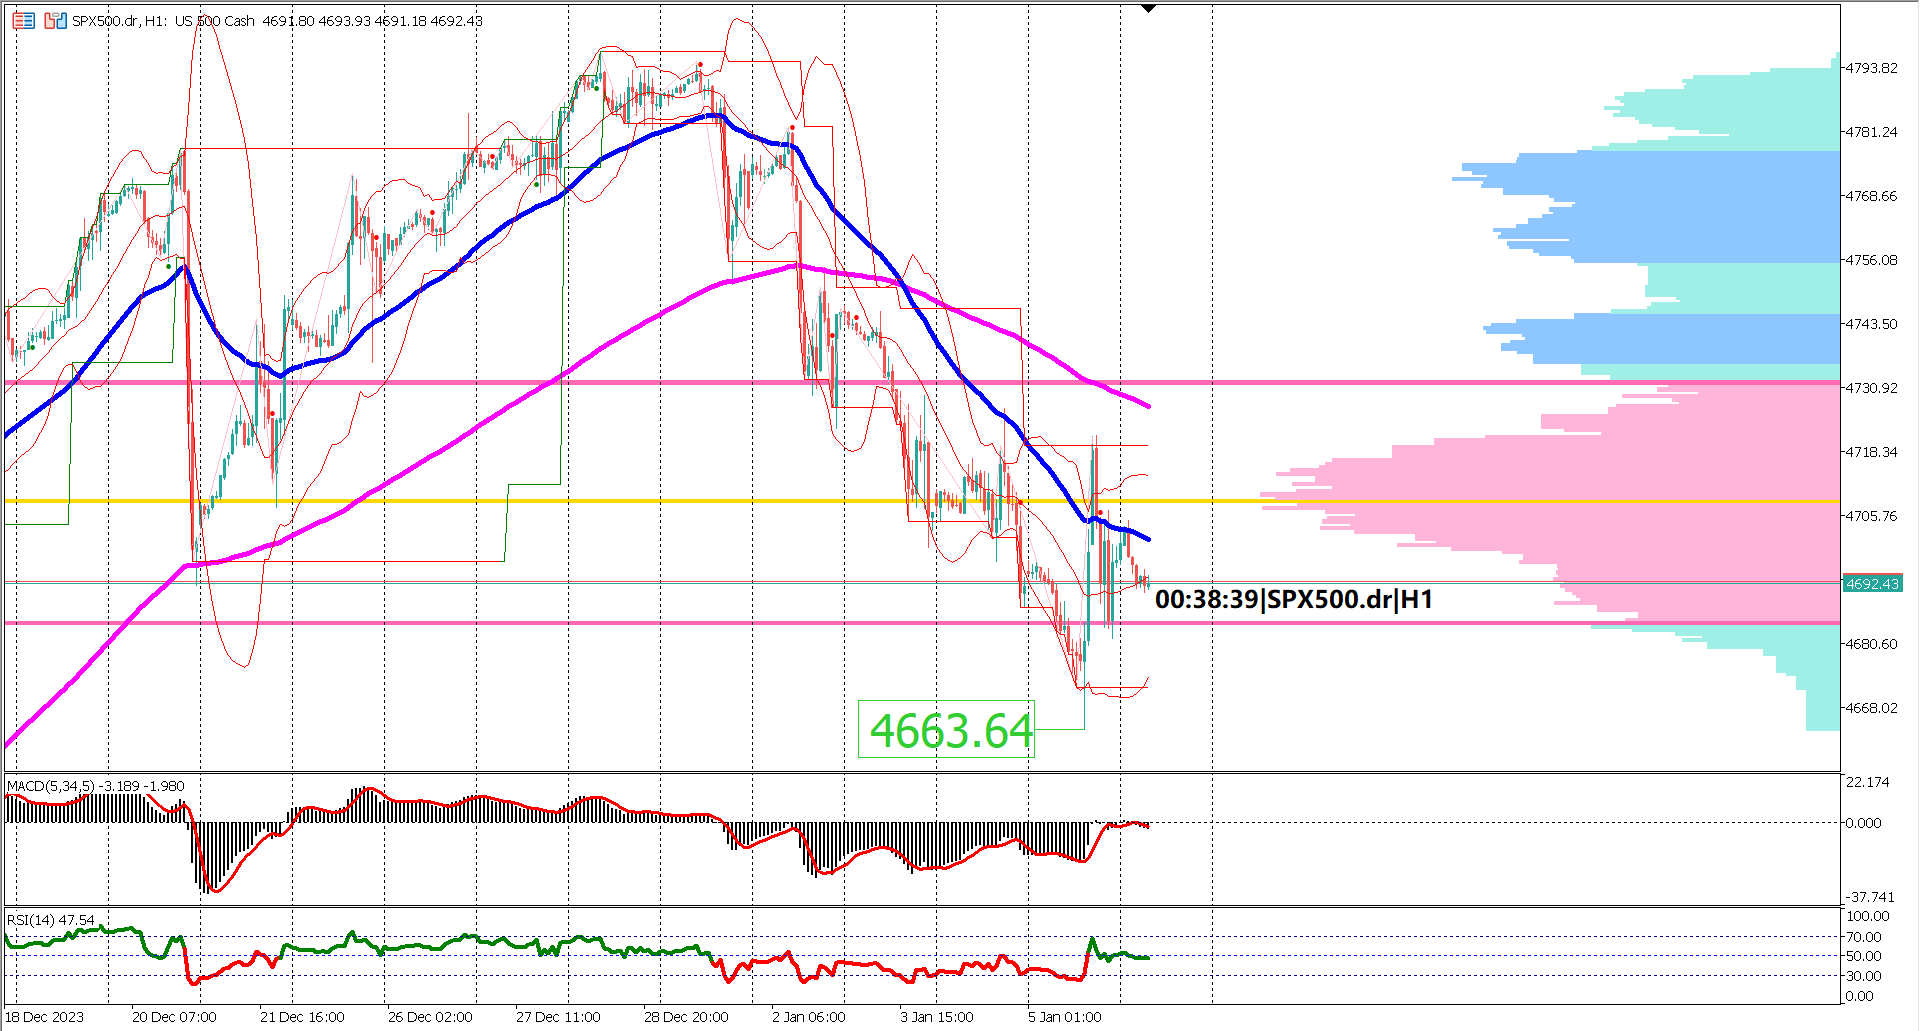
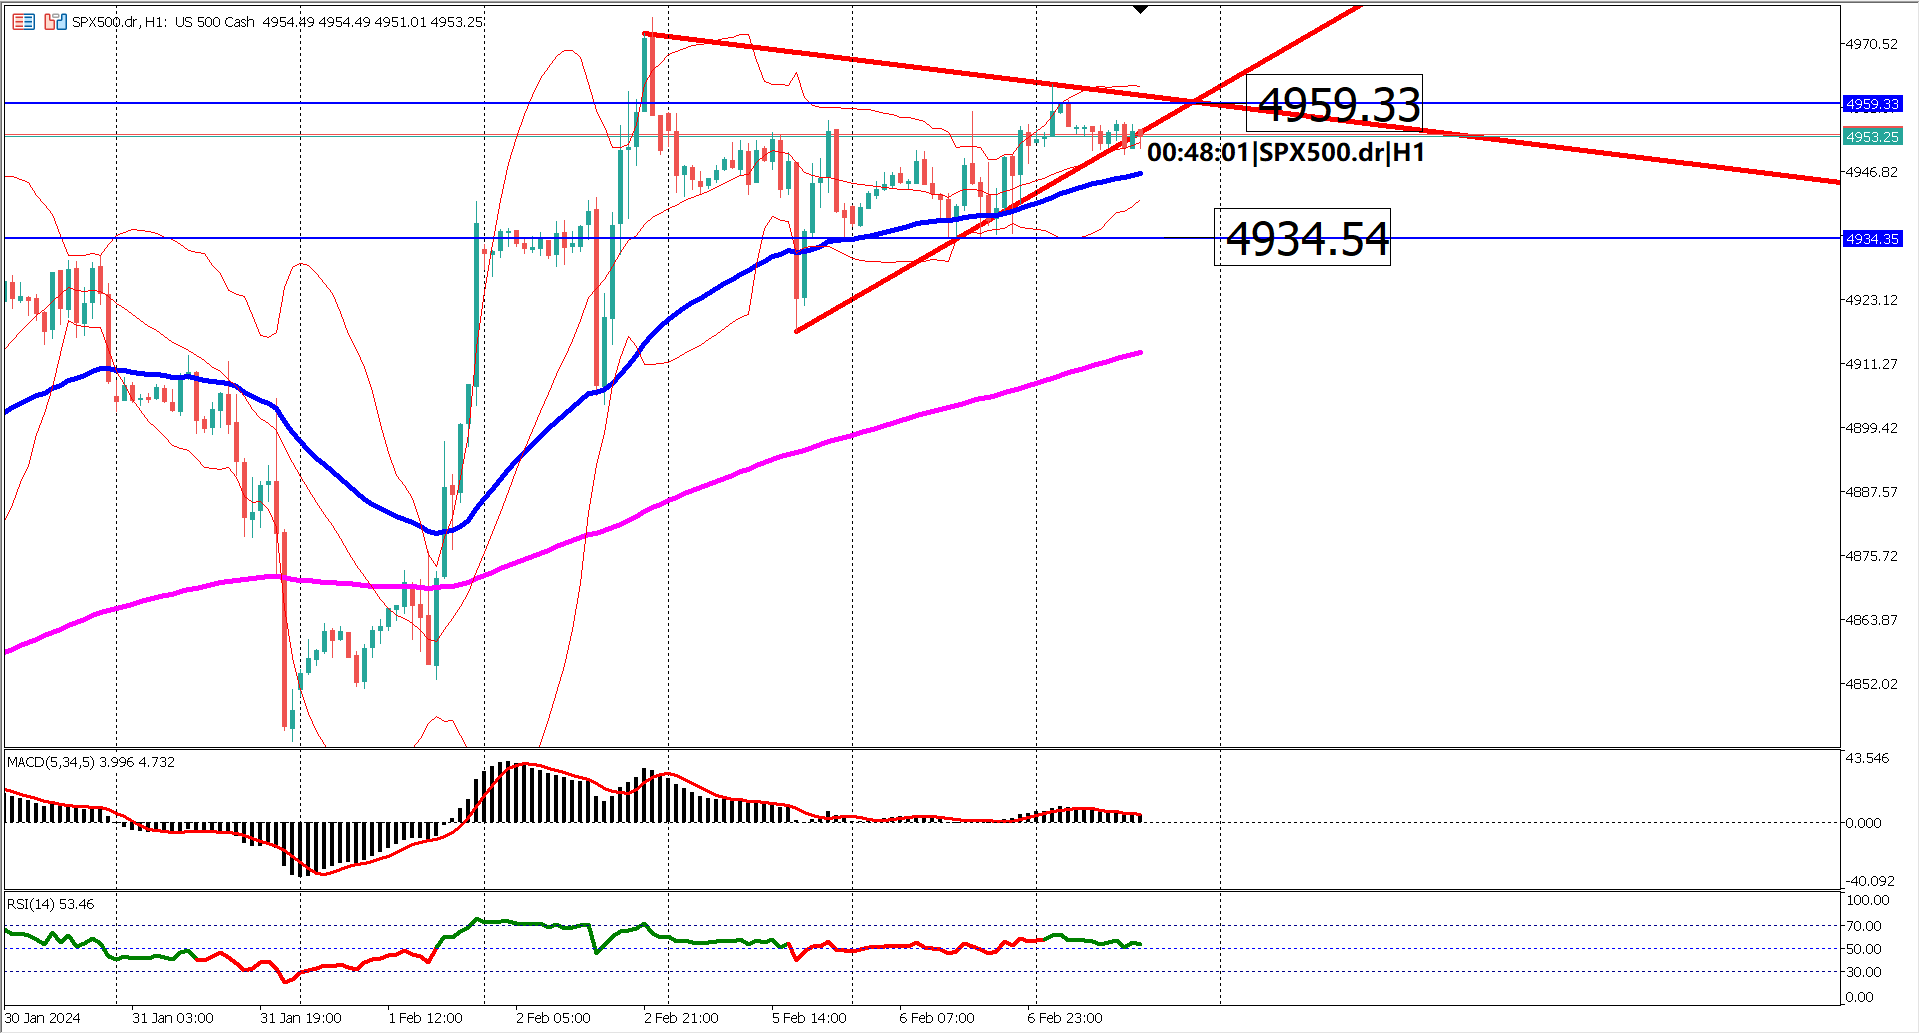
Over the past three trading days, the SP500 has exhibited a slight bearish trend, shaping a descending trend channel. However, there hasn't been a significant breakout from this channel yet. Key support levels lie within the range of 5033-5052, marked by the presence of two bullish engulfing candlesticks. A breach below the lowest bullish engulfing candlestick's low around 5033 may signal intensified bearish pressure.
Observing the moving averages, the EMA 50 is gradually converging towards the EMA 200, narrowing the gap between them. This convergence suggests a slowdown in bullish momentum. Notably, the EMA 200, positioned between 5033-5052, serves as a critical support level.
Turning to oscillator indicators, both the MACD and RSI indicate a bearish trend. The MACD signal line remains below the 0 trend line, while the RSI struggles to surpass the 60% threshold. Despite over 40 trading hours, neither indicator has reversed to a bullish stance.
In summary, the SP500 is currently navigating a sideways trend. However, the impending US GDP release has the potential to inject volatility and trigger a breakout, shaping the index's trajectory. Traders should closely monitor key support levels and anticipate market reactions to the economic data.
Anticipation Surrounding US GDP: Market attention is focused on the US GDP news release, with economists forecasting a 3.3% growth in the 2023 Q4 GDP. This key economic indicator is pivotal for gauging the health of the US economy and could influence SP500 movements.
Descending Trend Channel: Over the past three trading days, the SP500 has shown a slight bearish inclination, forming a descending trend channel. Despite this, there hasn't been a notable breakout from the channel, indicating a consolidation phase.
Critical Support Levels: Key support zones are identified in the range of 5033-5052, marked by the presence of two bullish engulfing candlesticks. A breach below the lowest candlestick's low at around 5033 may signal heightened bearish pressure, potentially leading to further downside movement.
Convergence of Moving Averages: The convergence of the EMA 50 towards the EMA 200 suggests a slowdown in bullish momentum. Notably, the EMA 200, situated between 5033-5052, acts as a significant support level, reinforcing its importance in determining market sentiment.
Bearish Signals from Oscillator Indicators: Both the MACD and RSI indicate a bearish trend, with the MACD signal line below the 0 trend line and the RSI struggling to surpass the 60% threshold. Despite prolonged trading hours, neither indicator has shown signs of reversing to a bullish stance, underscoring prevailing bearish sentiment.
Forecast 3.3% vs Previous 3.3%

Trading foreign exchange on margin carries a high level of risk, and may not be suitable for all investors. Before deciding to trade foreign exchange you should carefully consider your investment objectives, level of experience, and risk appetite.
Nothing contained in this website should be construed as investment advice. Any reference to an investment's past or potential performance is not, and should not be construed as, a recommendation or as a guarantee of any specific outcome or profit.