
In the past two trading days, GBP bulls have exhibited strength, propelling GBPUSD by approximately 116 pips. However, the recent market dynamics reveal a nuanced picture, with a sell-off during the London trading session yesterday, albeit mitigated during the New York trading session.
Today, the focus of market participants is on several key economic releases from the US, particularly the Non-Farm Payroll (NFP) and Unemployment Rate data. Forecasts indicate a potential softening in both metrics, with NFP expected at 170K (versus the previous 199K) and an Unemployment Rate of 3.8% (versus the previous 3.7%). The outcome of these releases could significantly impact GBPUSD.
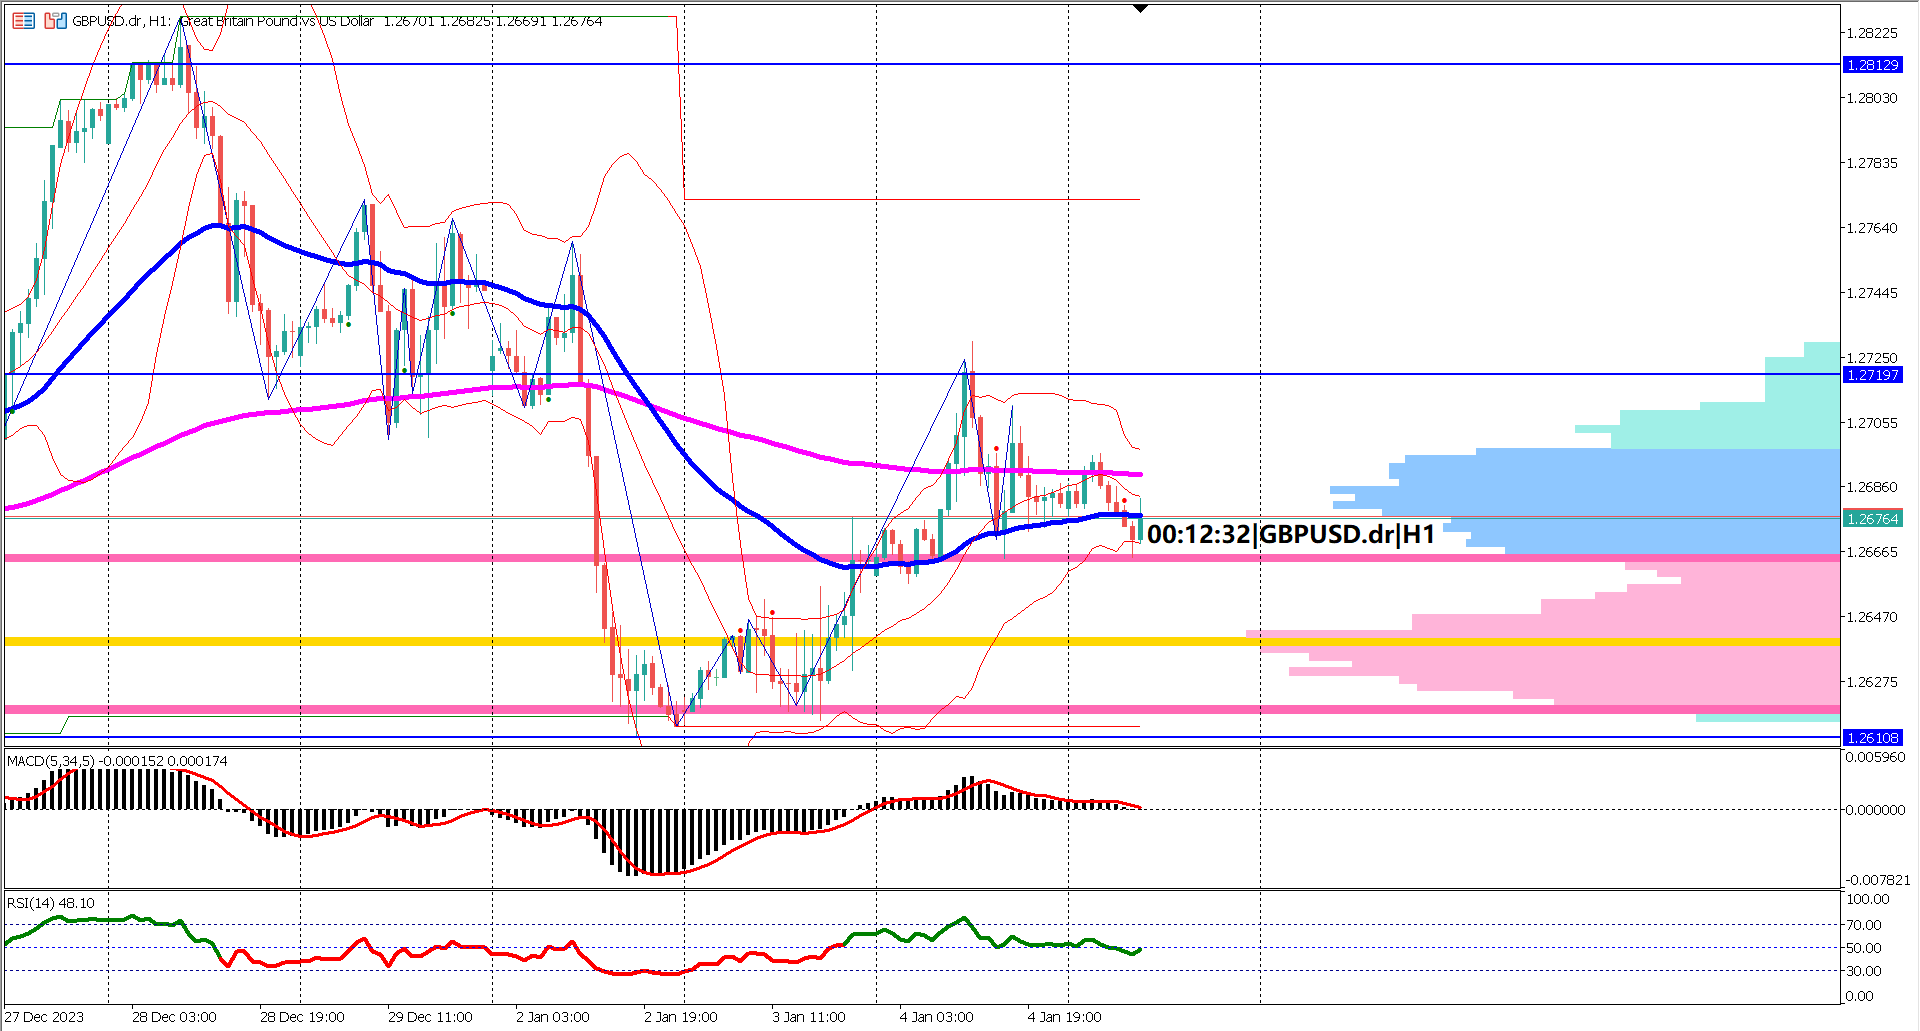
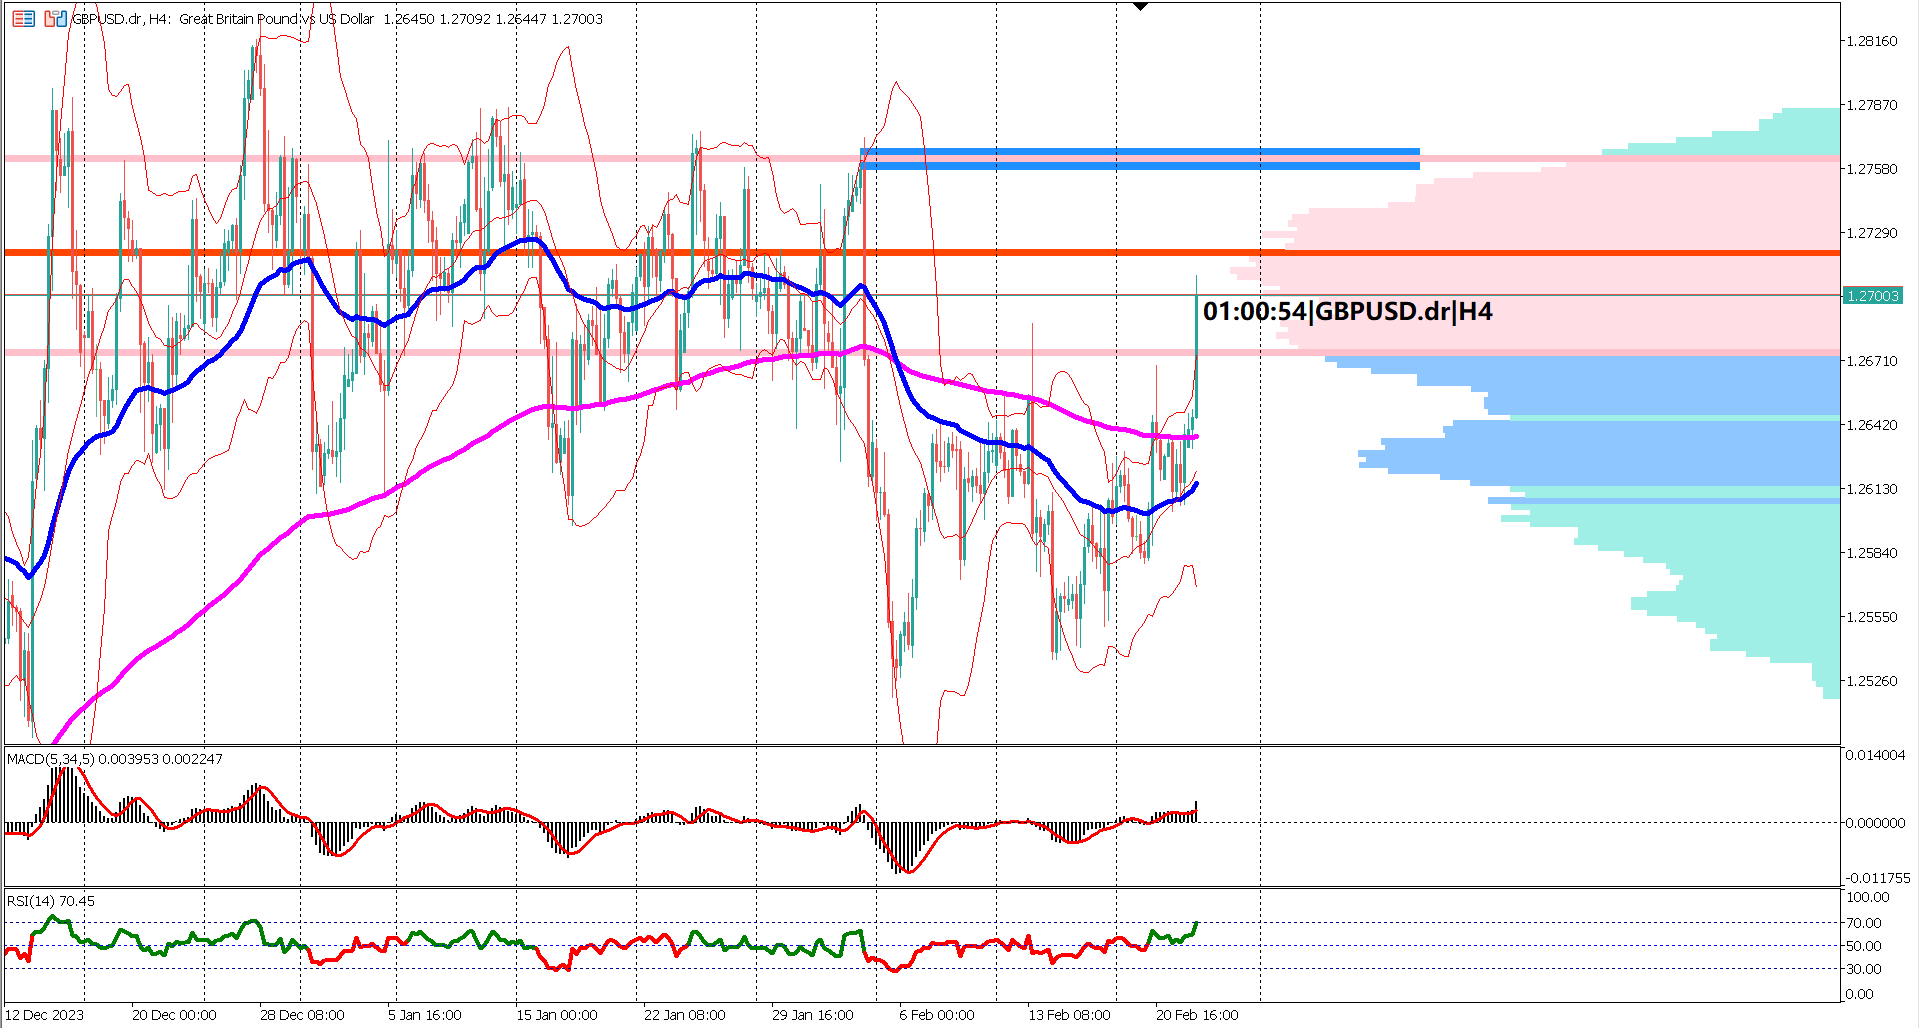
In the event of mixed results, aggressive buying action on GBPUSD may ensue, leading to a potential breakout of the red-colored descending trendline and a breach of a crucial resistance level at 1.2719 (blue horizontal line). Conversely, meeting the expected outcomes may increase selling pressure, potentially driving GBPUSD towards the recent swing low at 1.2614.
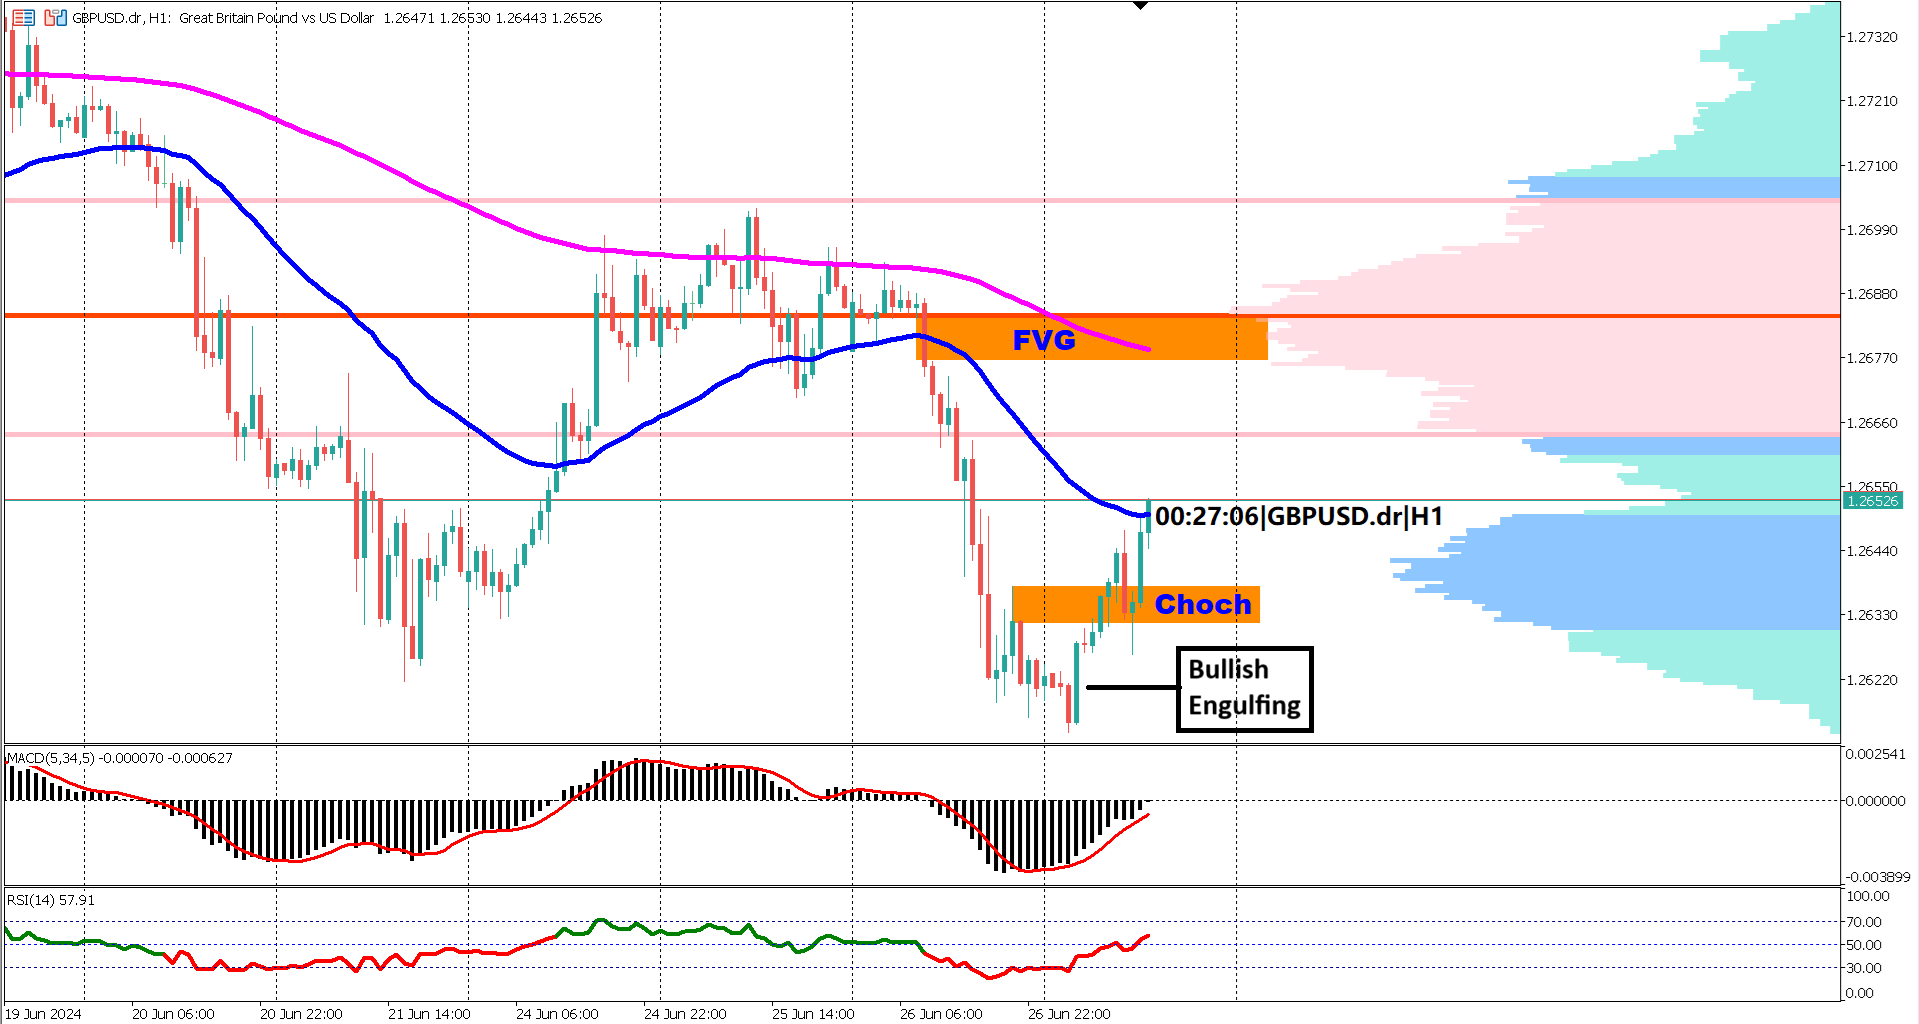
Examining the EMA 50 & 200, the major trend is currently bearish, with EMA 50 positioned below EMA 200. However, the diminishing distance between these two indicators suggests a waning bearish momentum. If this narrowing persists, it might prompt a golden cross, a signal for a major bullish reversal.
The Bollinger band indicator indicates a contracting market, signifying a sideways movement and low volatility. This aligns with the anticipation before the release of high-impact economic news.
The volume profile indicator highlights the significance of the lower section of its value area (pink horizontal lines) at 1.2618 as a key support level. A break below this level could trigger a sell-off, while maintaining a position above the upper side of the value area may stimulate bullish enthusiasm.
Analyzing the oscillator indicators, the MACD histogram and signal line exhibit a slow decline towards or below the 0 line, indicating a neutral or sideways trend. The RSI lingers around the 50% level, with a break above 60% signaling a bullish sentiment and below 40% signaling a bearish sentiment.
In summary, the GBPUSD market is currently characterized by a sideways trend, as indicated by the Bollinger band, MACD, and RSI. A potential breakout above the key resistance level and descending trendline, combined with the RSI breaking above 60%, could activate a more aggressive bullish stance, especially in the context of mixed outcomes from the US key economic news releases today.

Trading foreign exchange on margin carries a high level of risk, and may not be suitable for all investors. Before deciding to trade foreign exchange you should carefully consider your investment objectives, level of experience, and risk appetite.
Nothing contained in this website should be construed as investment advice. Any reference to an investment's past or potential performance is not, and should not be construed as, a recommendation or as a guarantee of any specific outcome or profit.