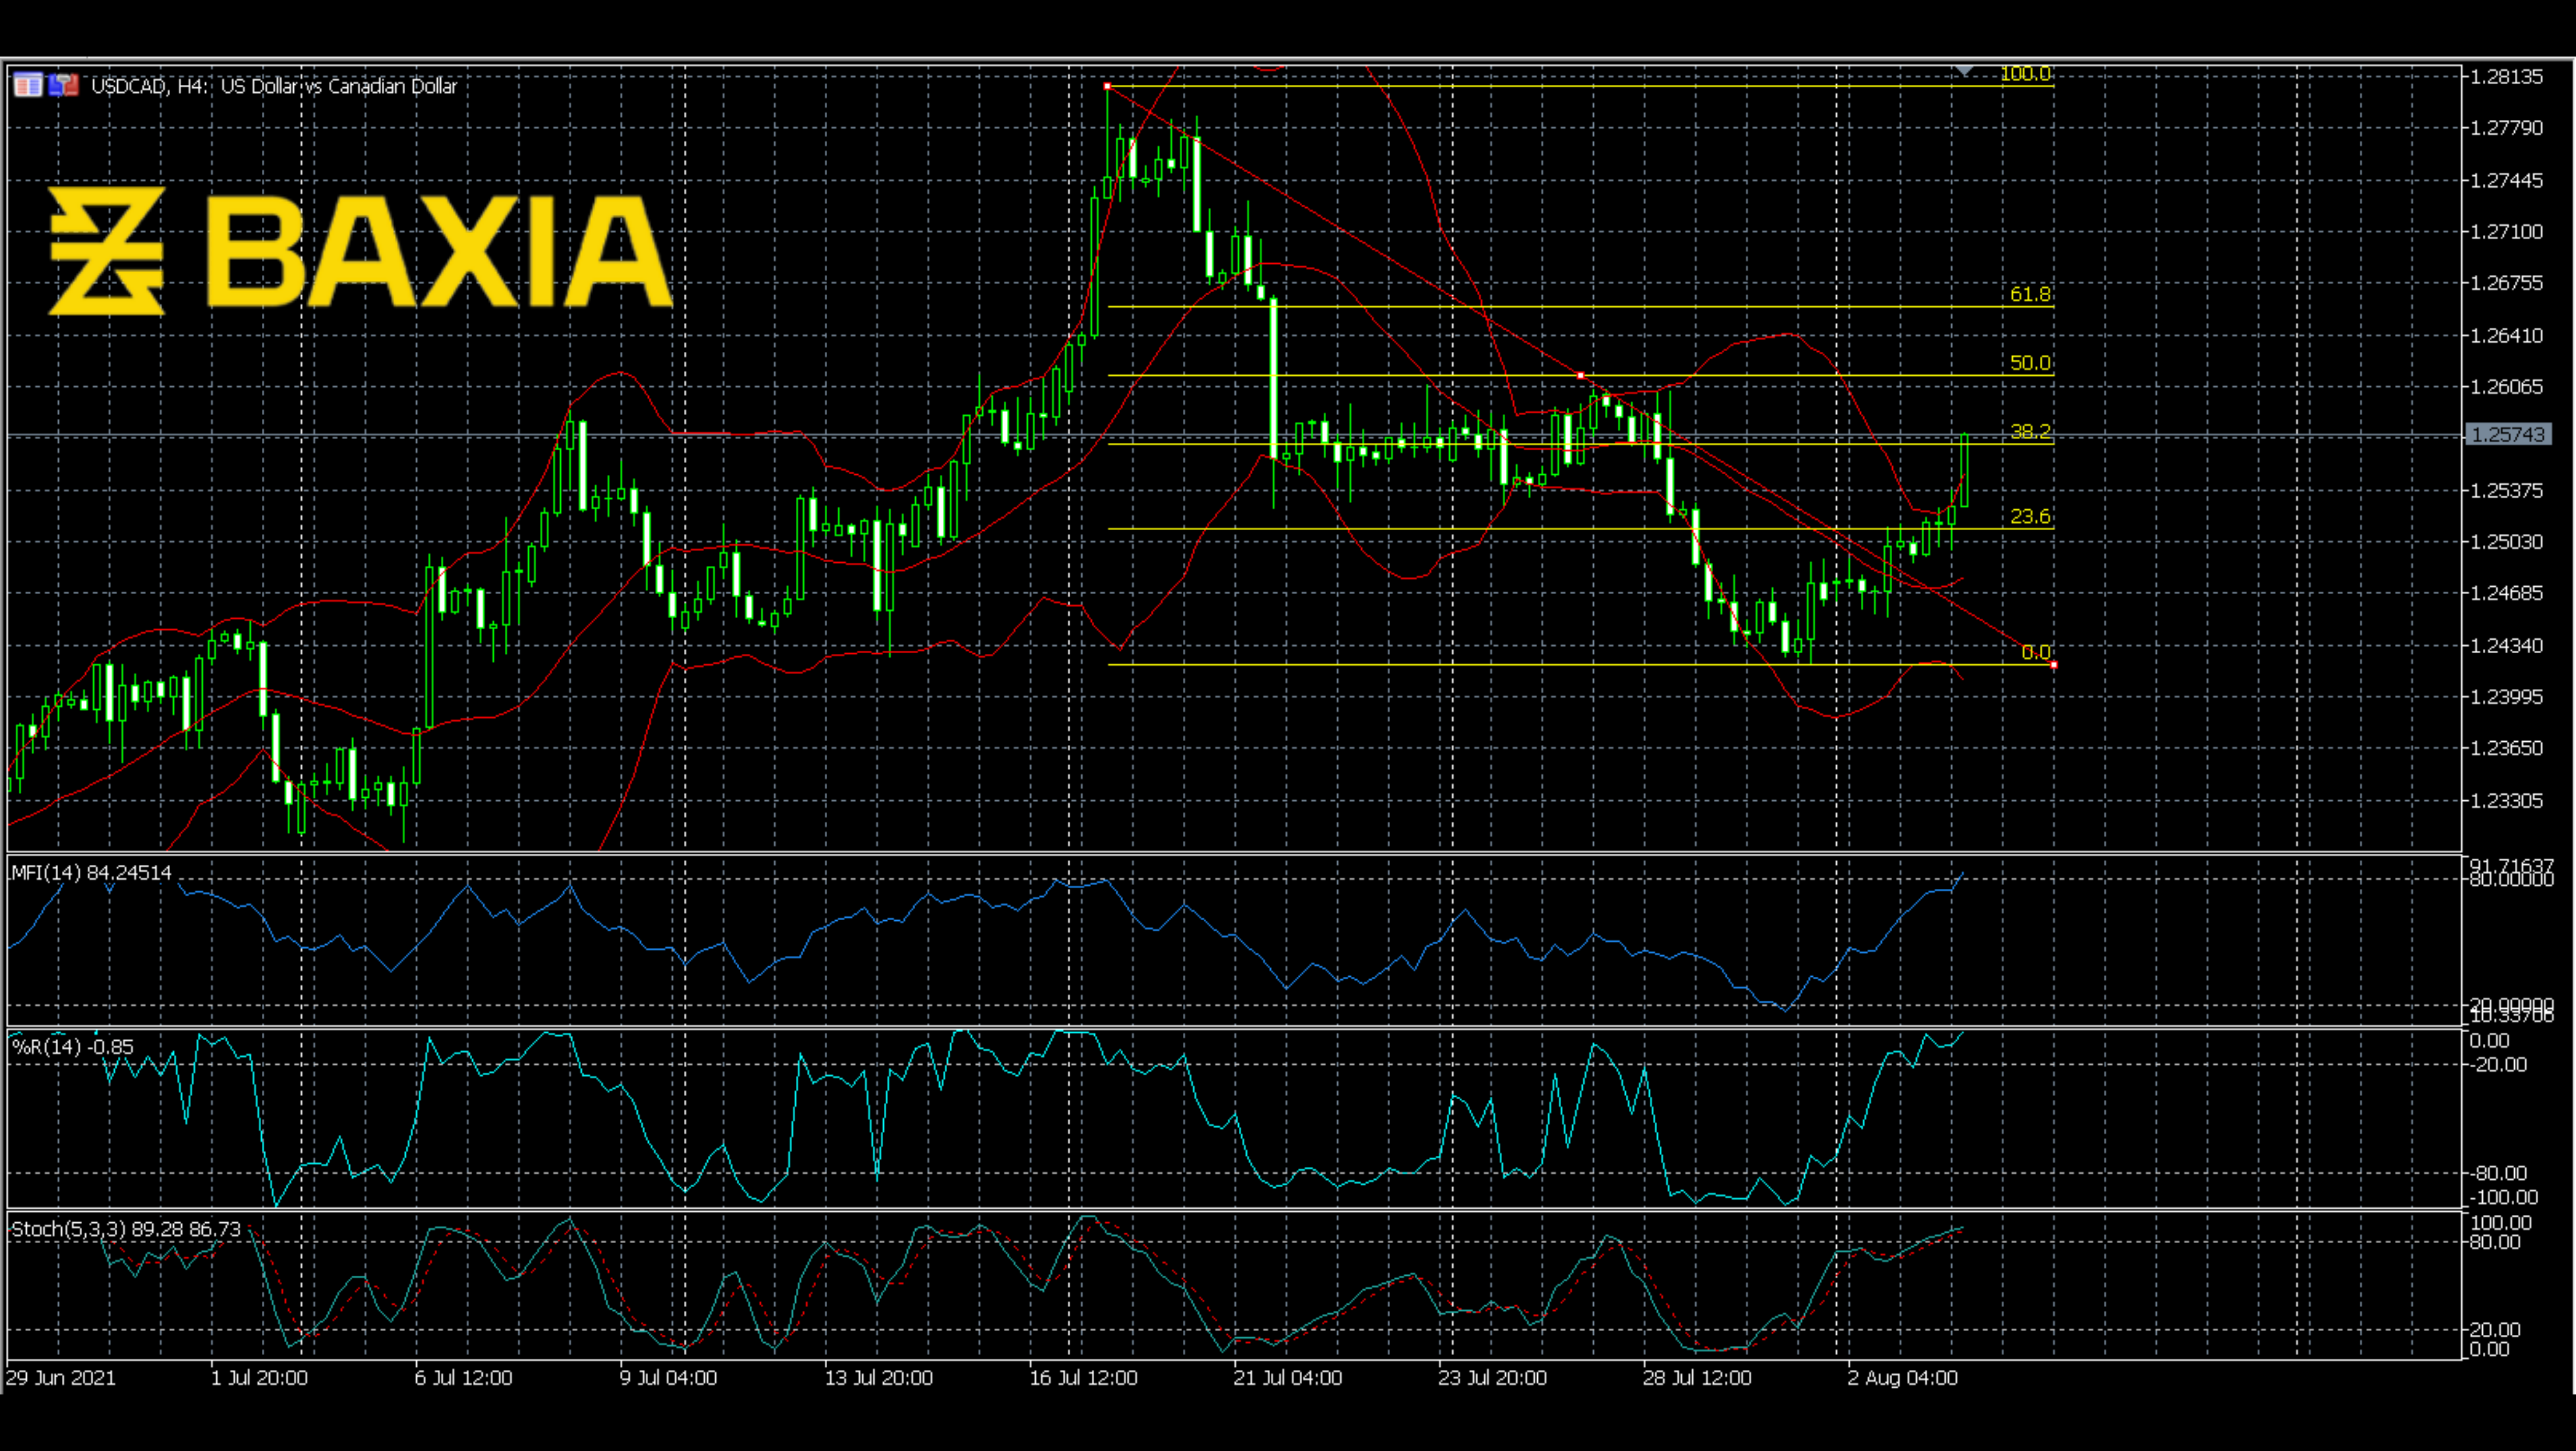

The price of EURUSD has gone through a sharp drop, which brought the price down 2.23% in about two days; this wave started on June 16th. Recently, the price began to retrace based on the previous 2.23% downfall; and the retracement already reached the 38.2% Fibonacci level. Does the 38.2% Fibonacci level stop the price from going up? Yes, as can be seen, the price touched the resistance line and turned down again.
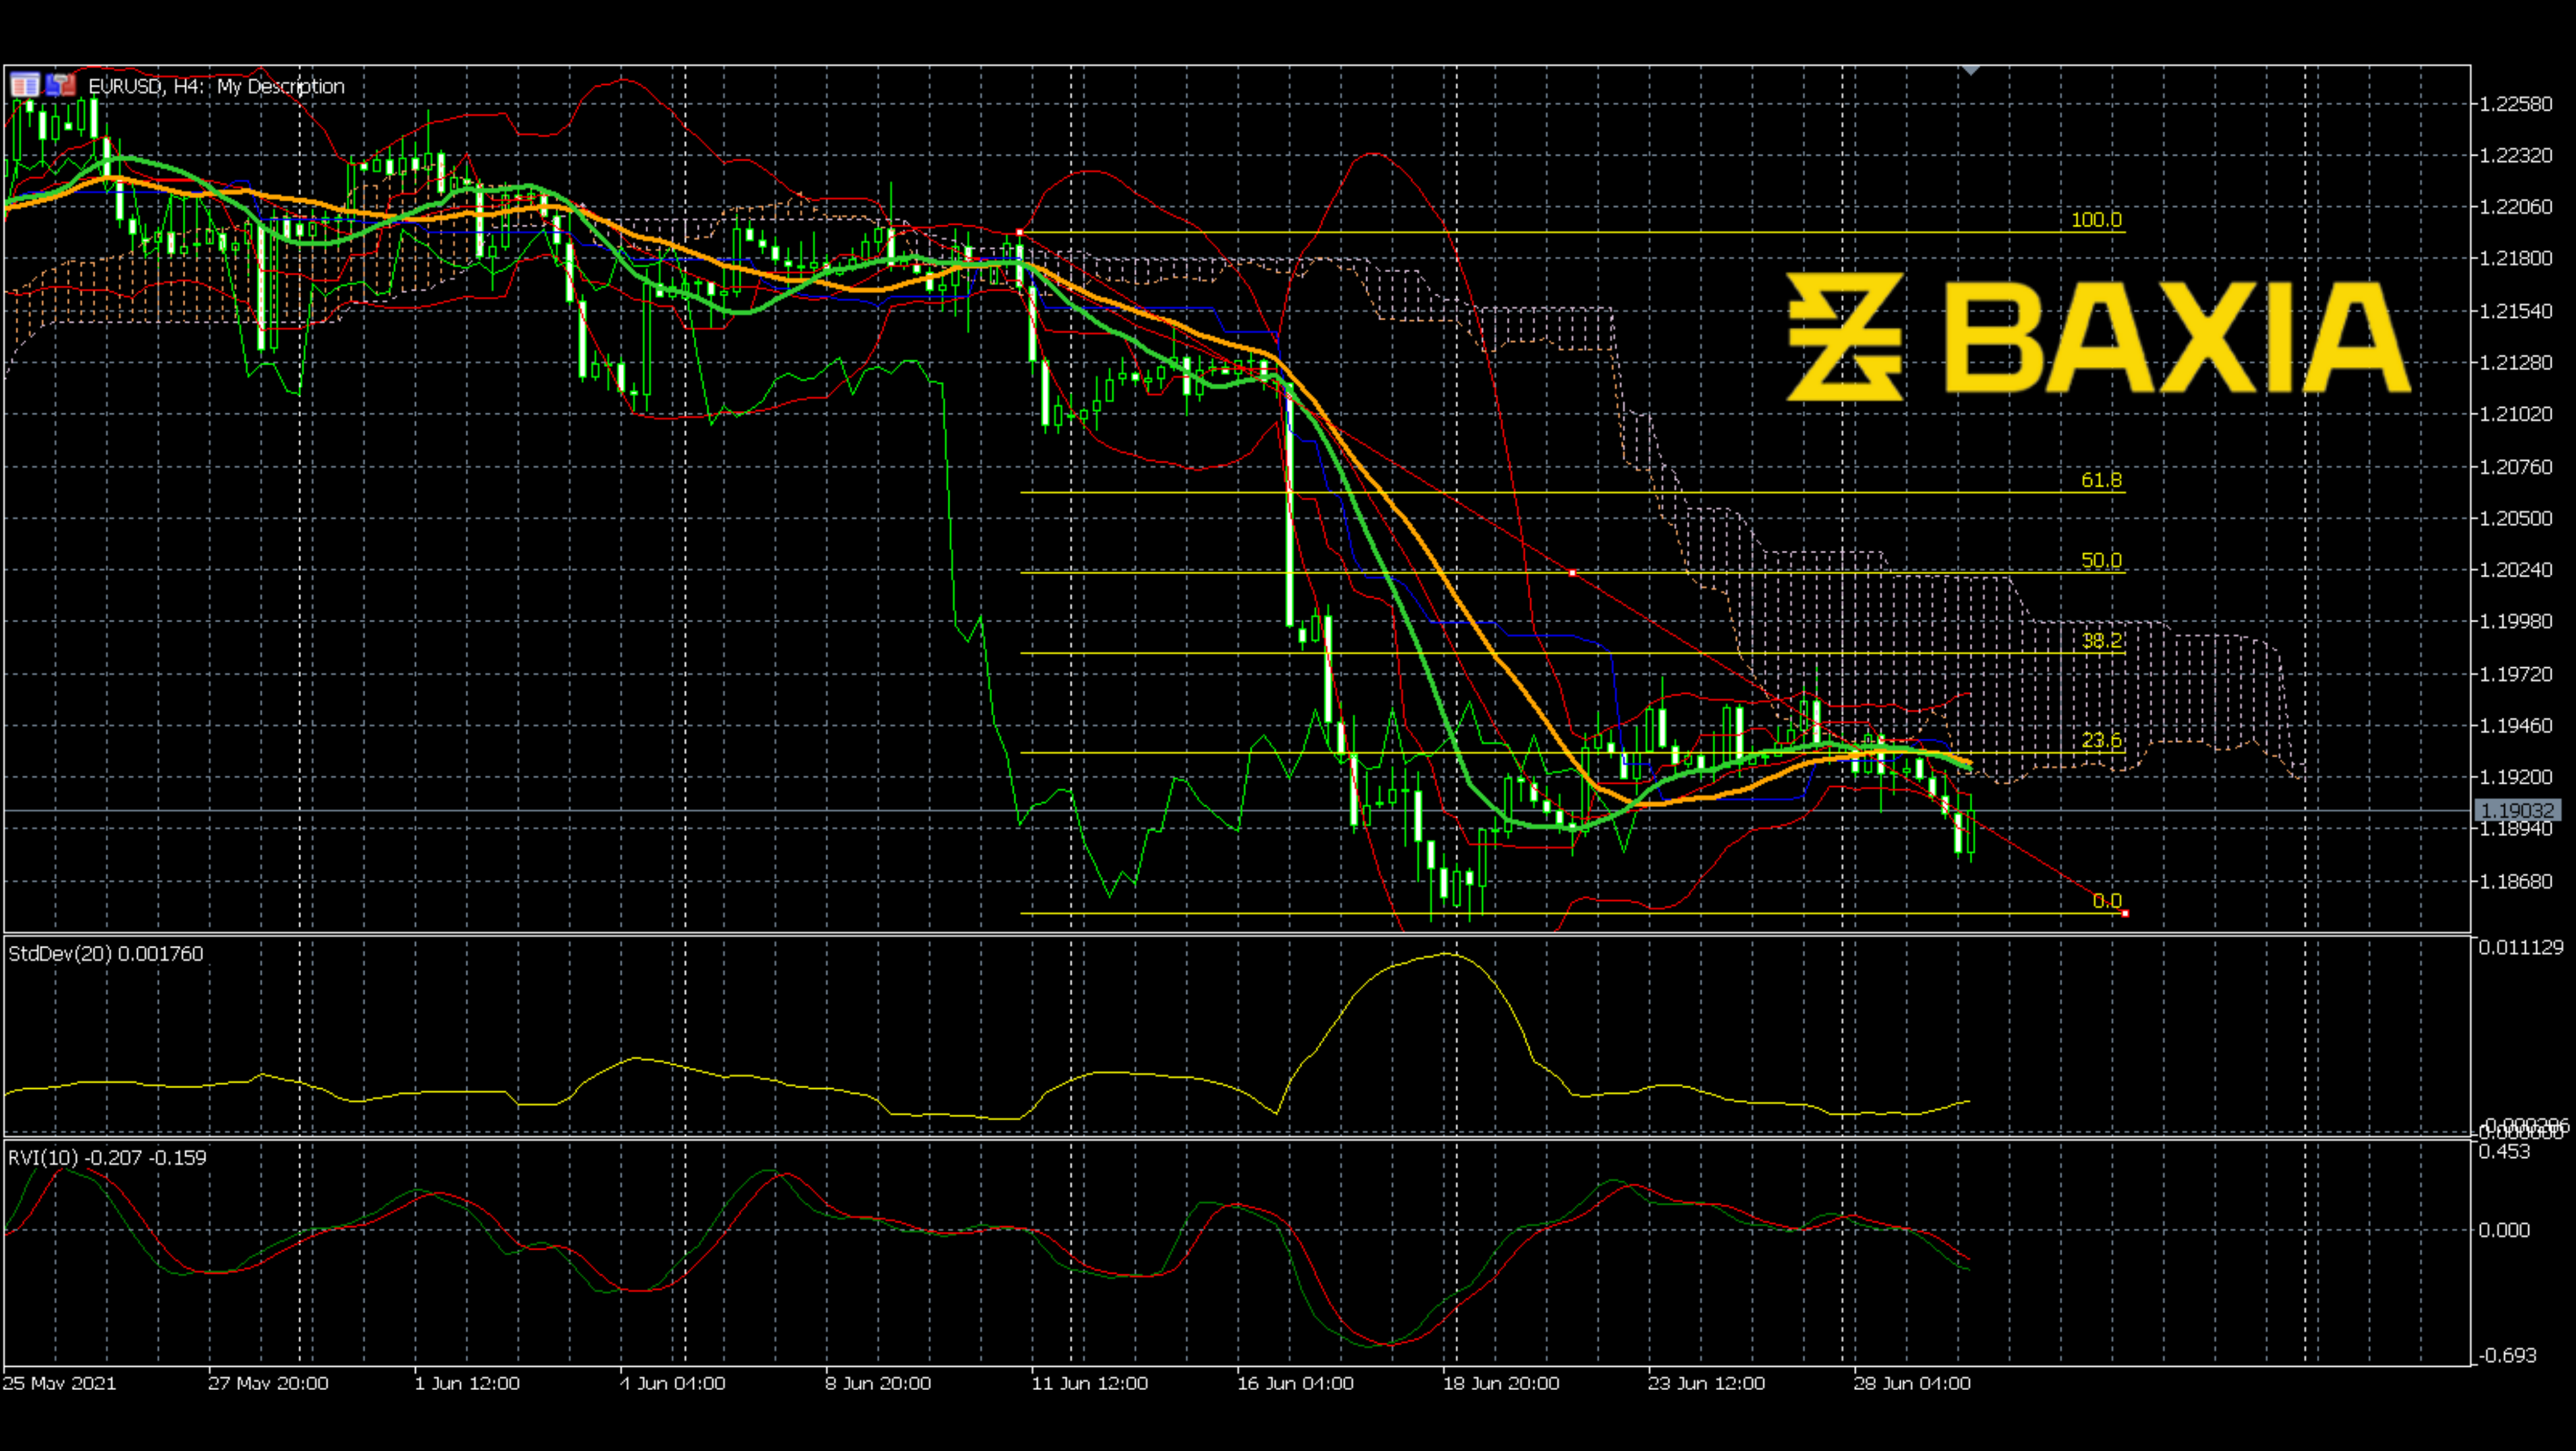
Usually, the 38.2% Fibonacci level is not a substantial level; will the new trend continue? The Bollinger Bands shrunk when the price met the 38.2% level, meaning a potential new breakout start. Next, the Ichimoku cloud is above the price line; a bearish signal. The 25 moving average (yellow line) just made a cross with the 15 moving average (green line), and we can see the green line is now below the yellow line, which means the bull power is getting stronger.
Same as MACD and Moving Average, the RVI lines also go down together. Most of the signals are bearish signals, does this mean the price has to drop? What are your thoughts?
We love to hear new ideas from traders and want to know what you think!
If you like this topic and want to suggest future topics that you find helpful, let us know by clicking the ‘submit your feedback’ button below.

Trading foreign exchange on margin carries a high level of risk, and may not be suitable for all investors. Before deciding to trade foreign exchange you should carefully consider your investment objectives, level of experience, and risk appetite.
Nothing contained in this website should be construed as investment advice. Any reference to an investment's past or potential performance is not, and should not be construed as, a recommendation or as a guarantee of any specific outcome or profit.