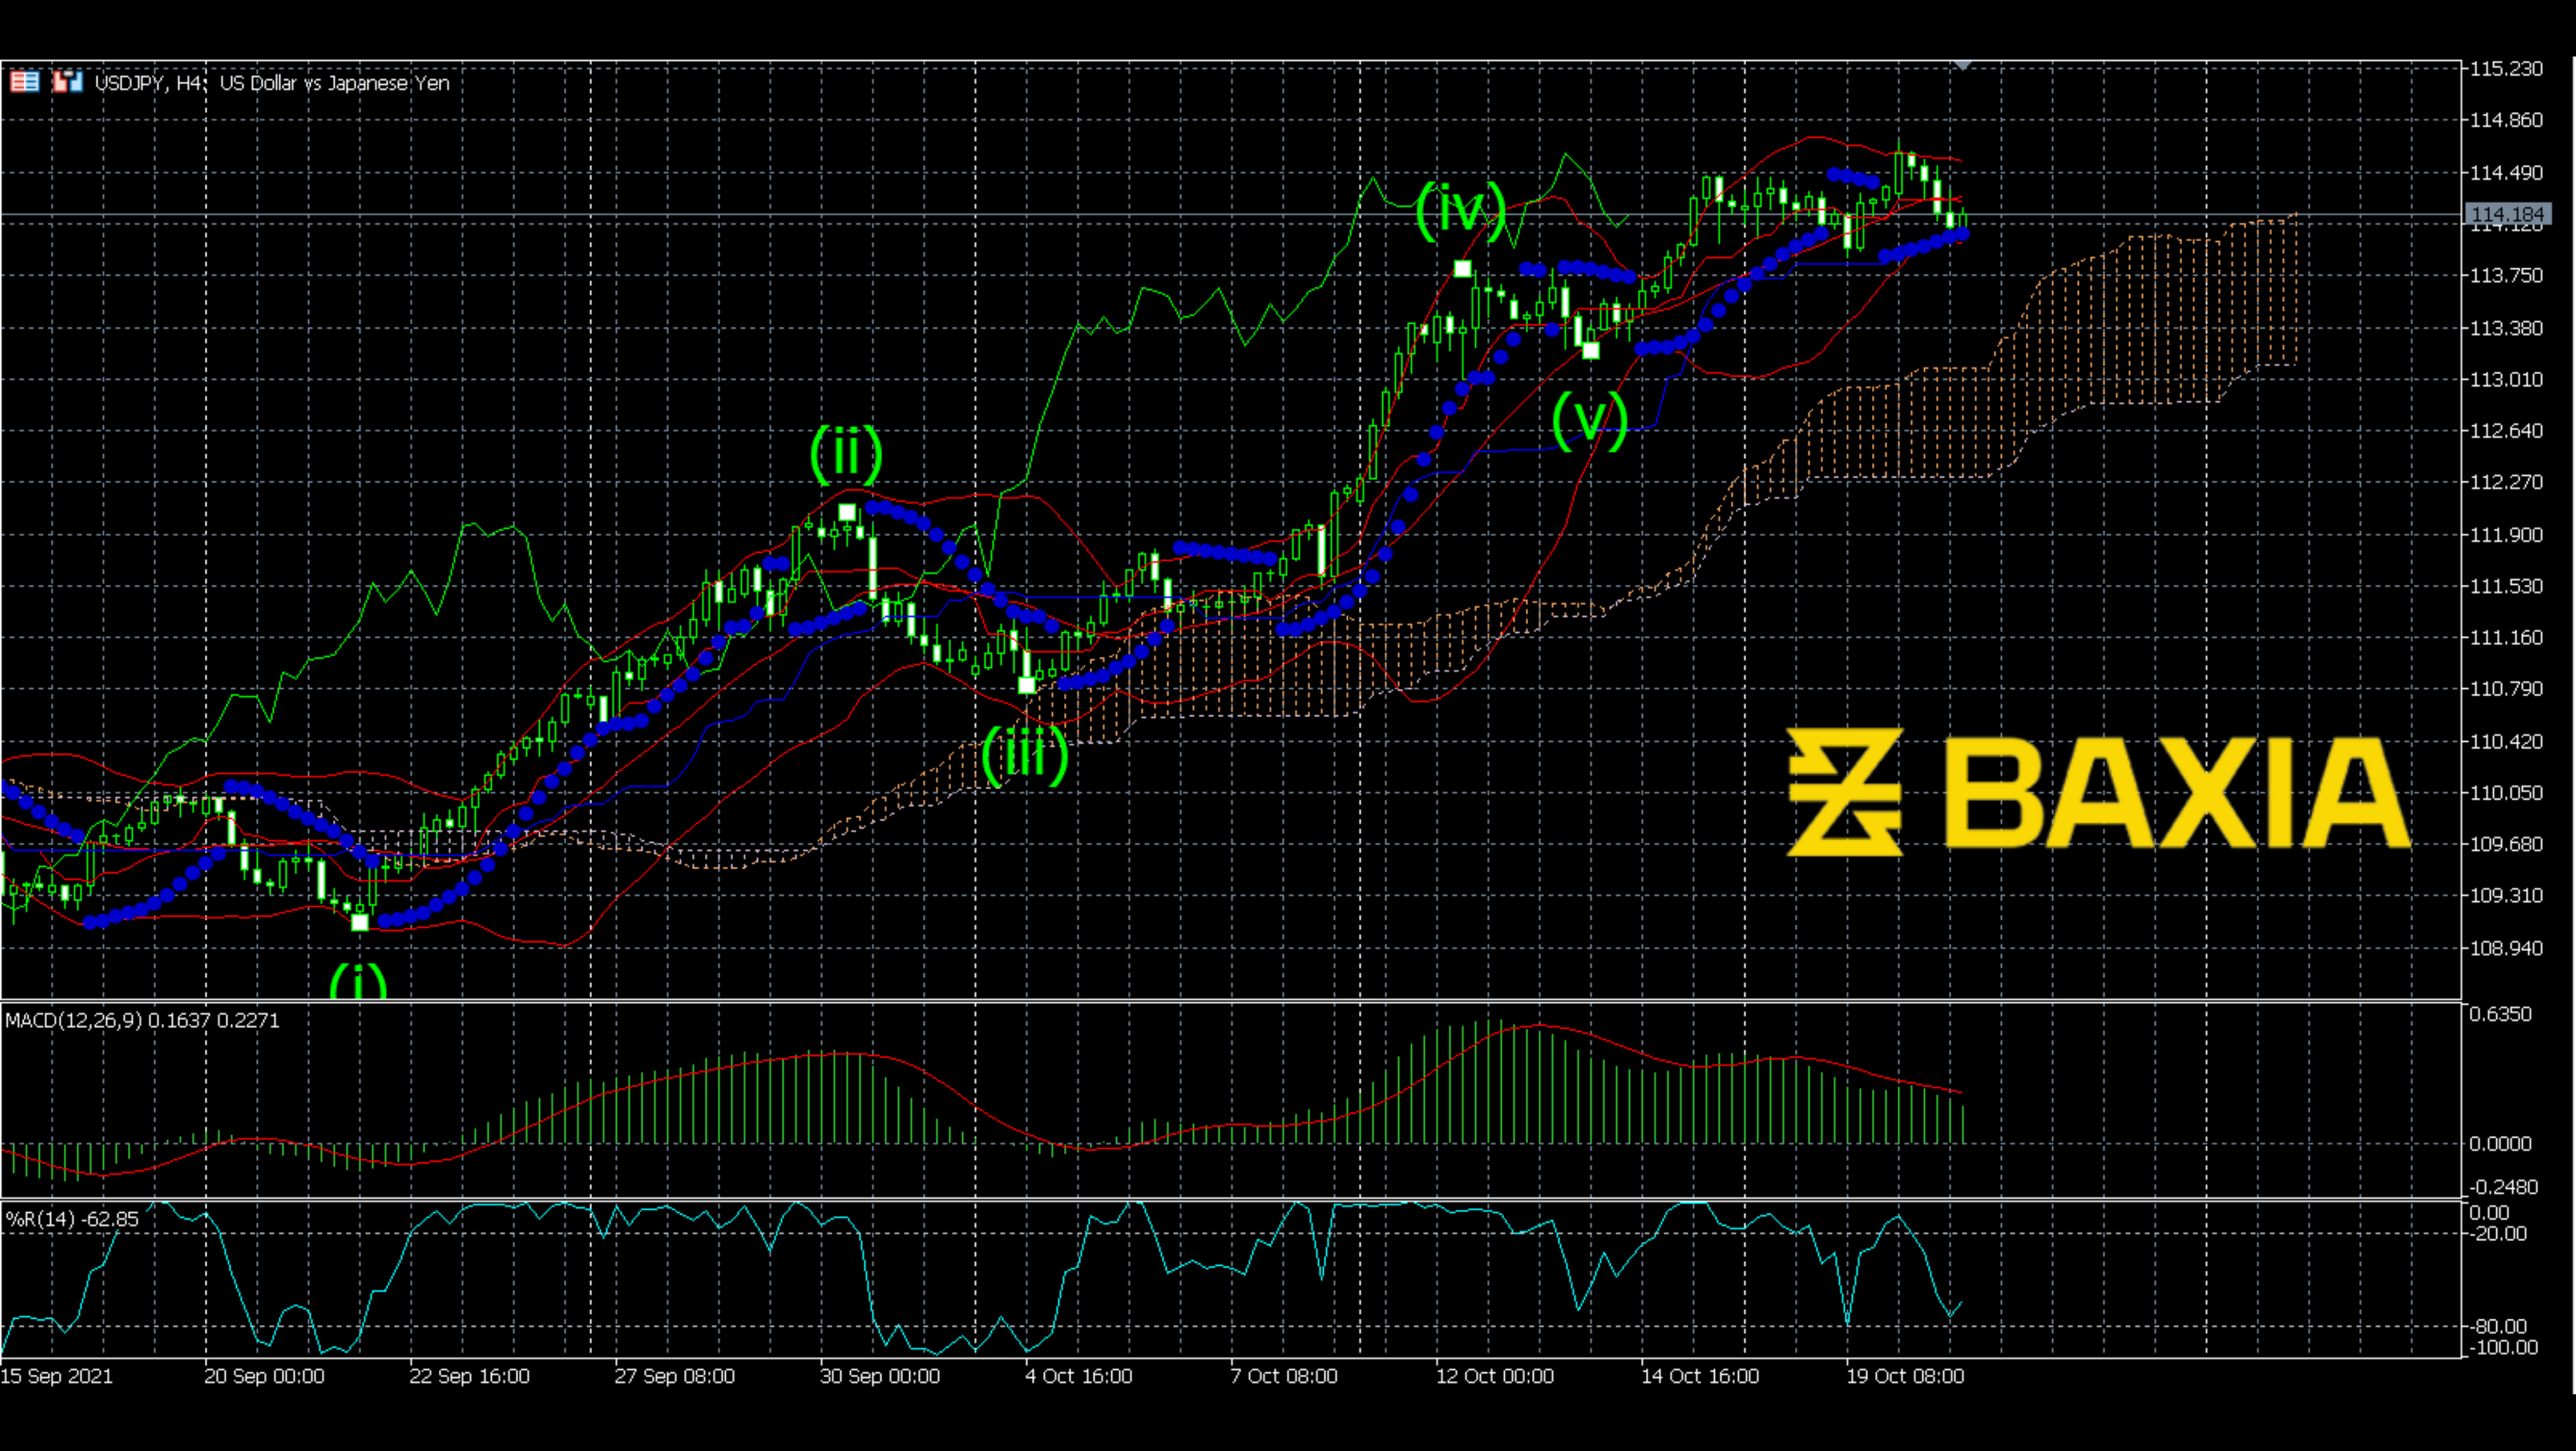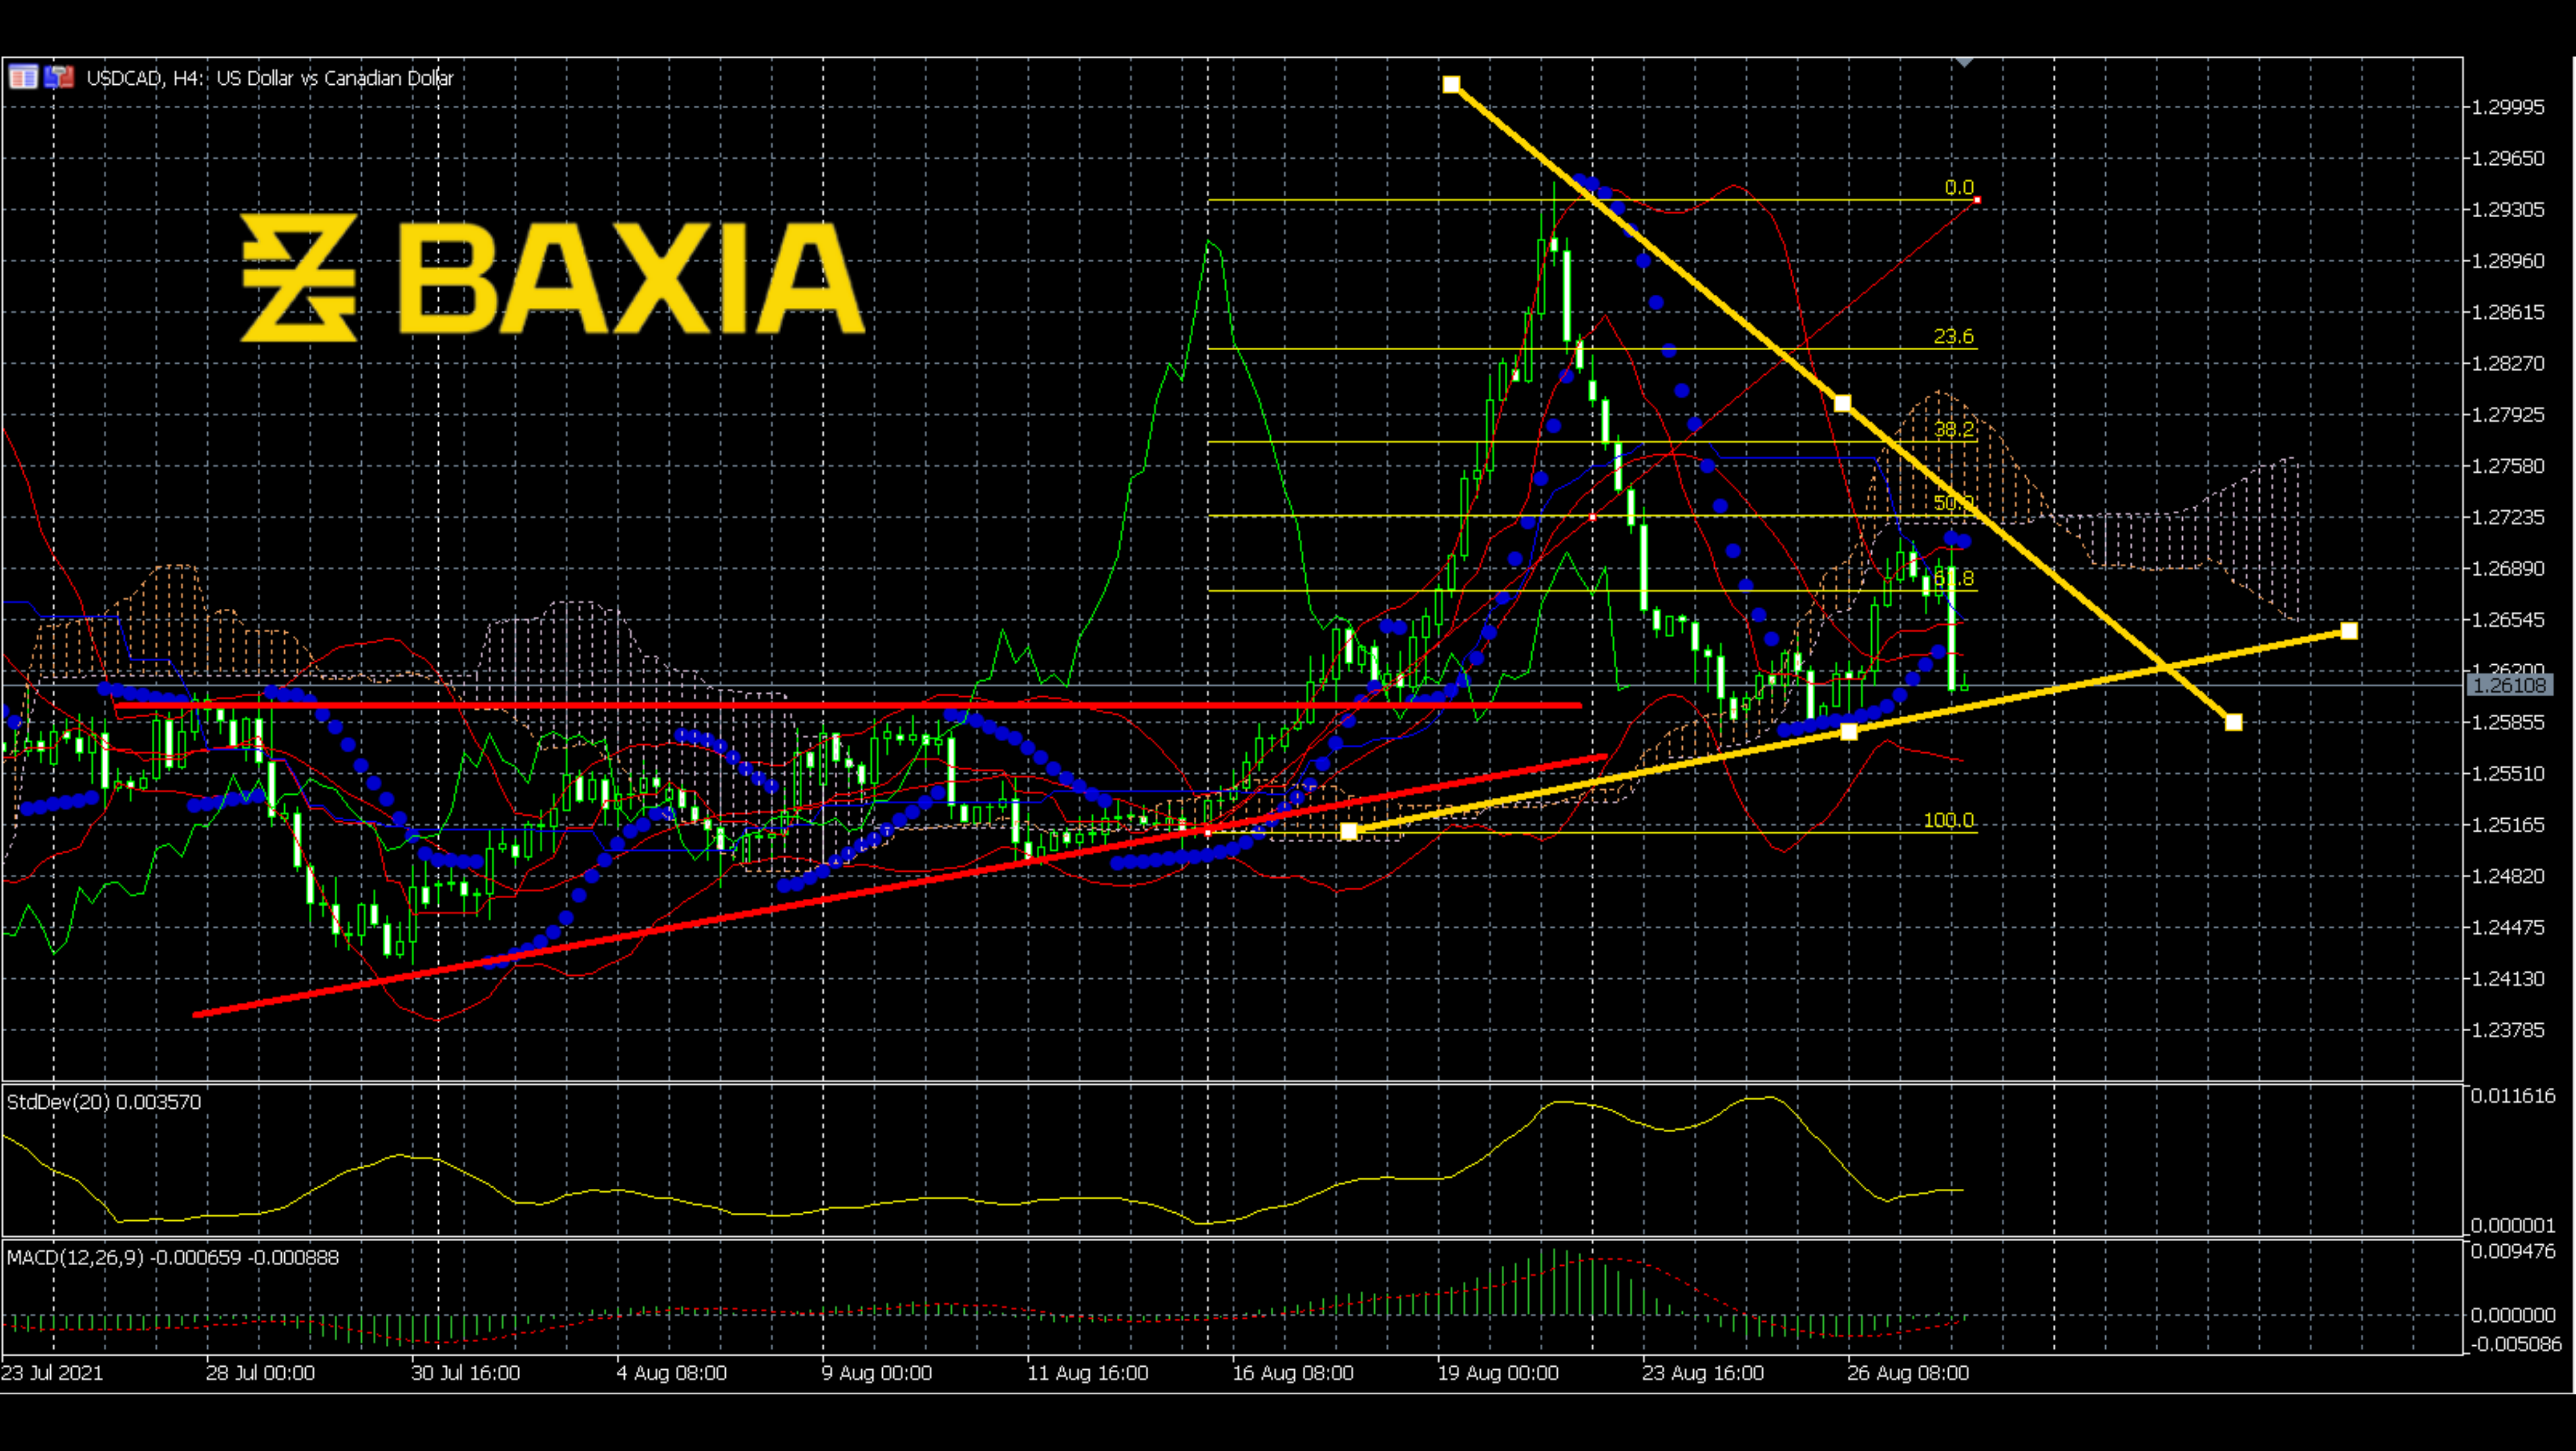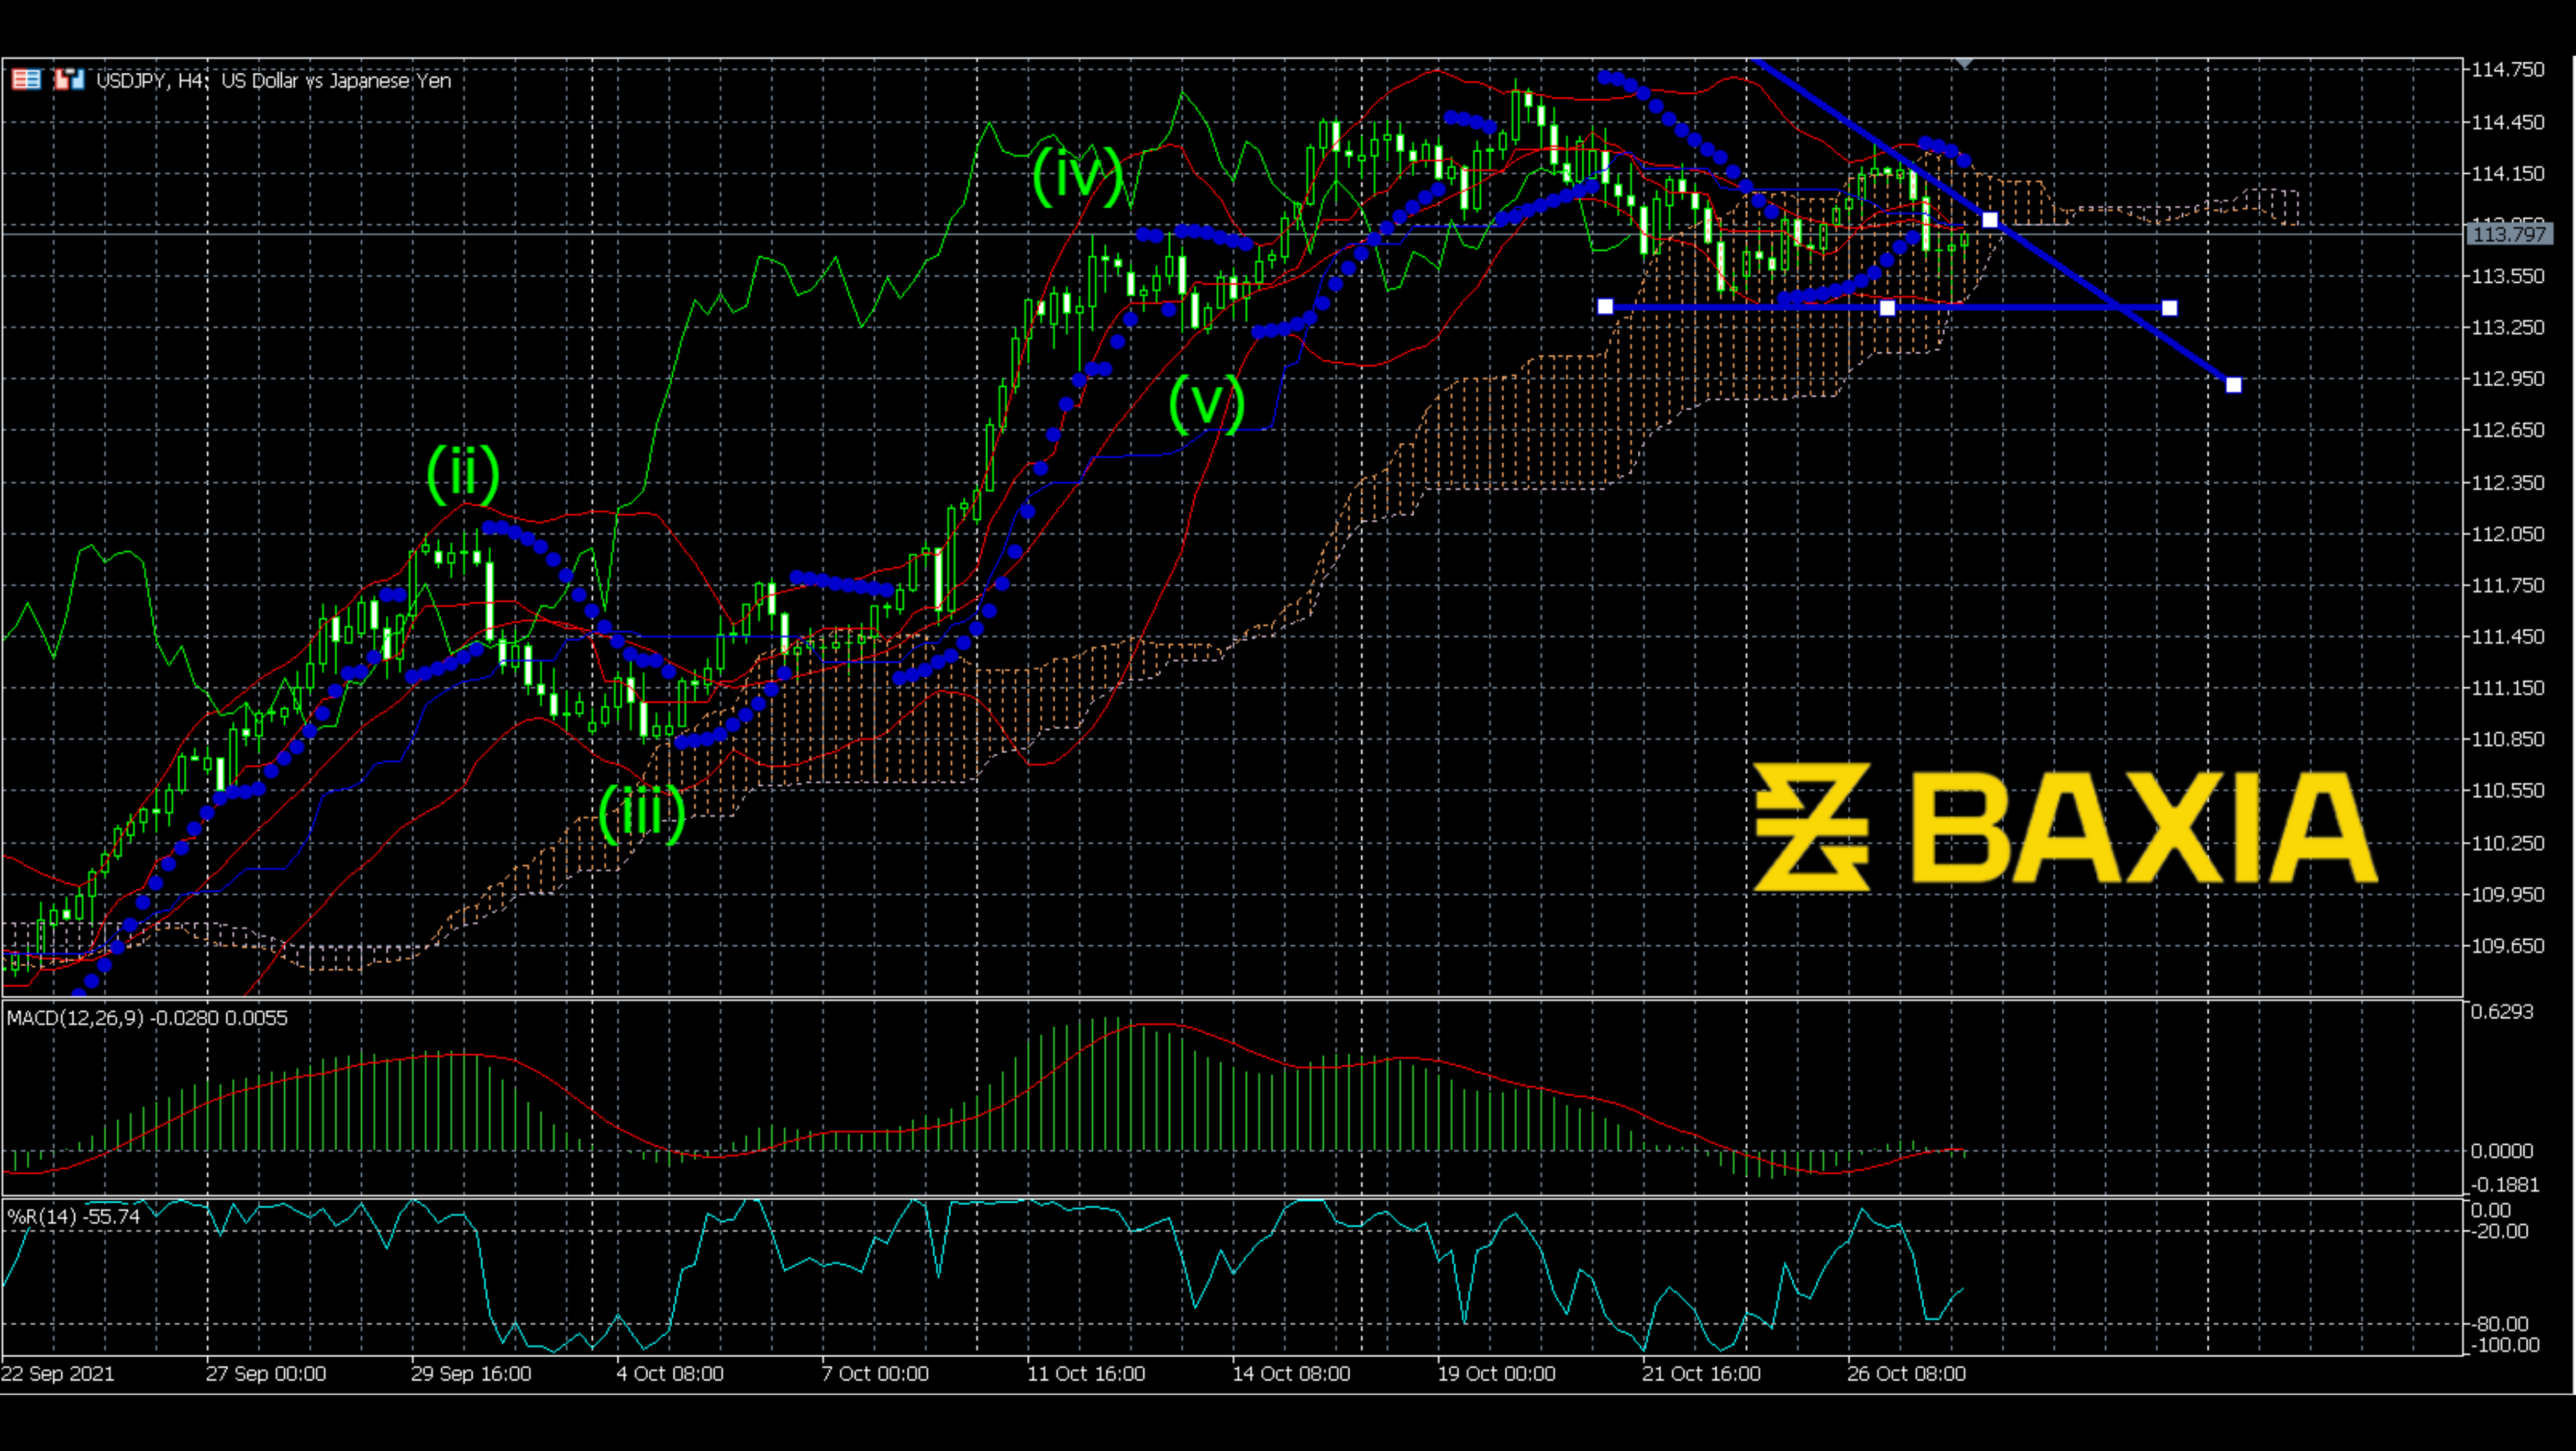

The downward trend on USDCAD had lasted for 11 days and is down 3%. The whole movement contains two waves. Each bottom touched the lower Bollinger Bands. Does this movement remind you of something? I would think about the Elliott Wave. It looks like an unfinished Elliott wave.
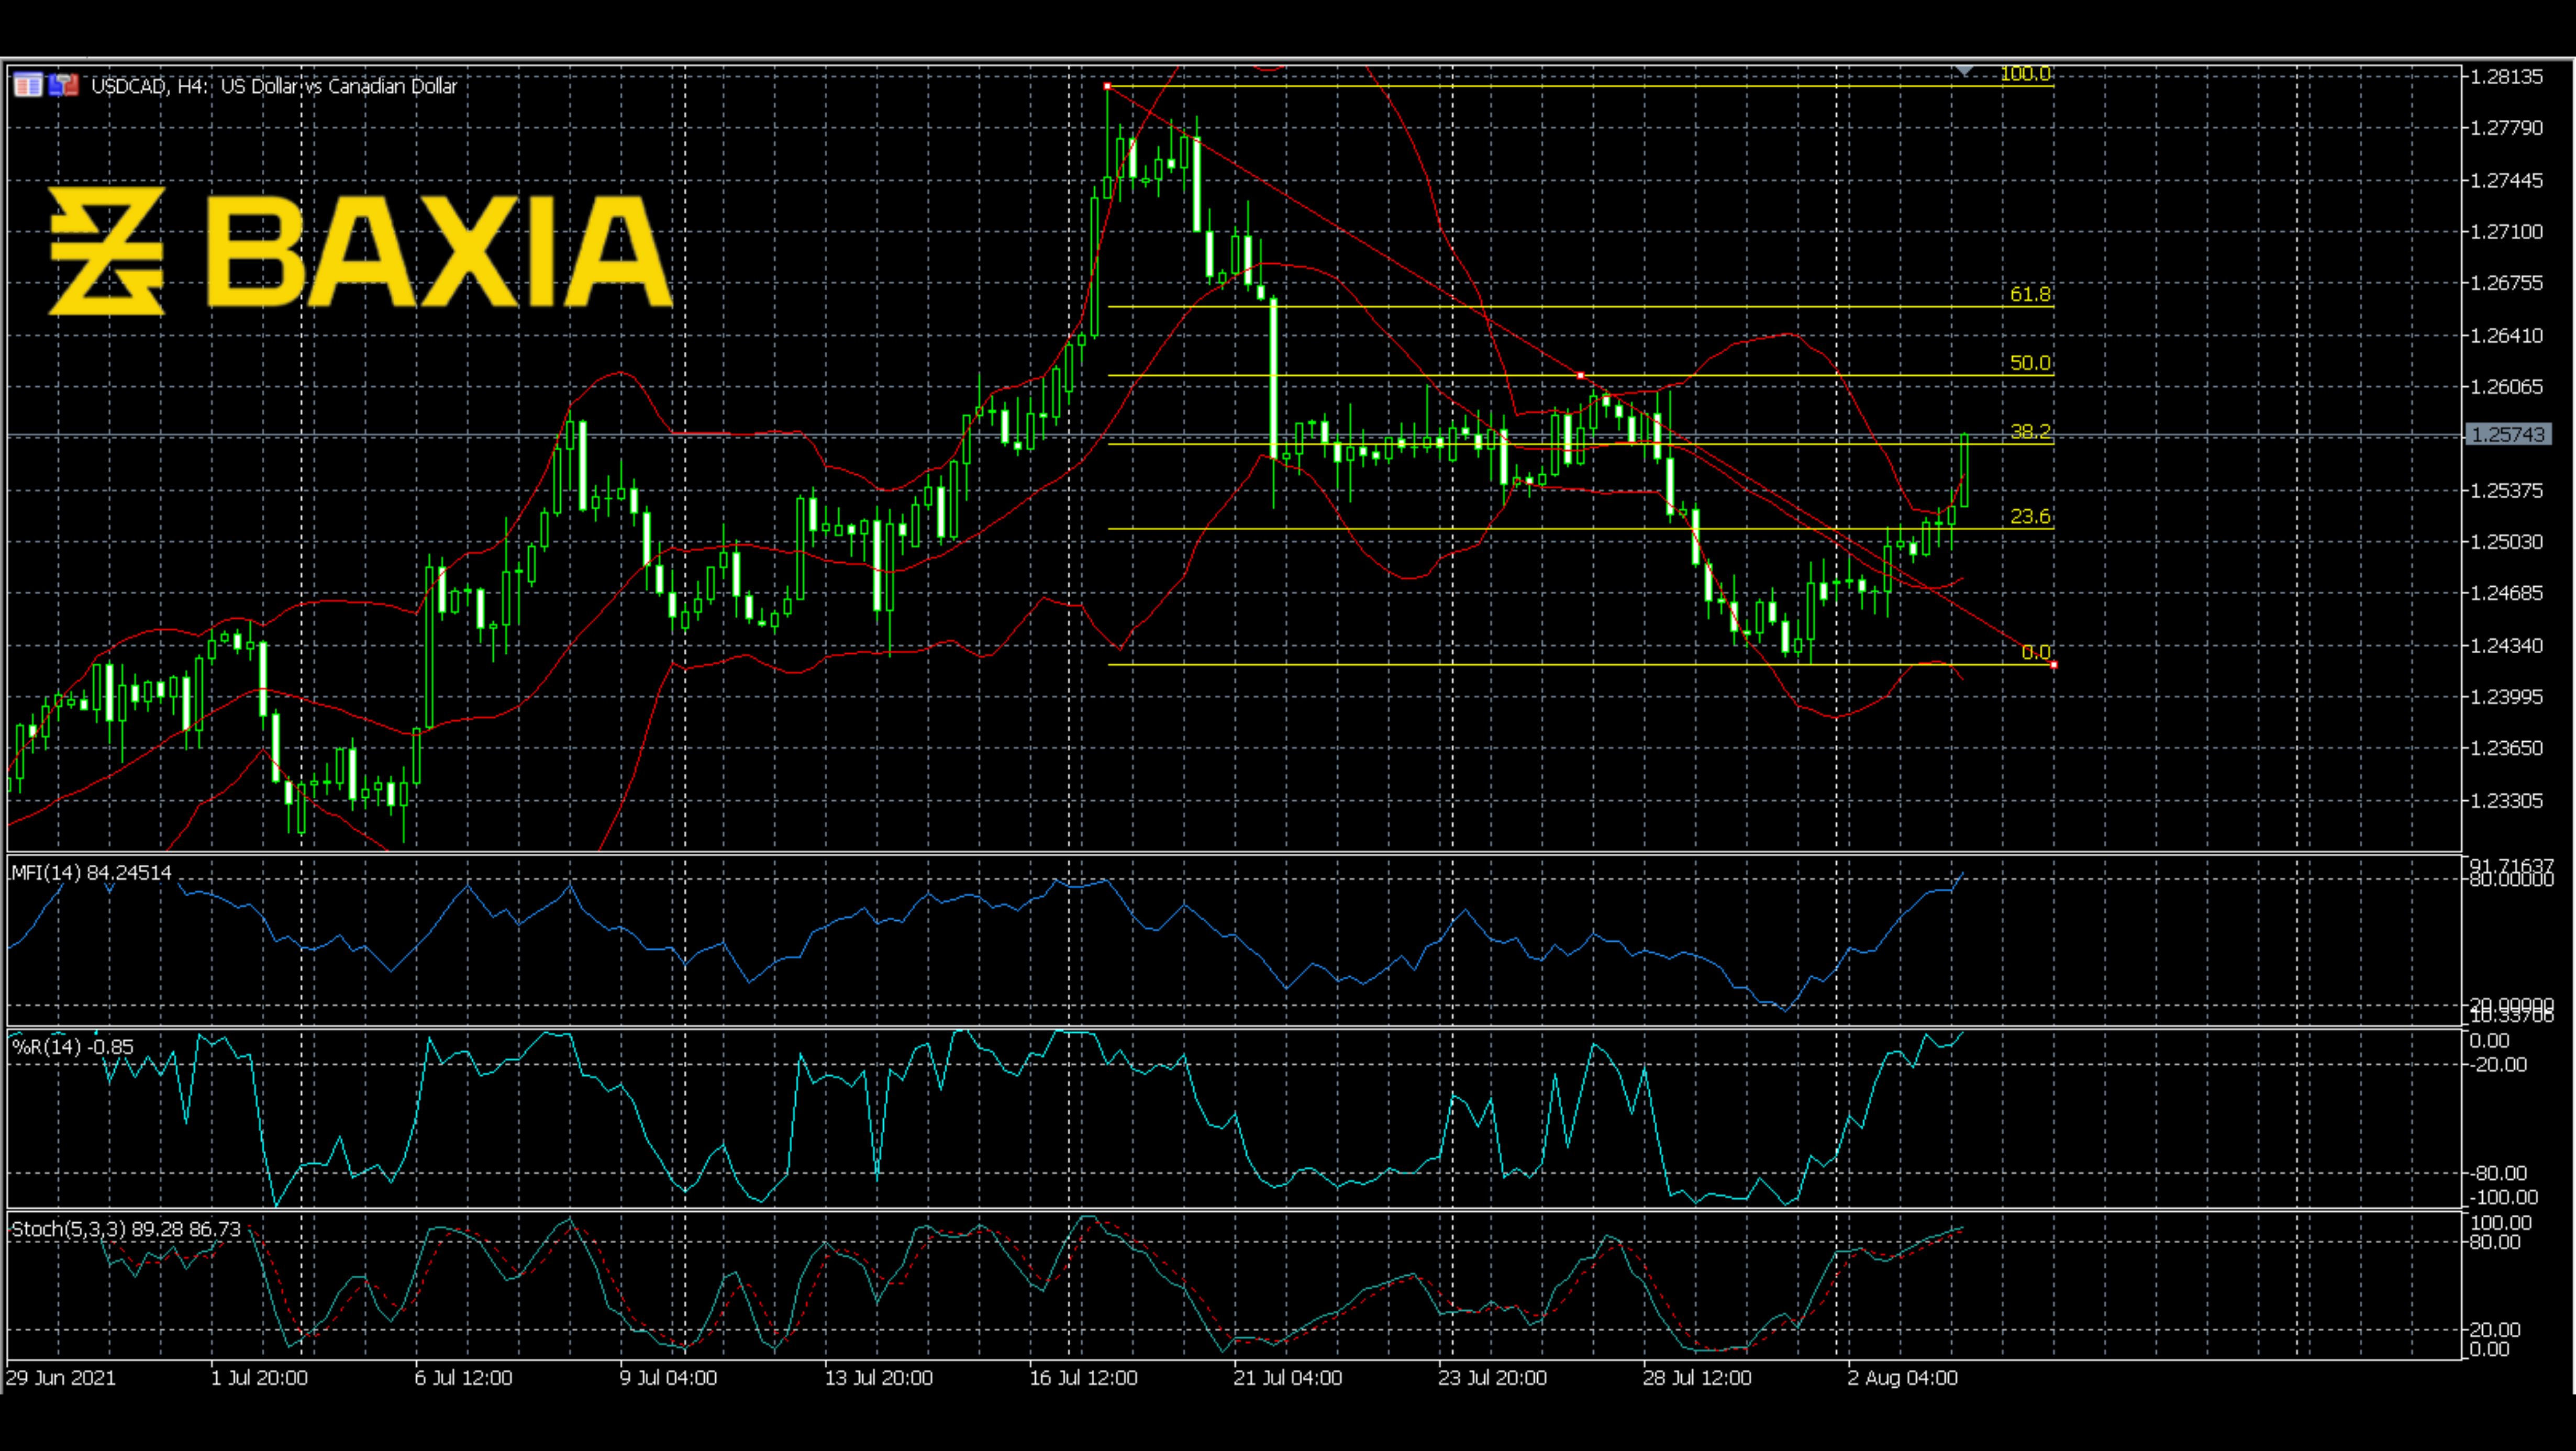
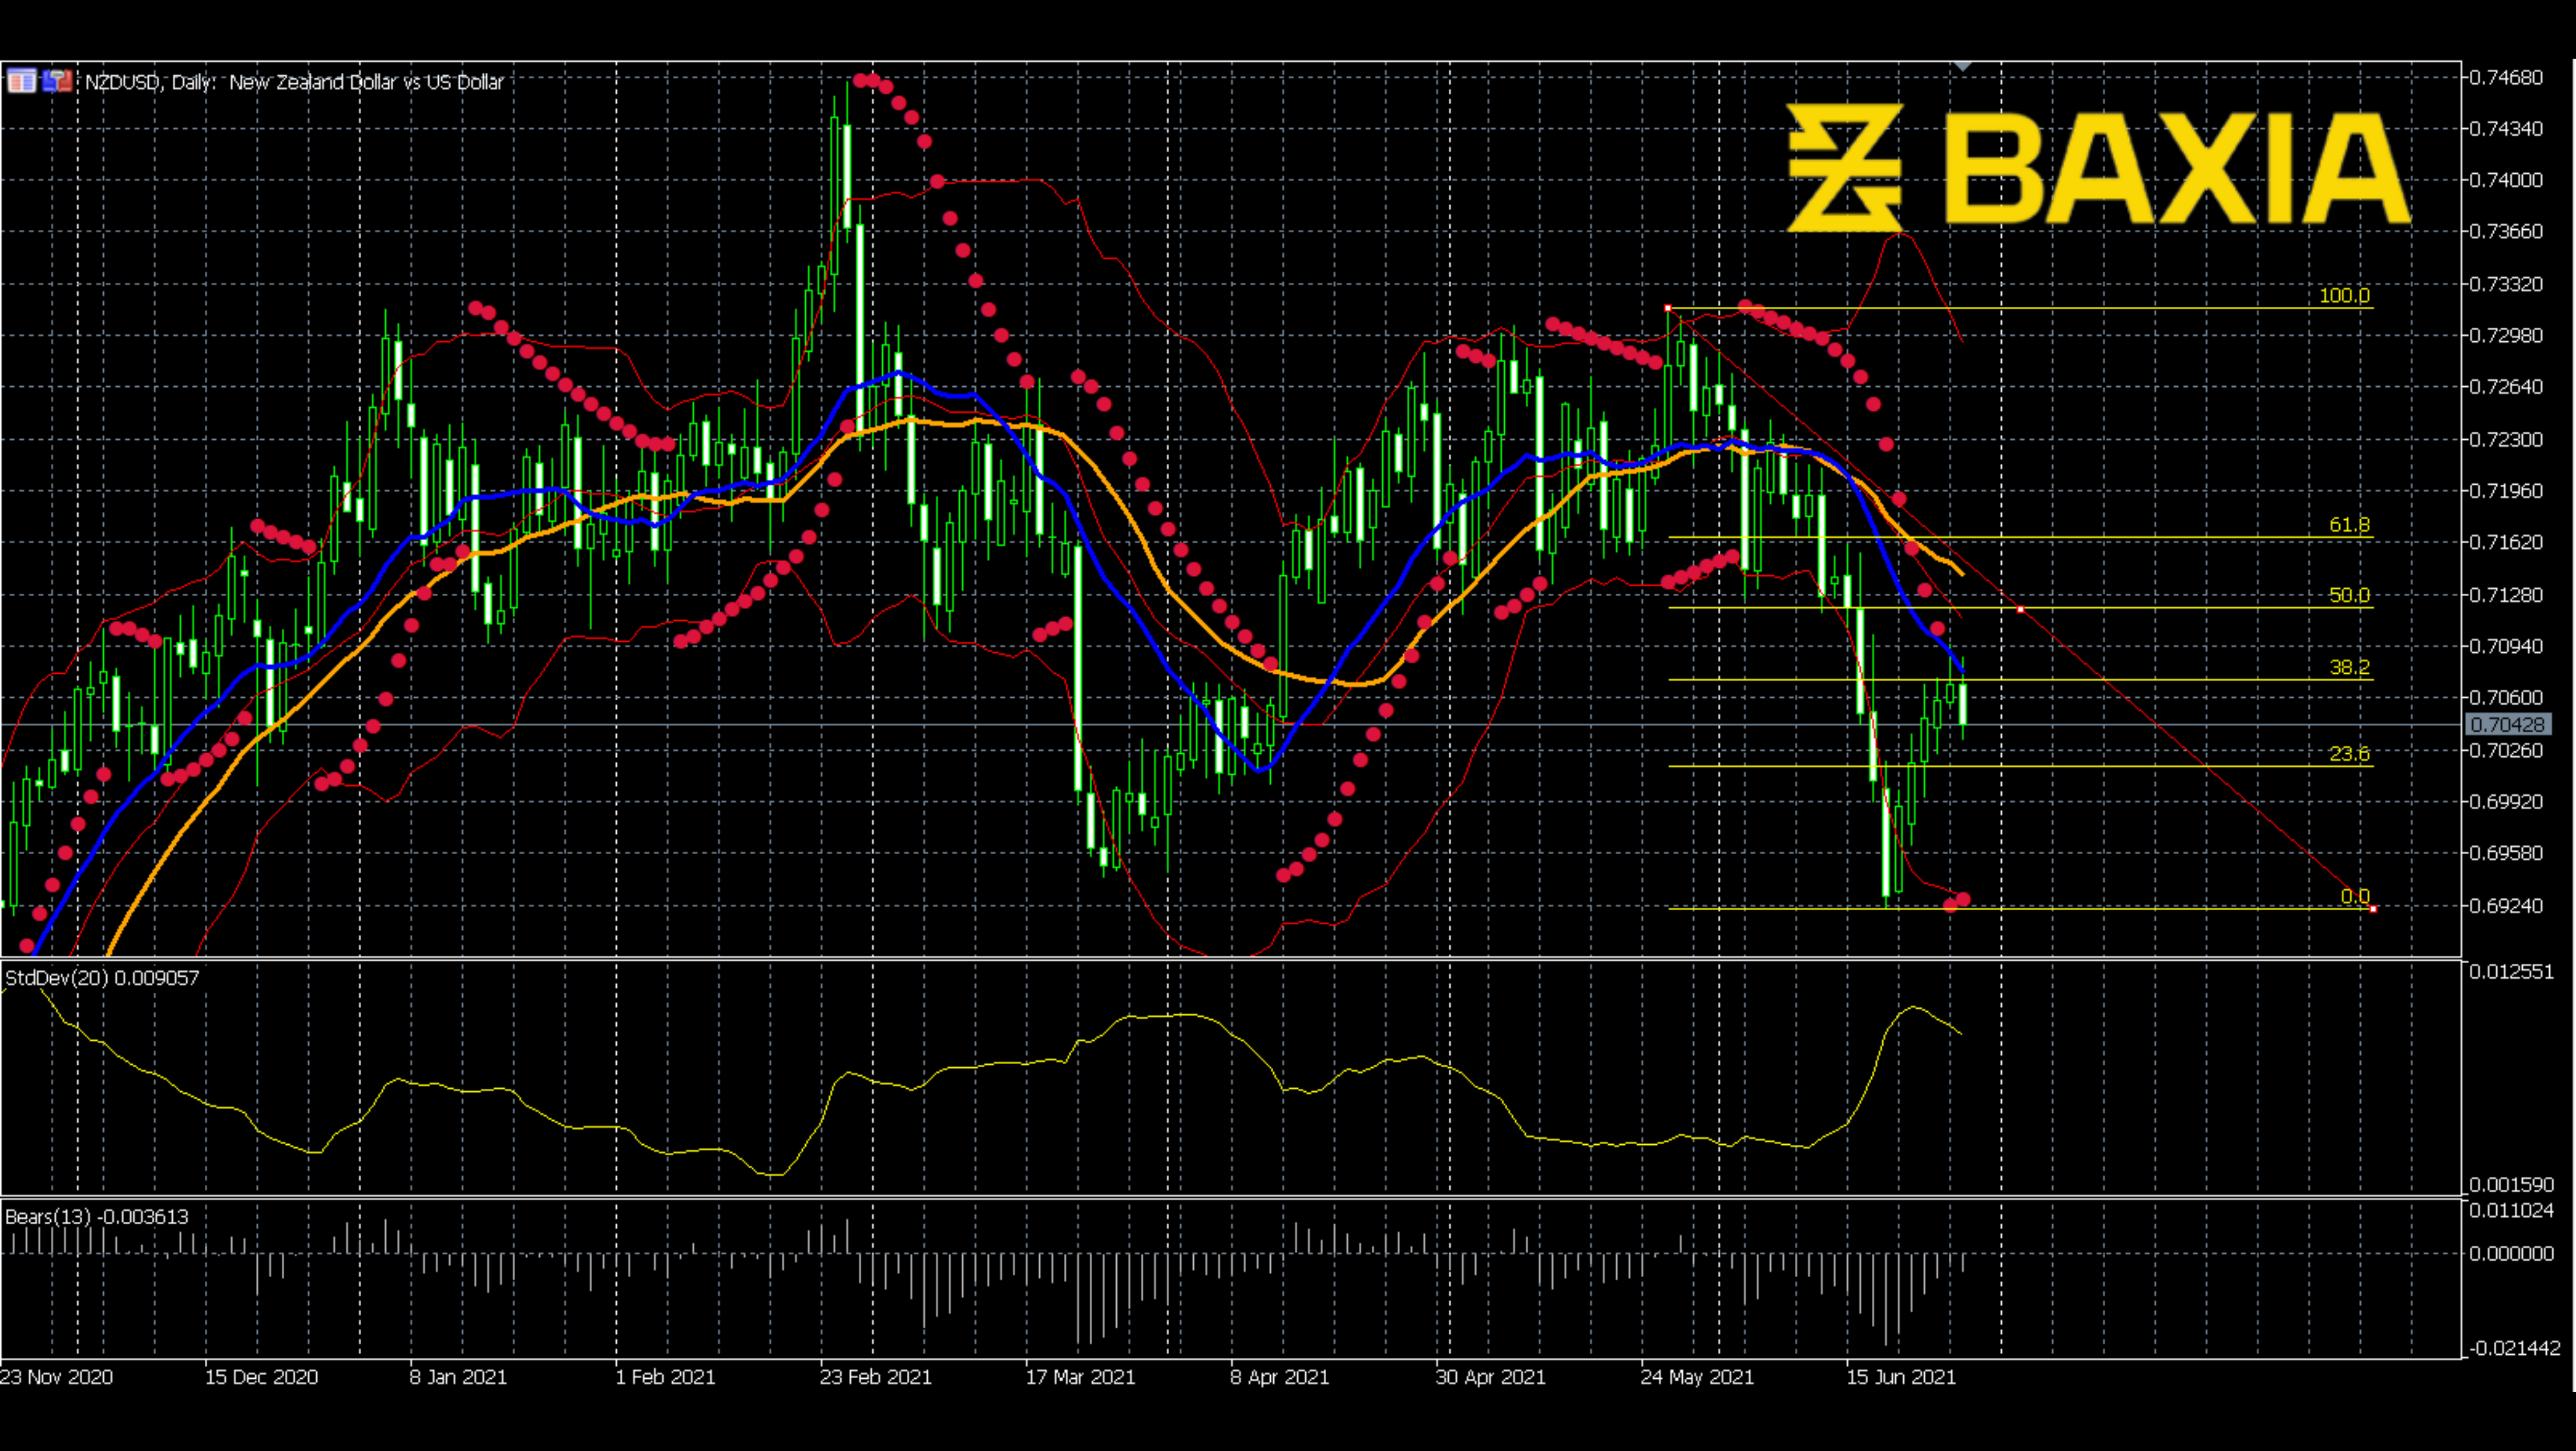
Usually, we know that the Elliott wave contains three waves. The price line has already finished two of them, and has reached a peak; will the price fall soon? The price line touched the 38.2% Fibonacci level and also broke out the upper Bollinger Band. This brought resistance pressure on the price line.
Also, the MFI went up to above the 80 level, which means it is currently unstable. Besides, the Williams R% and Stochastics both went into overbought; putting bearish pressure on the price. Here we must be careful and patient. The price could break down at any time. Make sure you are ready when the time comes.
We love to hear new ideas from traders and want to know what you think!
If you like this topic and want to suggest future topics that you find helpful, let us know by clicking the ‘submit your feedback’ button below.

Trading foreign exchange on margin carries a high level of risk, and may not be suitable for all investors. Before deciding to trade foreign exchange you should carefully consider your investment objectives, level of experience, and risk appetite.
Nothing contained in this website should be construed as investment advice. Any reference to an investment's past or potential performance is not, and should not be construed as, a recommendation or as a guarantee of any specific outcome or profit.