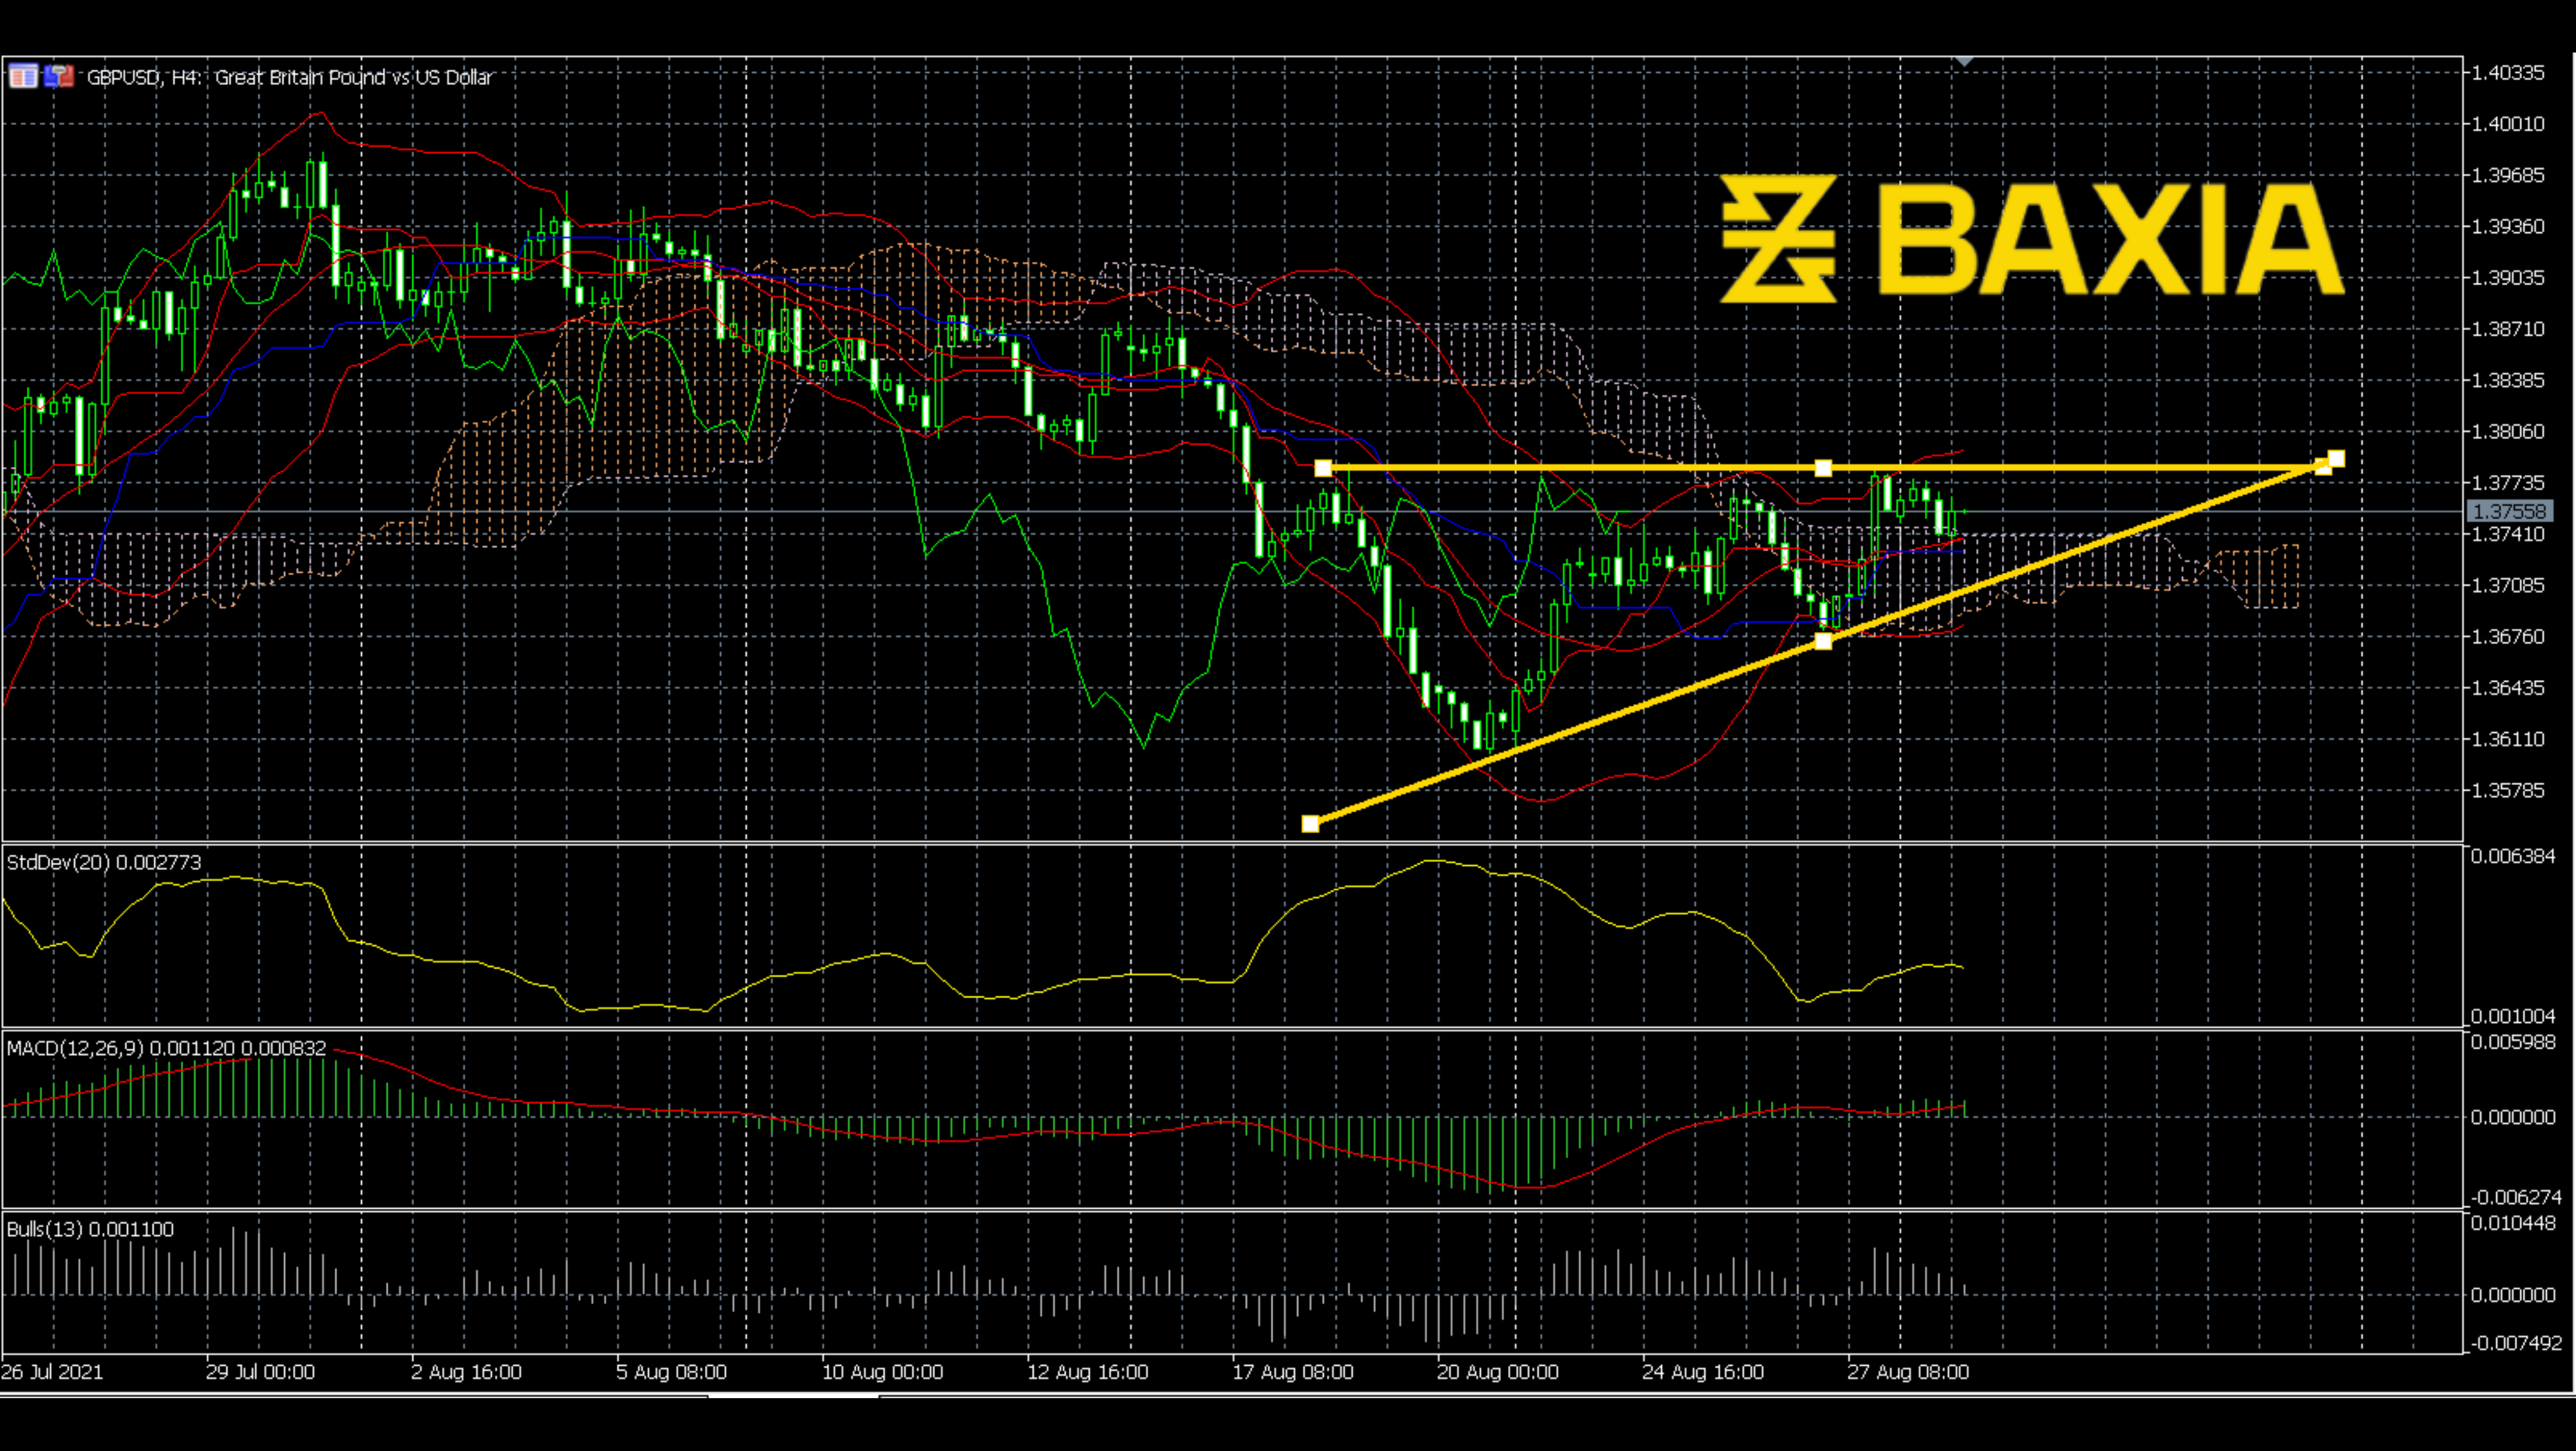

The downward trend on July 17th was similar to a crash on EURUSD; the price has gone down by 2.35% in 48 hours, a considerable drop. After the fall, the price started to fluctuate. The first wave was long and in a comparatively extensive price range. Then, the upcoming ones were mild. These waves made up a pattern, a descending triangle pattern.
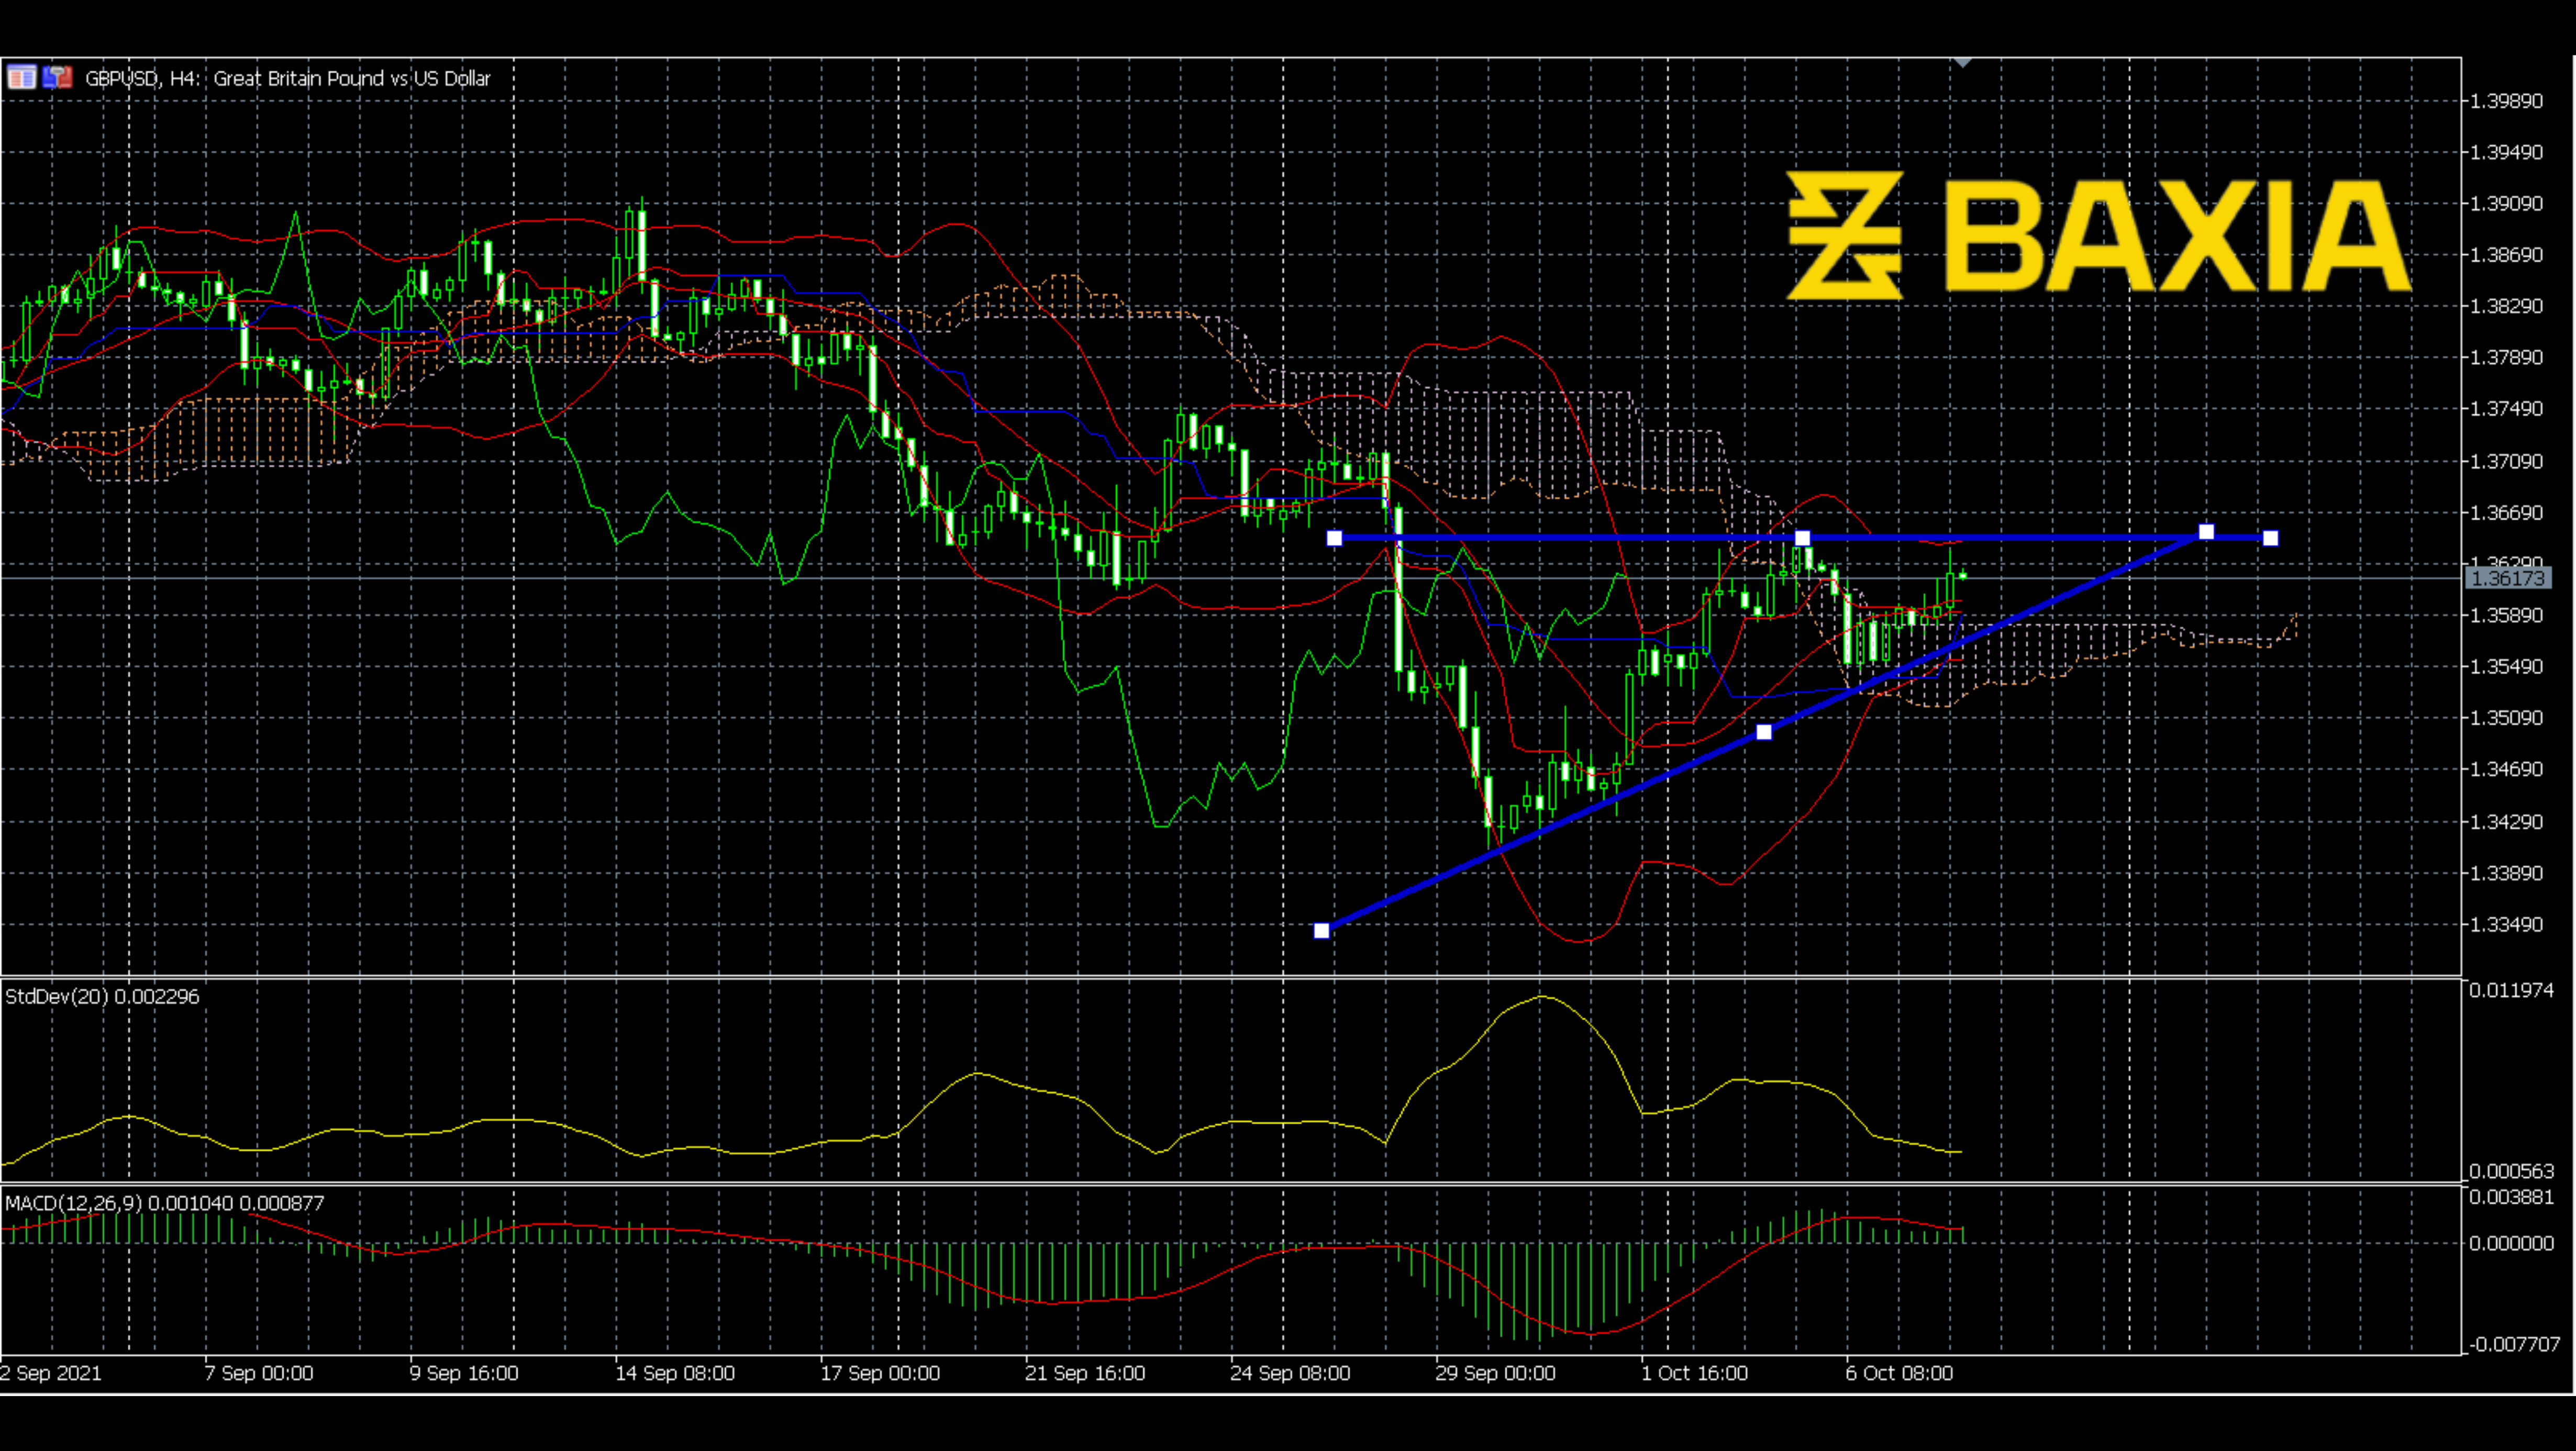
The descending triangle pattern is considered a bearish signal. The price would break down when the triangle is finished. And now, from this 4-hour plot, we can see that the triangle is coming to an end. Will the price break down as we expected?
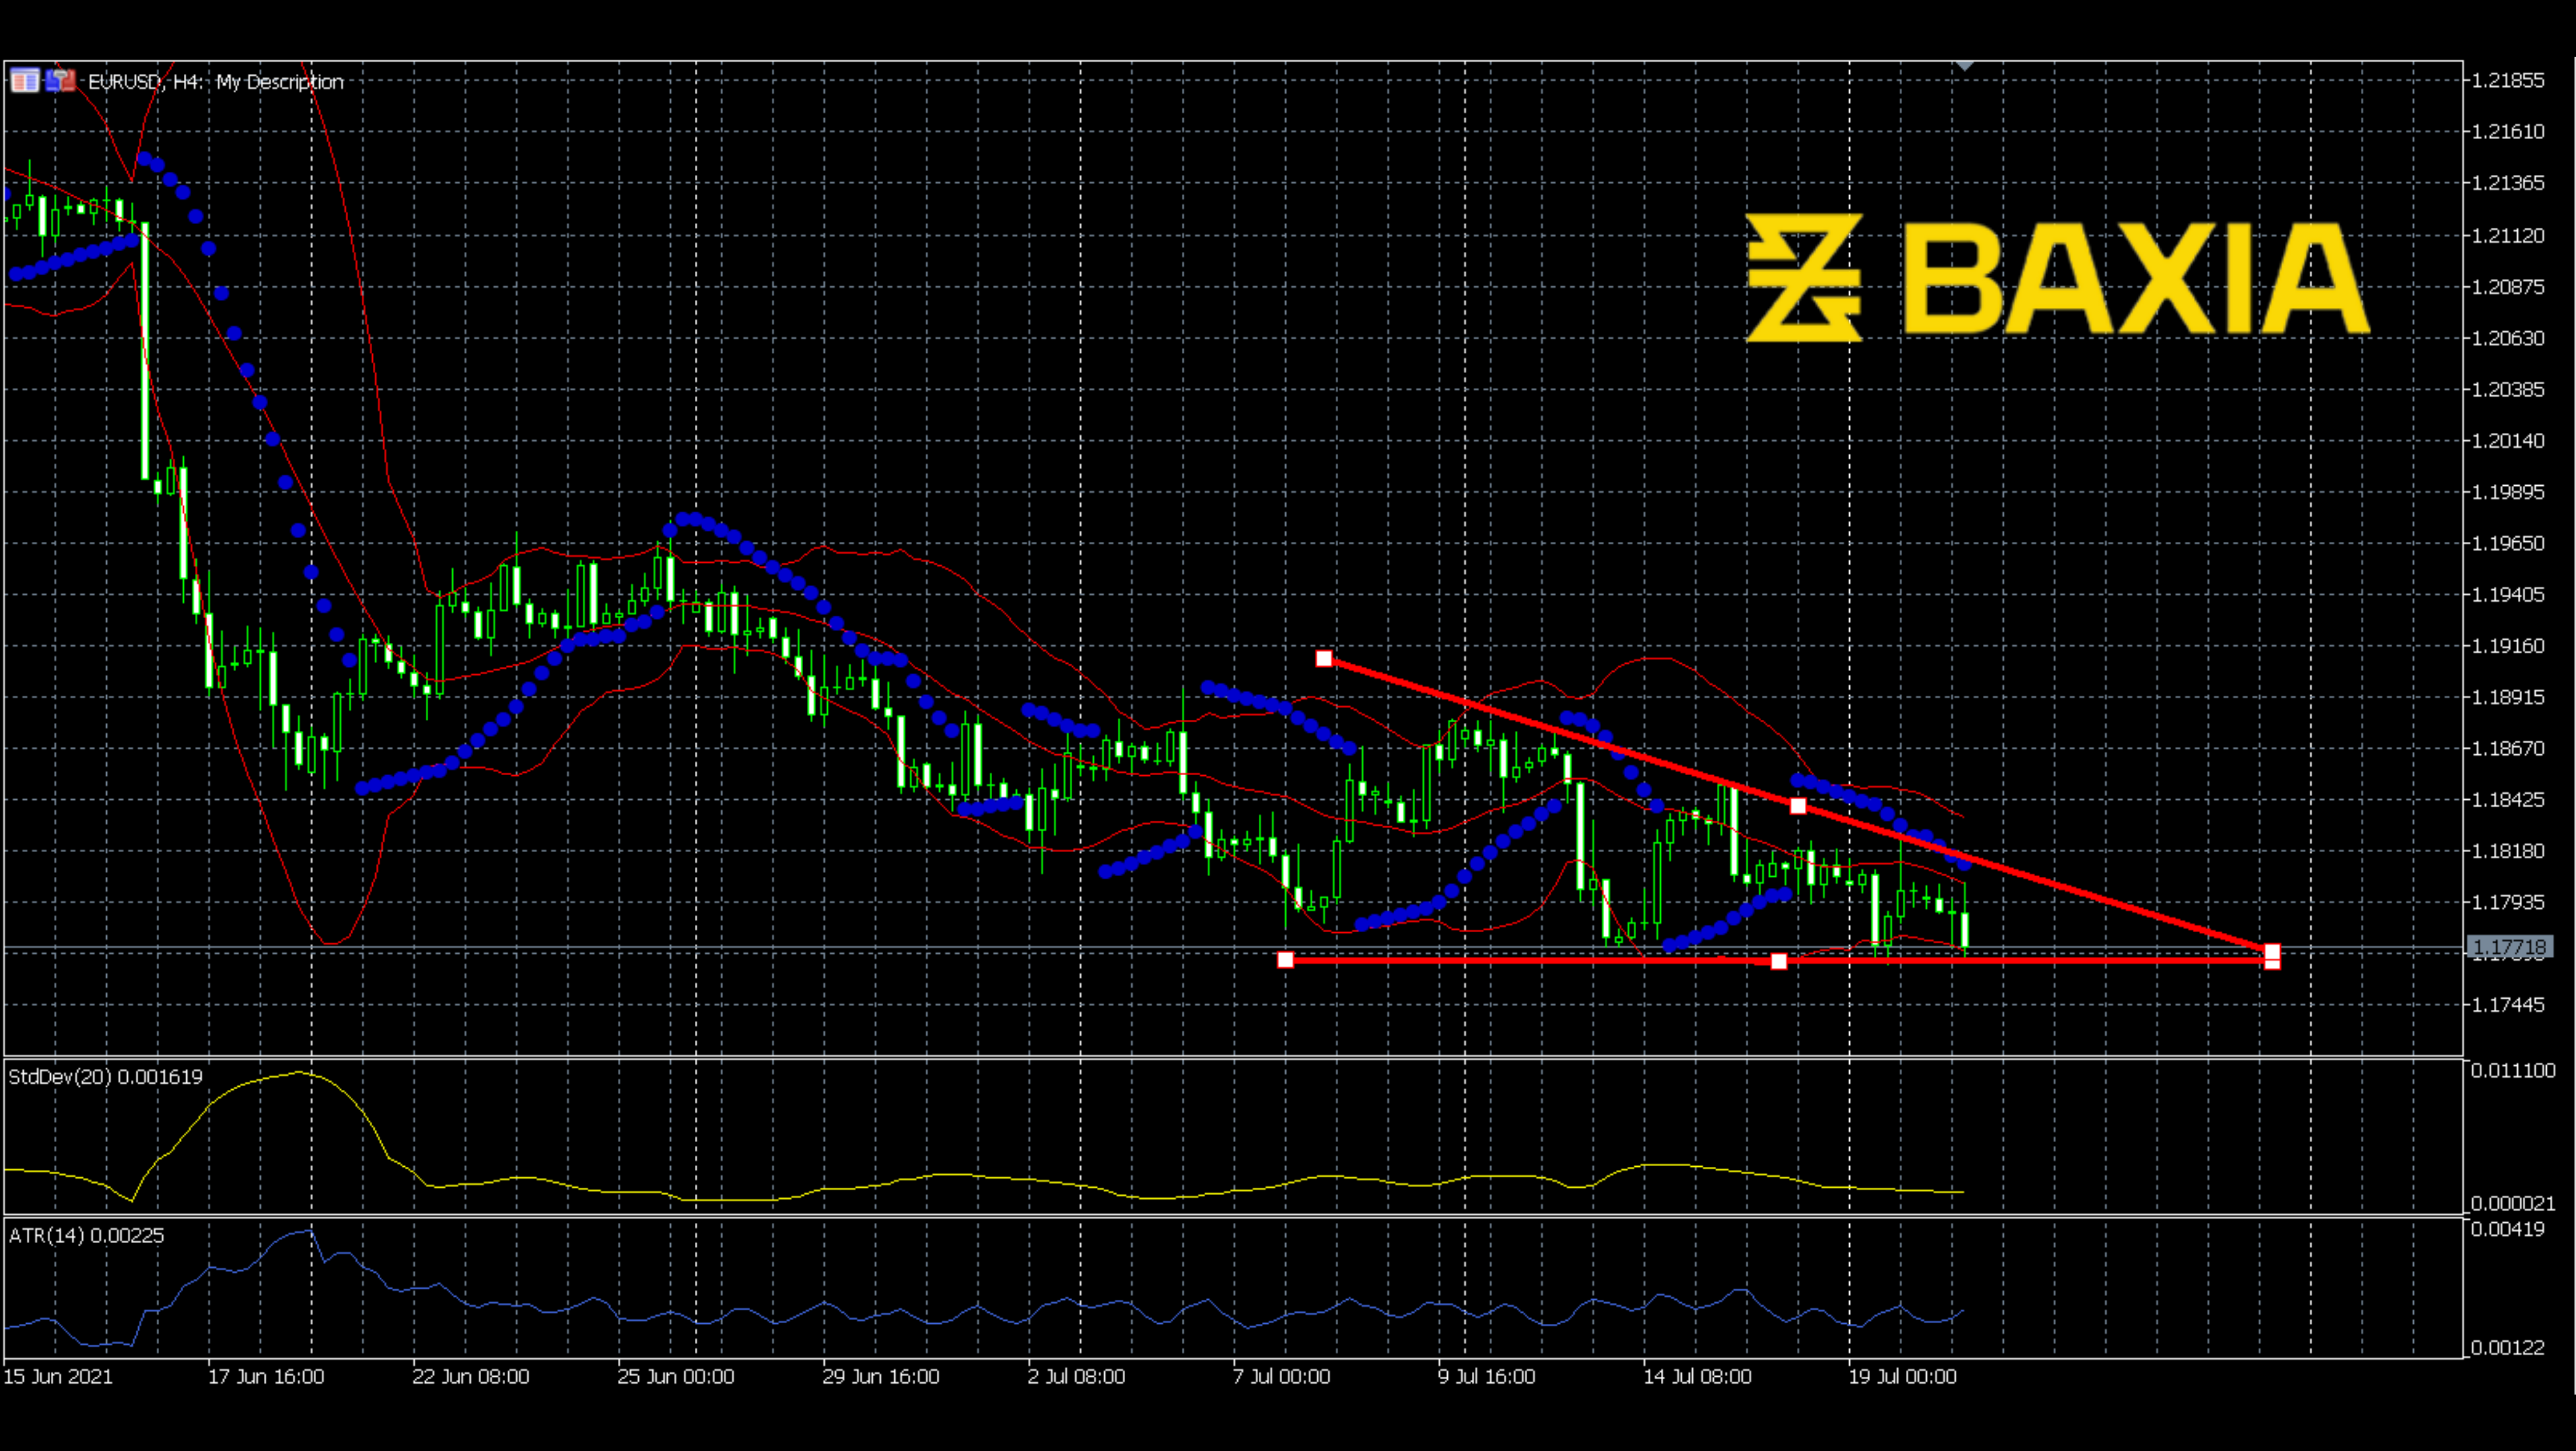
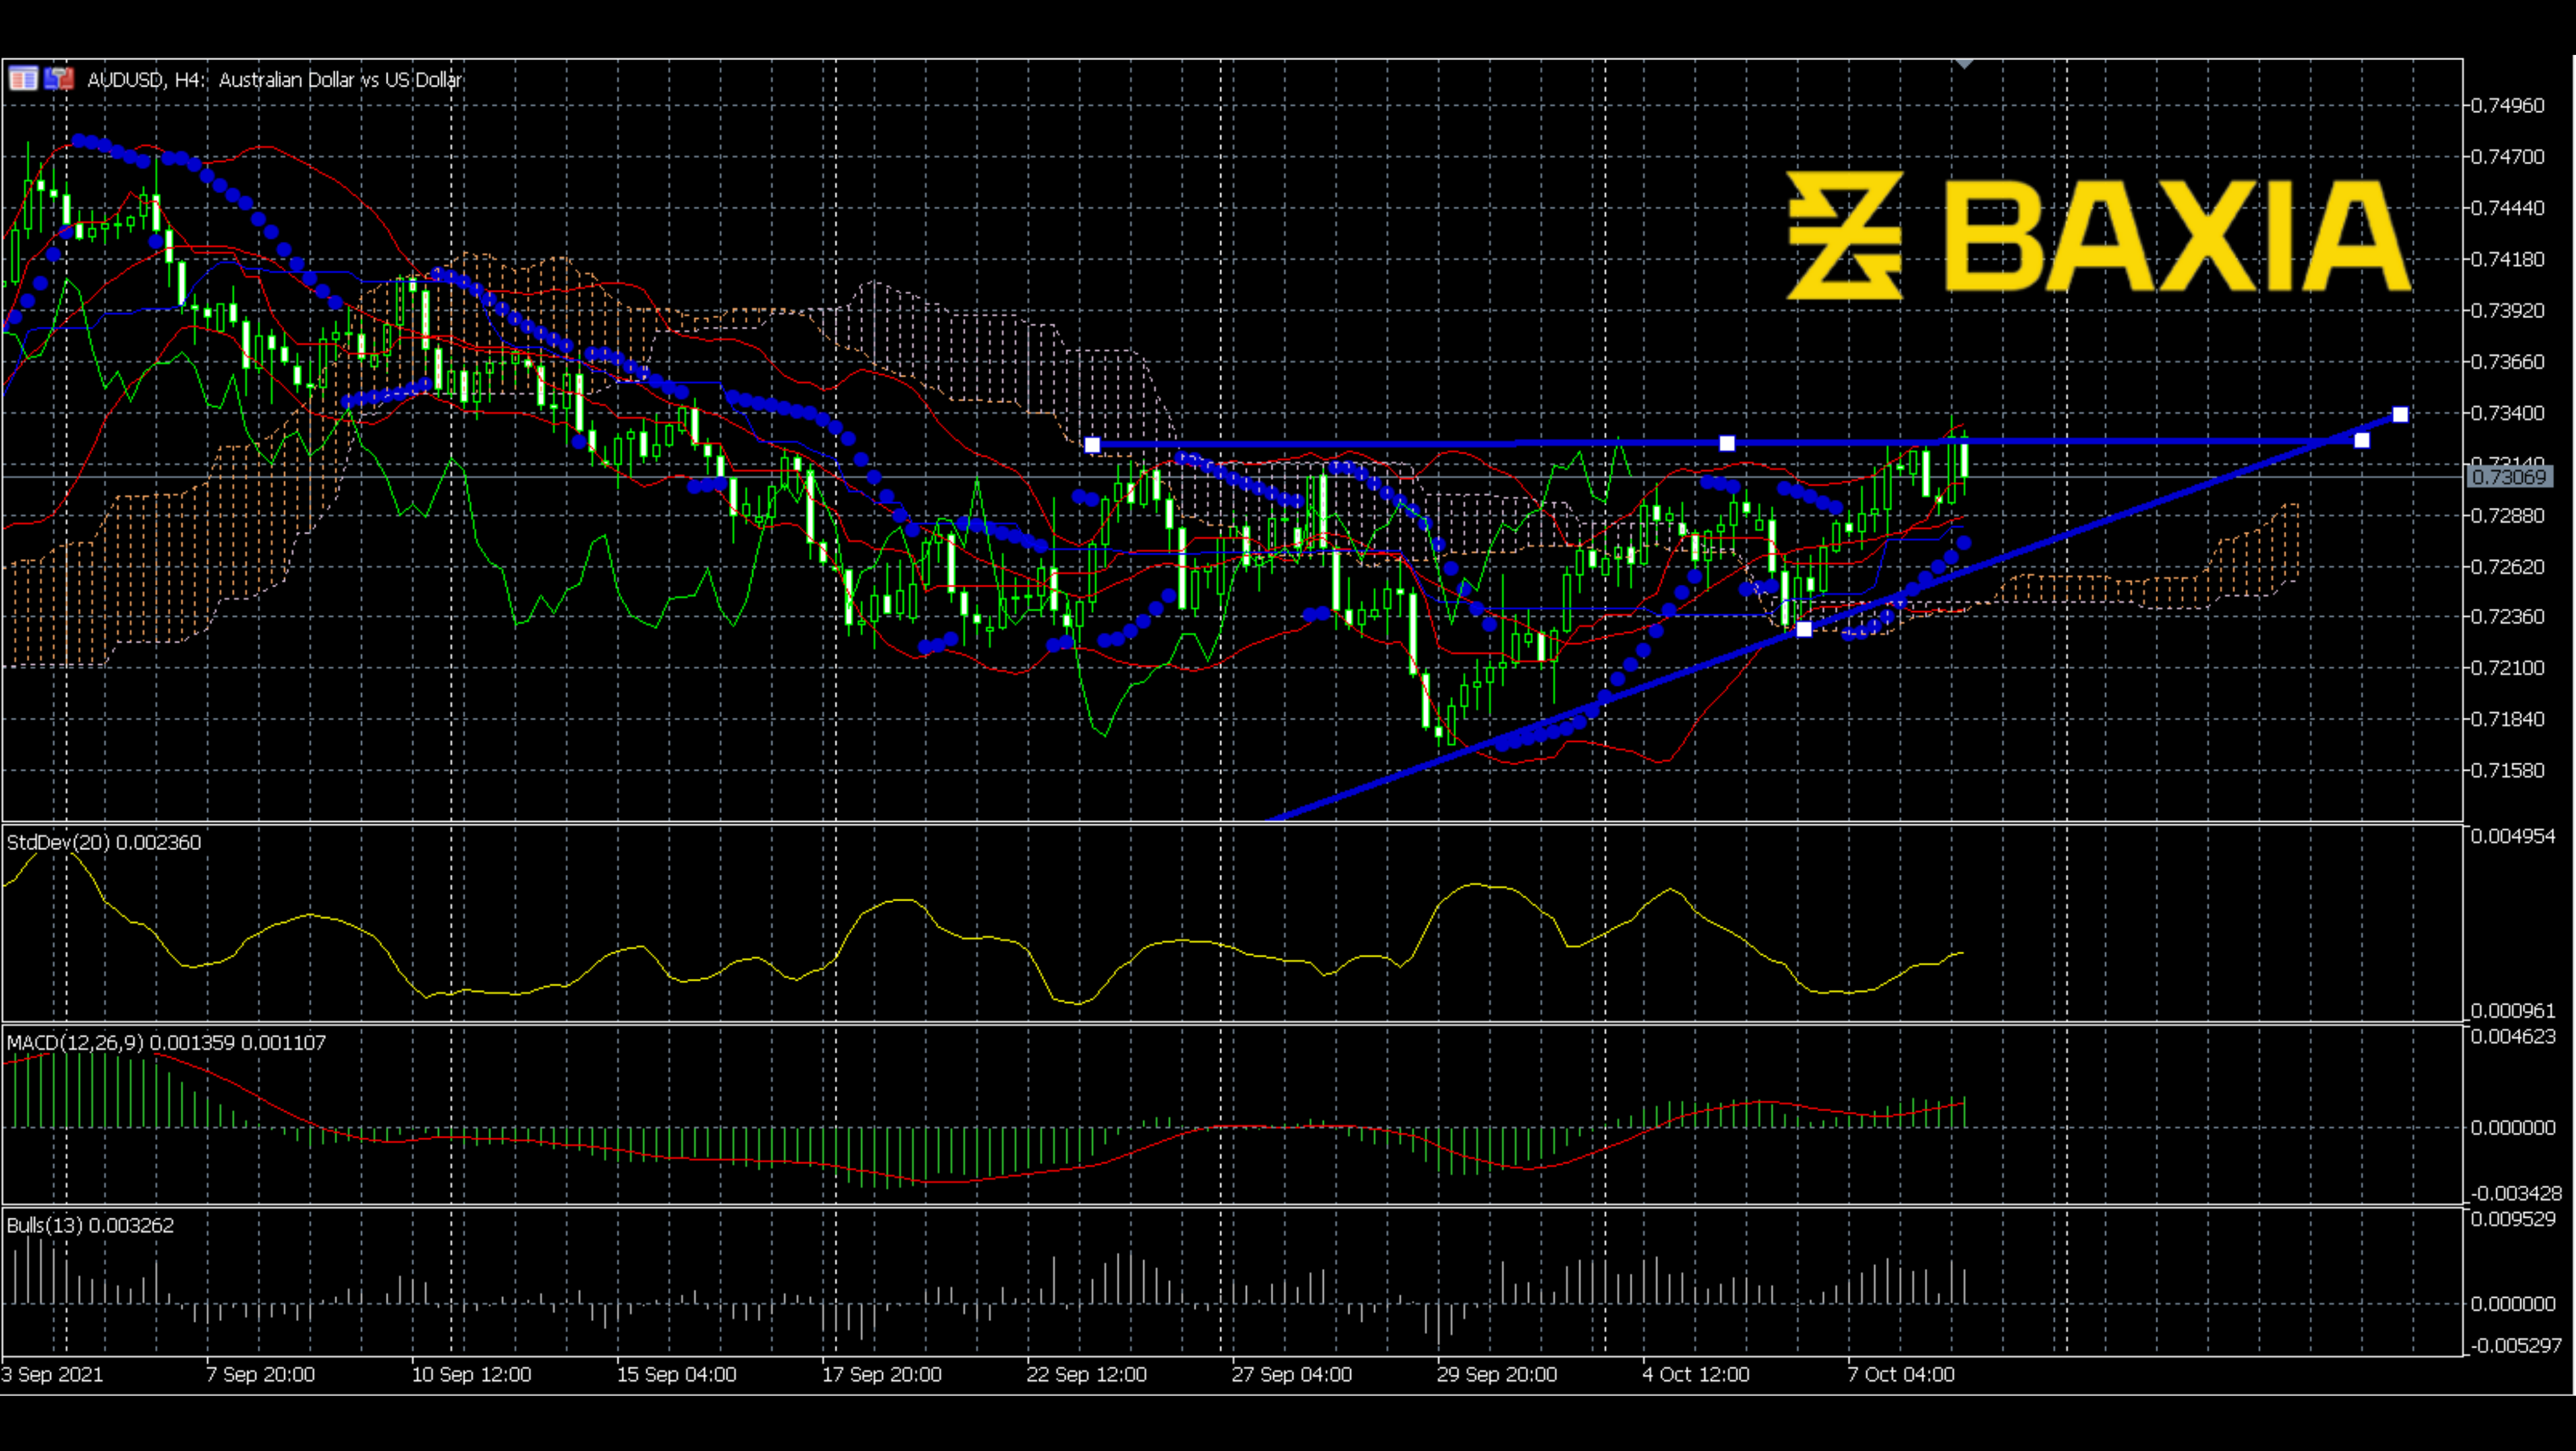
The parabolic SAR made the apparent path of the trend. The waves are getting weaker and weaker. The downward movements seem to be steeper than the upper movements. And the price has tested the lower band of the Bollinger Bands several times, which means the price is trying to break down.
We love to hear new ideas from traders and want to know what you think!
If you like this topic and want to suggest future topics that you find helpful, let us know by clicking the ‘submit your feedback’ button below.

Trading foreign exchange on margin carries a high level of risk, and may not be suitable for all investors. Before deciding to trade foreign exchange you should carefully consider your investment objectives, level of experience, and risk appetite.
Nothing contained in this website should be construed as investment advice. Any reference to an investment's past or potential performance is not, and should not be construed as, a recommendation or as a guarantee of any specific outcome or profit.