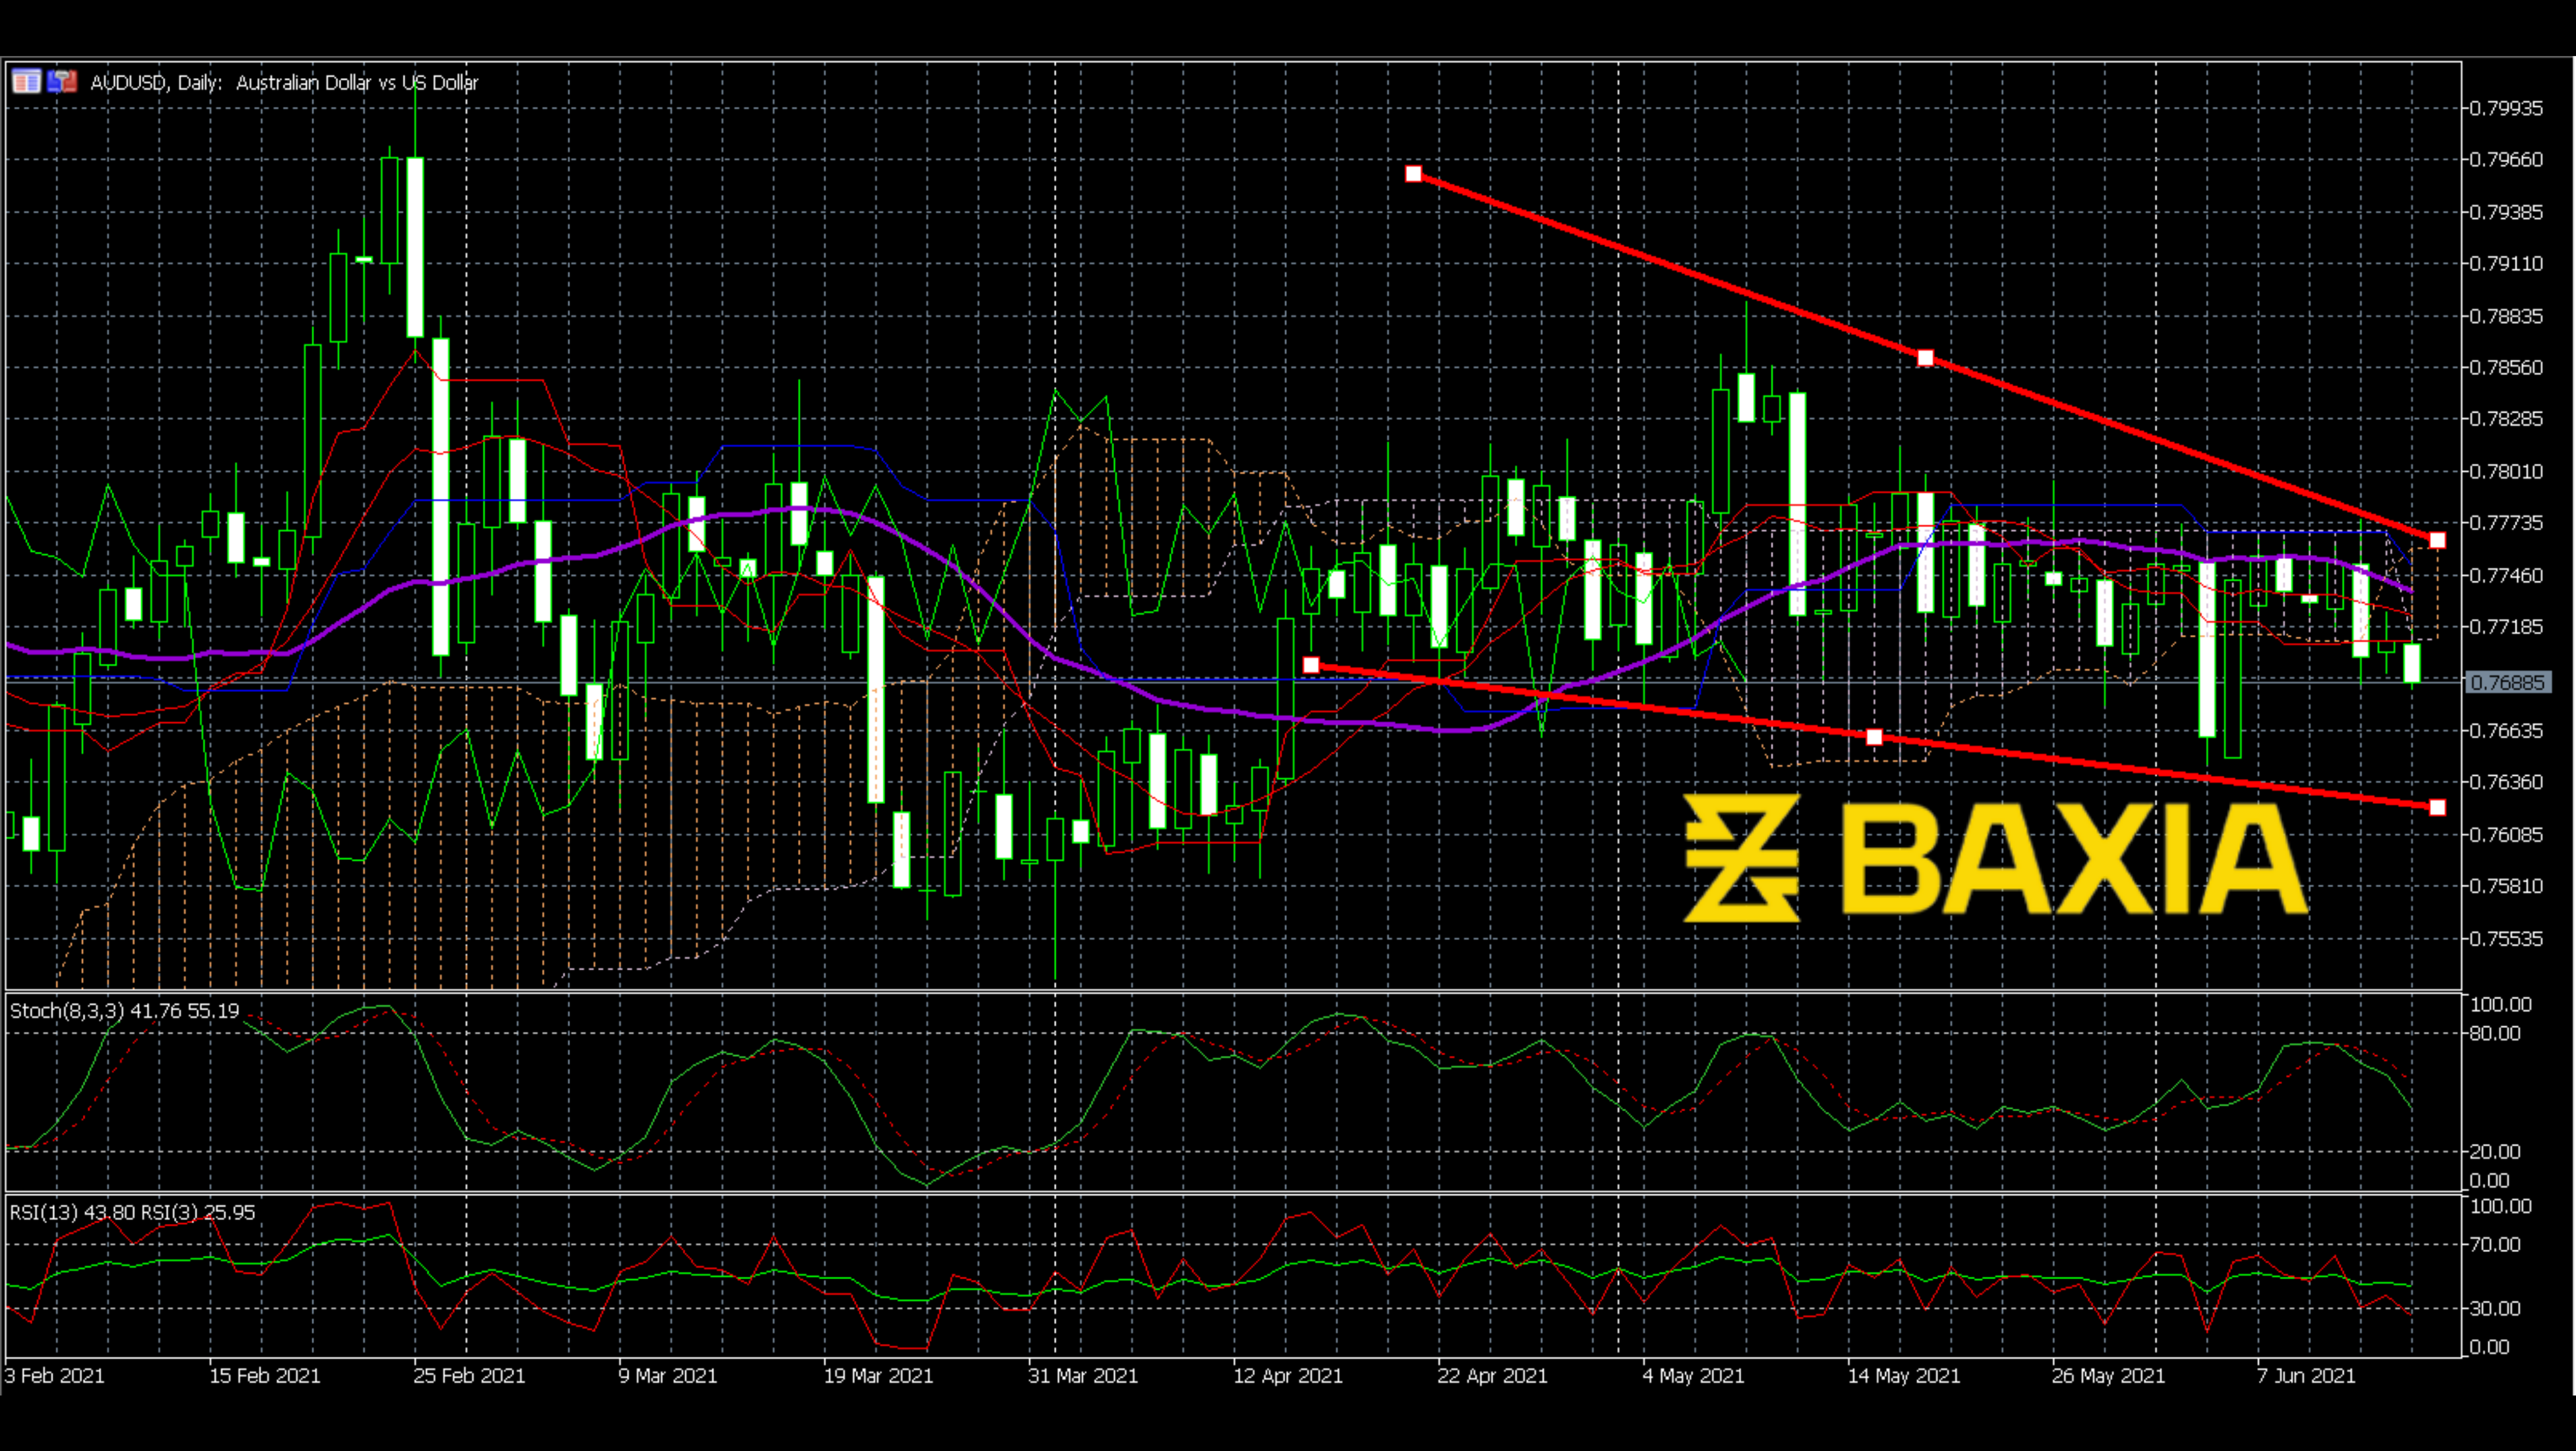

As can be seen, the price has gone through a sharp crash since May 28th. The price line broke the Ichimoku cloud in just three days. Also, the steep angle can be seen from Parabolic SAR; the dots were falling sharply. There is no doubt that the price held a solid downward power; so, would this power continue?
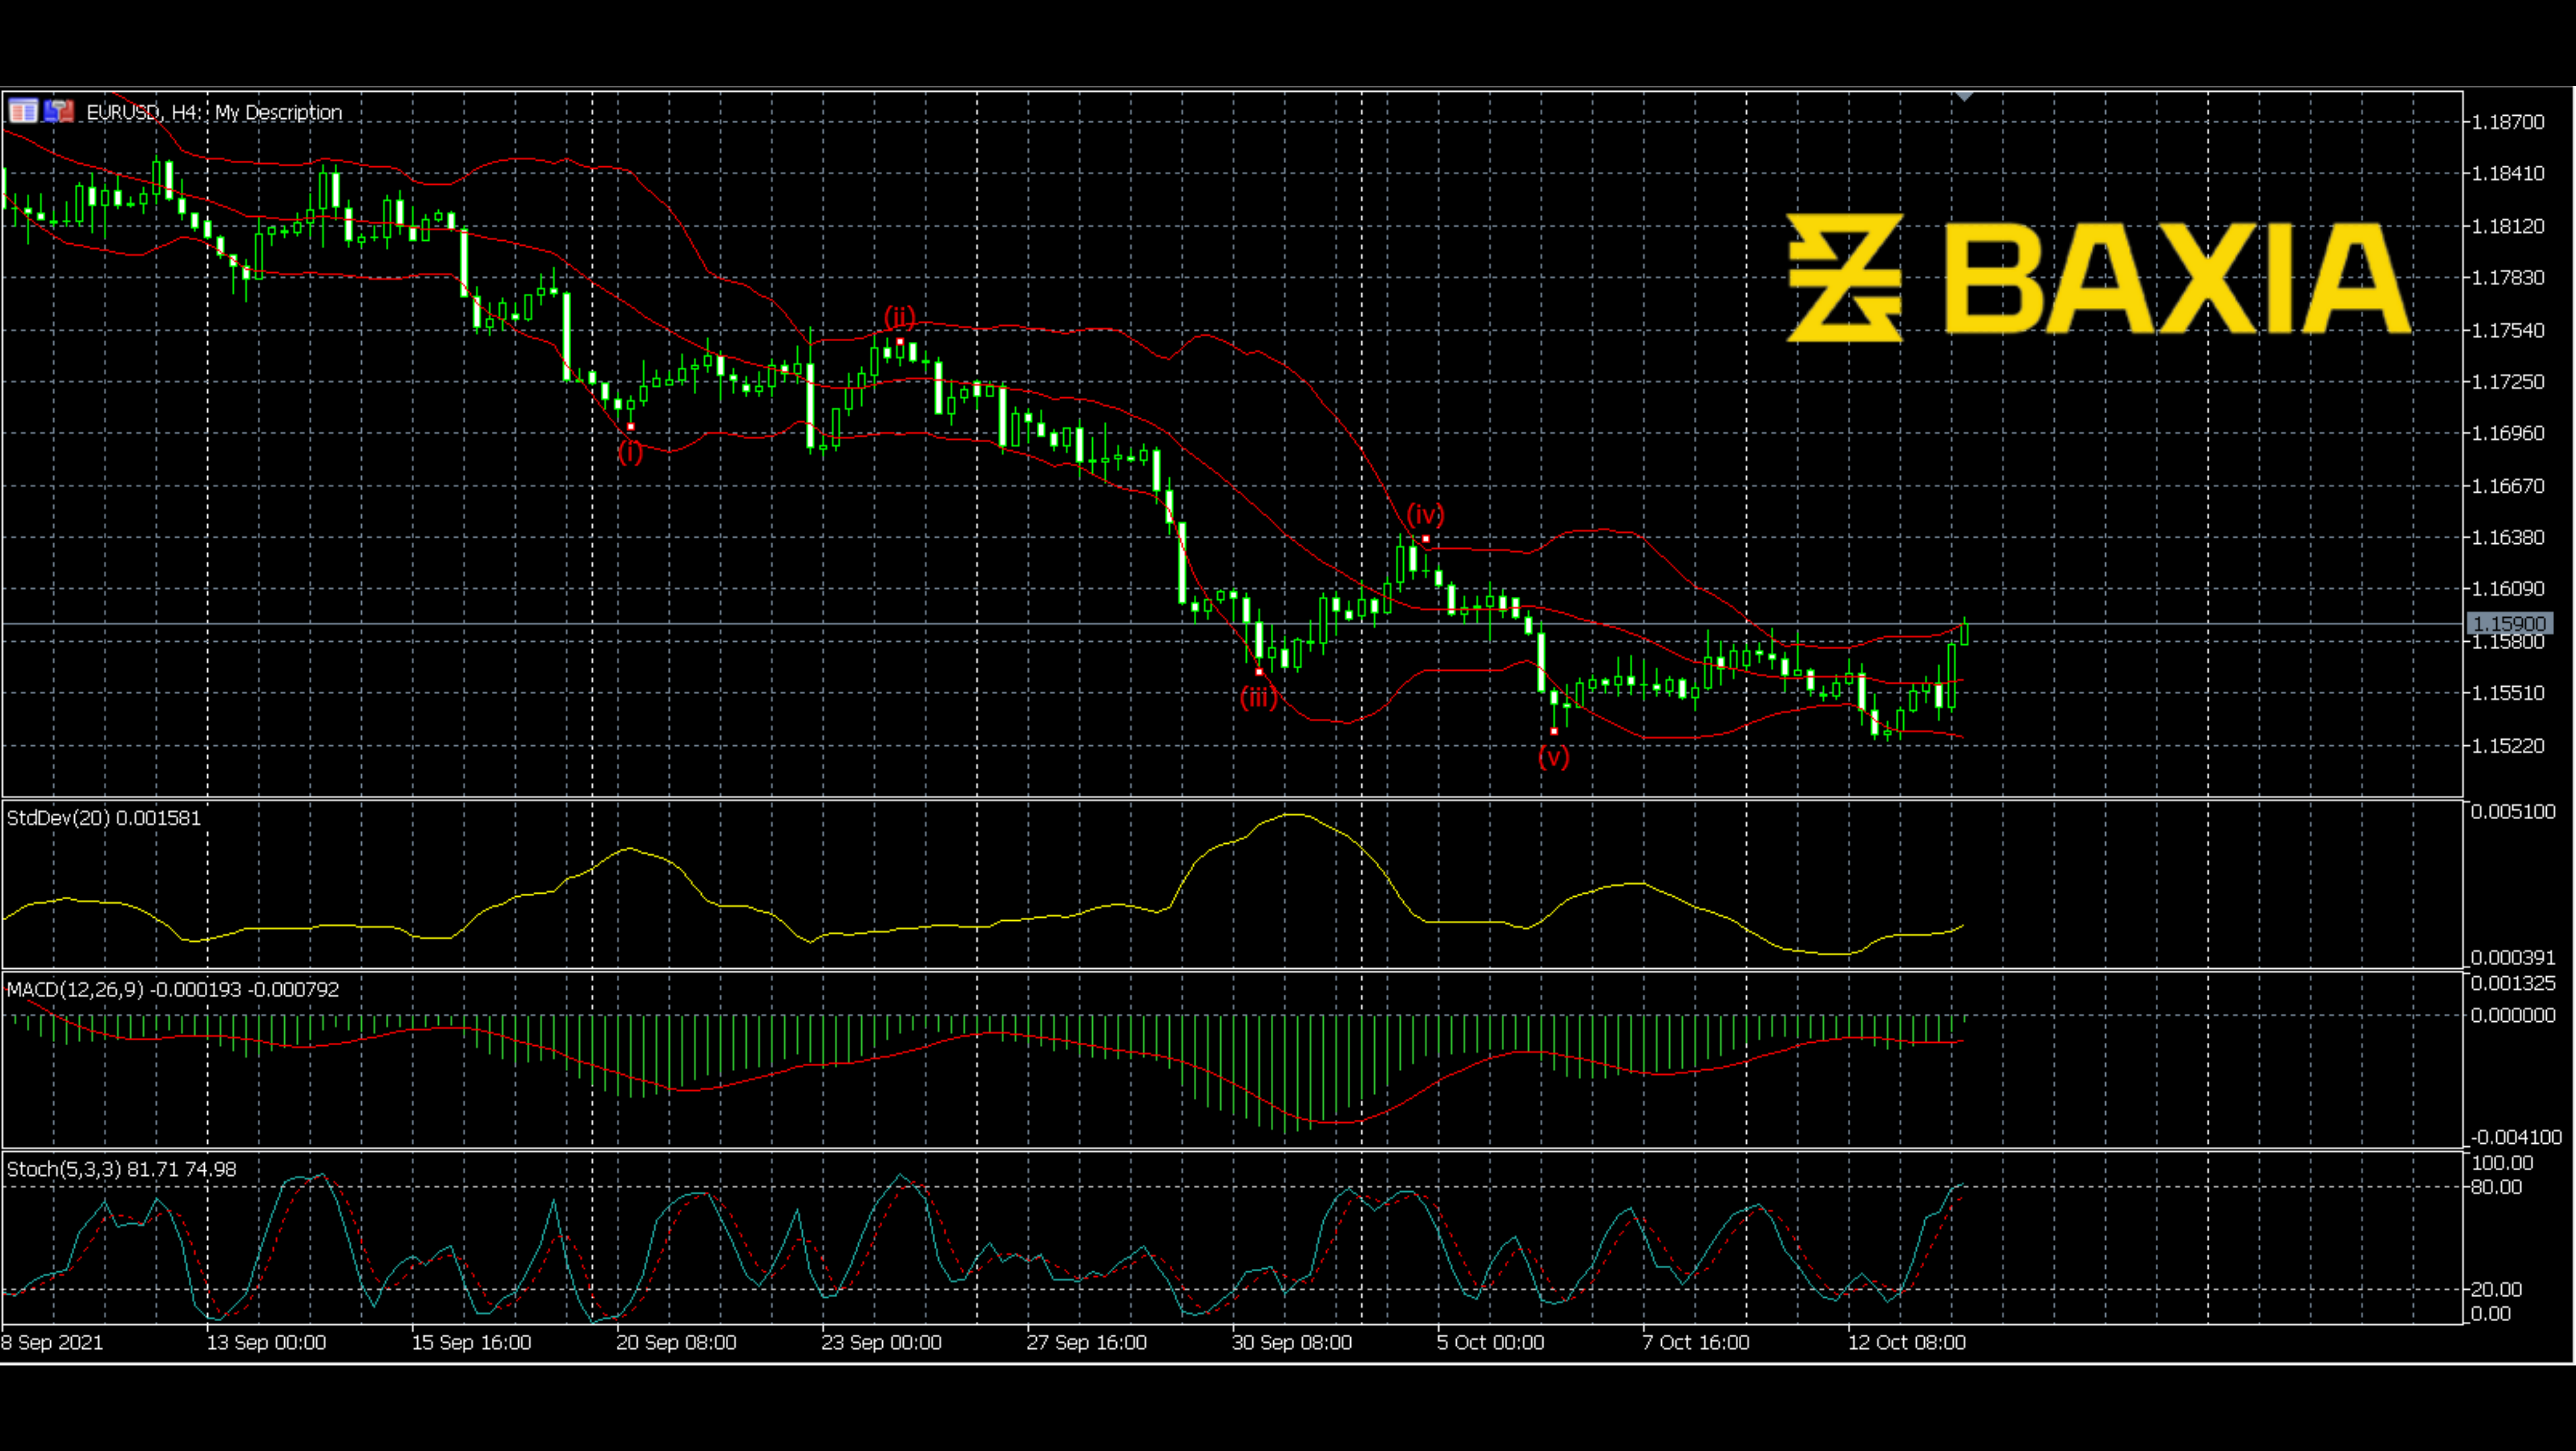
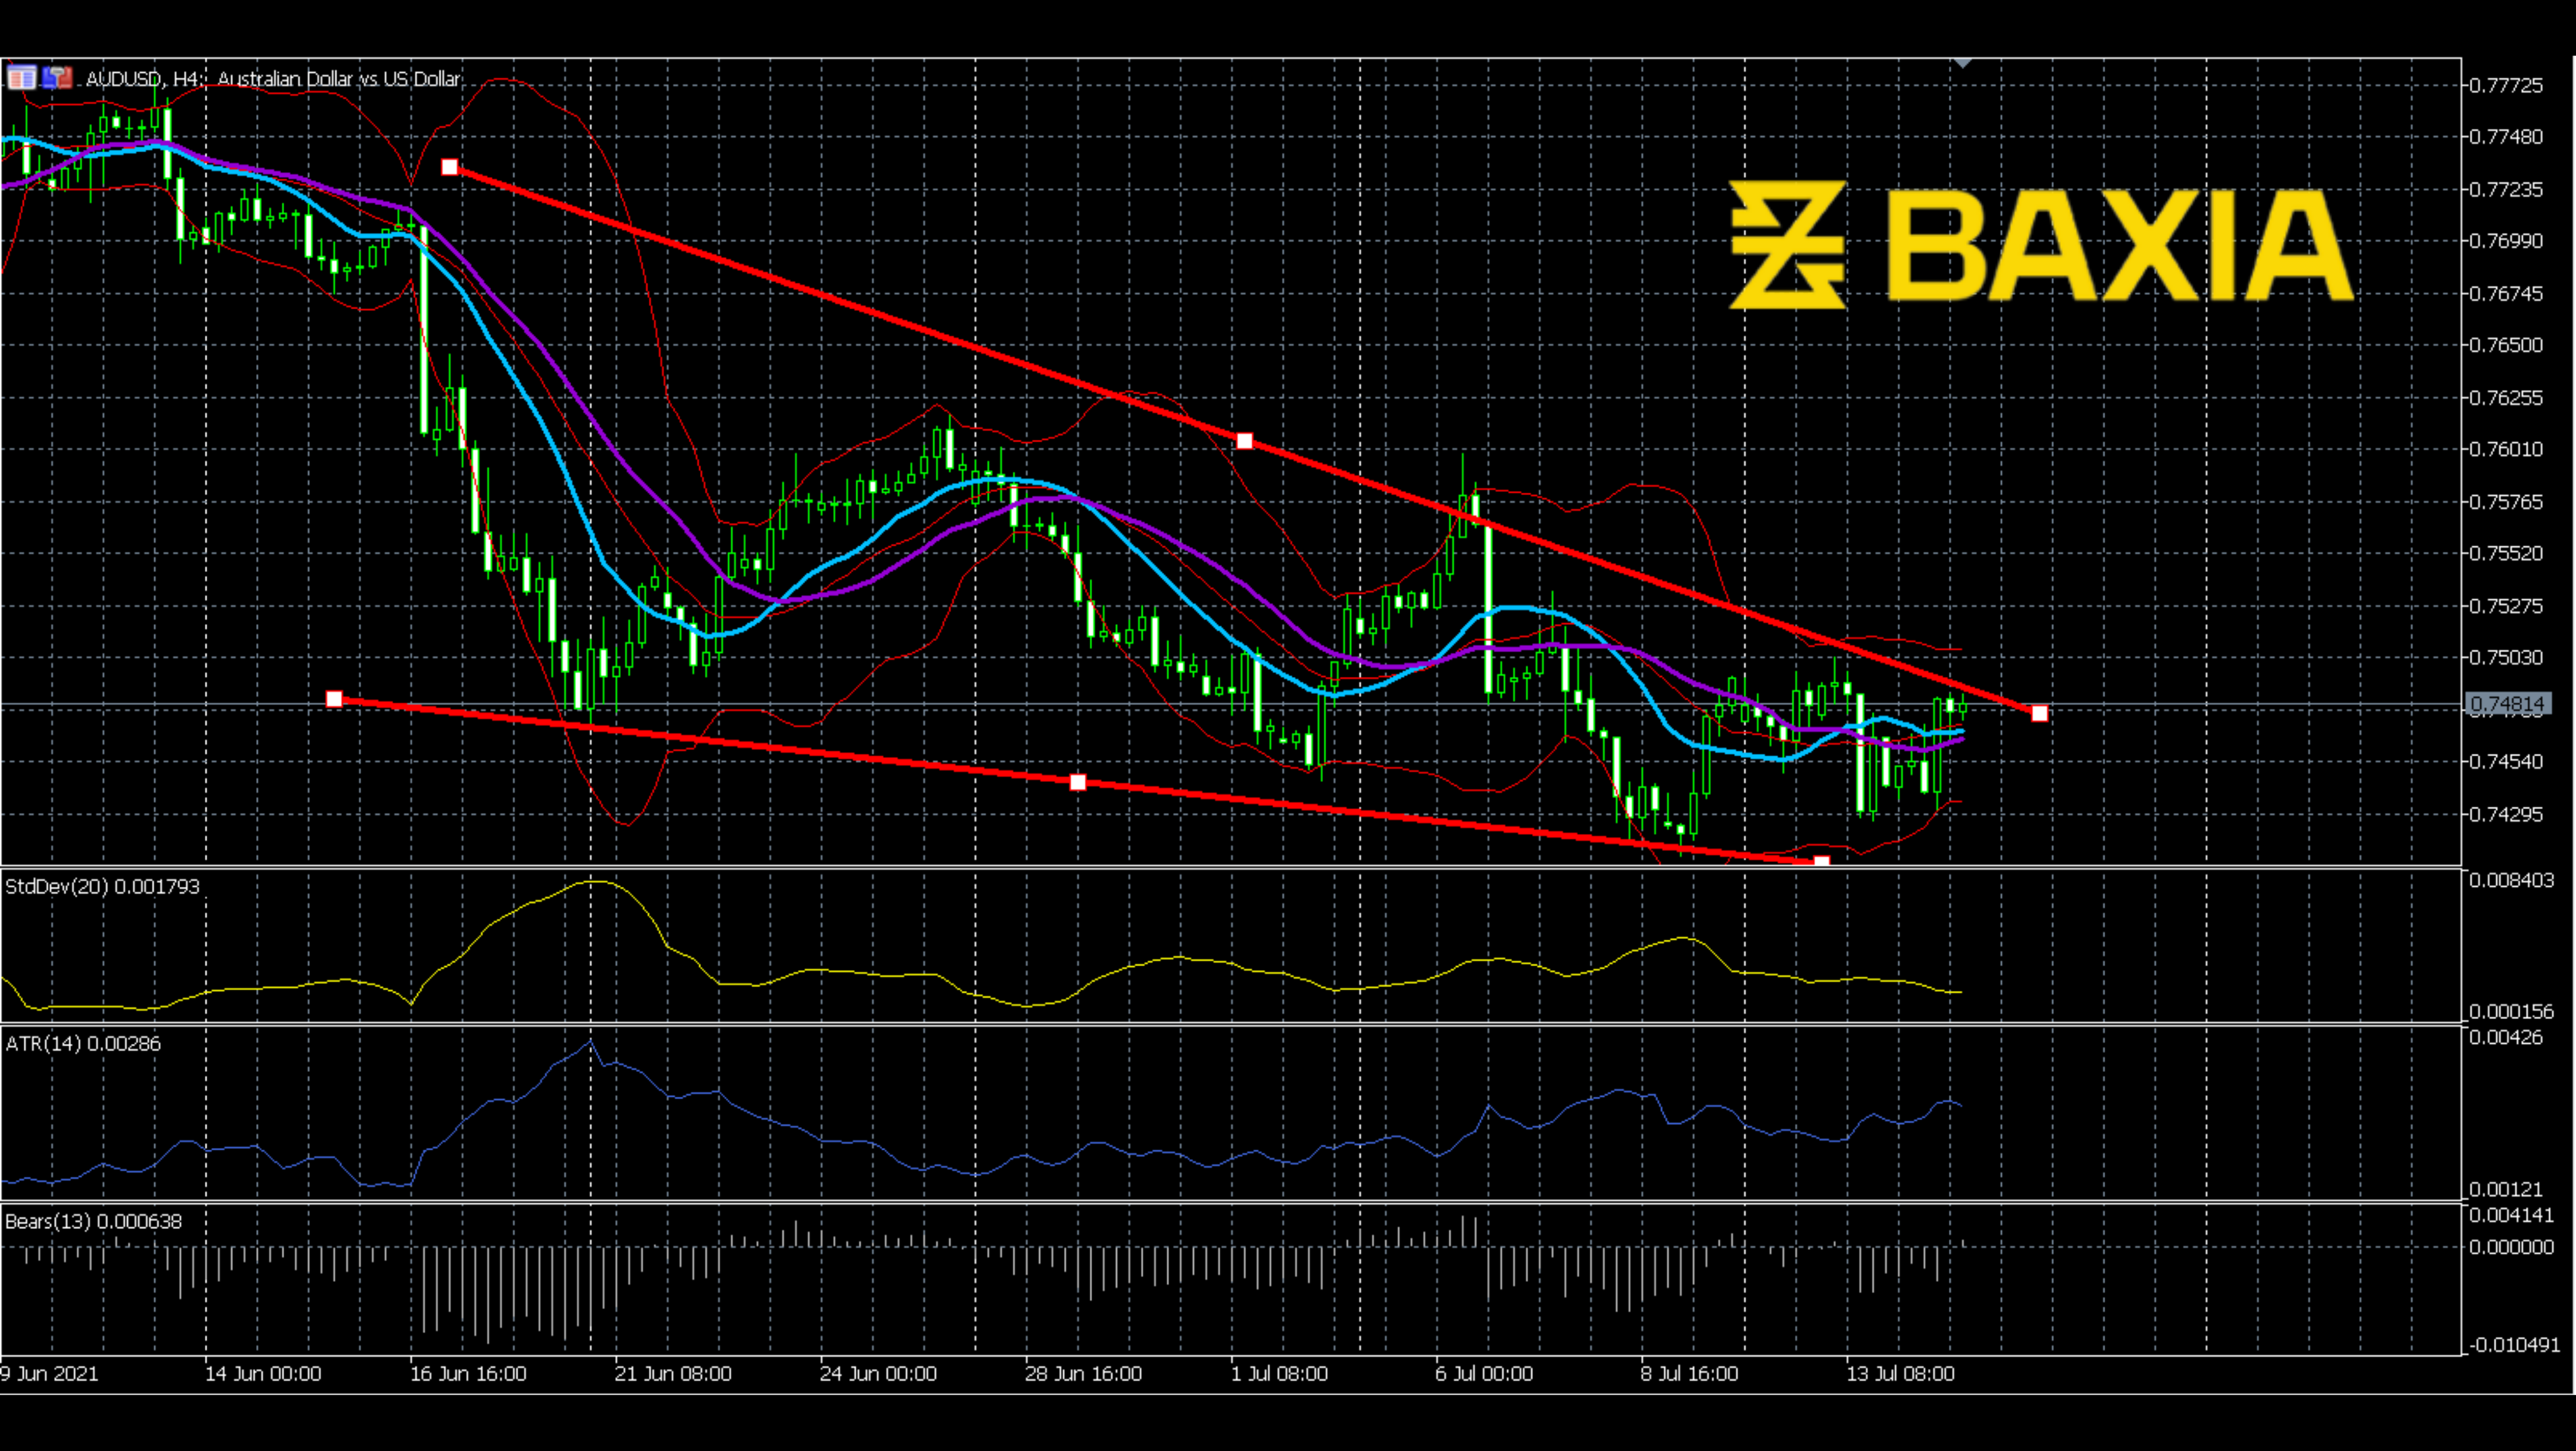
Recently, the price has been making small waves. Since Jul 13th, the price has made two waves, and both of them ended lower than the beginning. Does this pattern look familiar? This price line is building a falling wedge. As we know, a falling wedge is a bullish signal. The price would break up after finish the wedge; so, will the price break up?
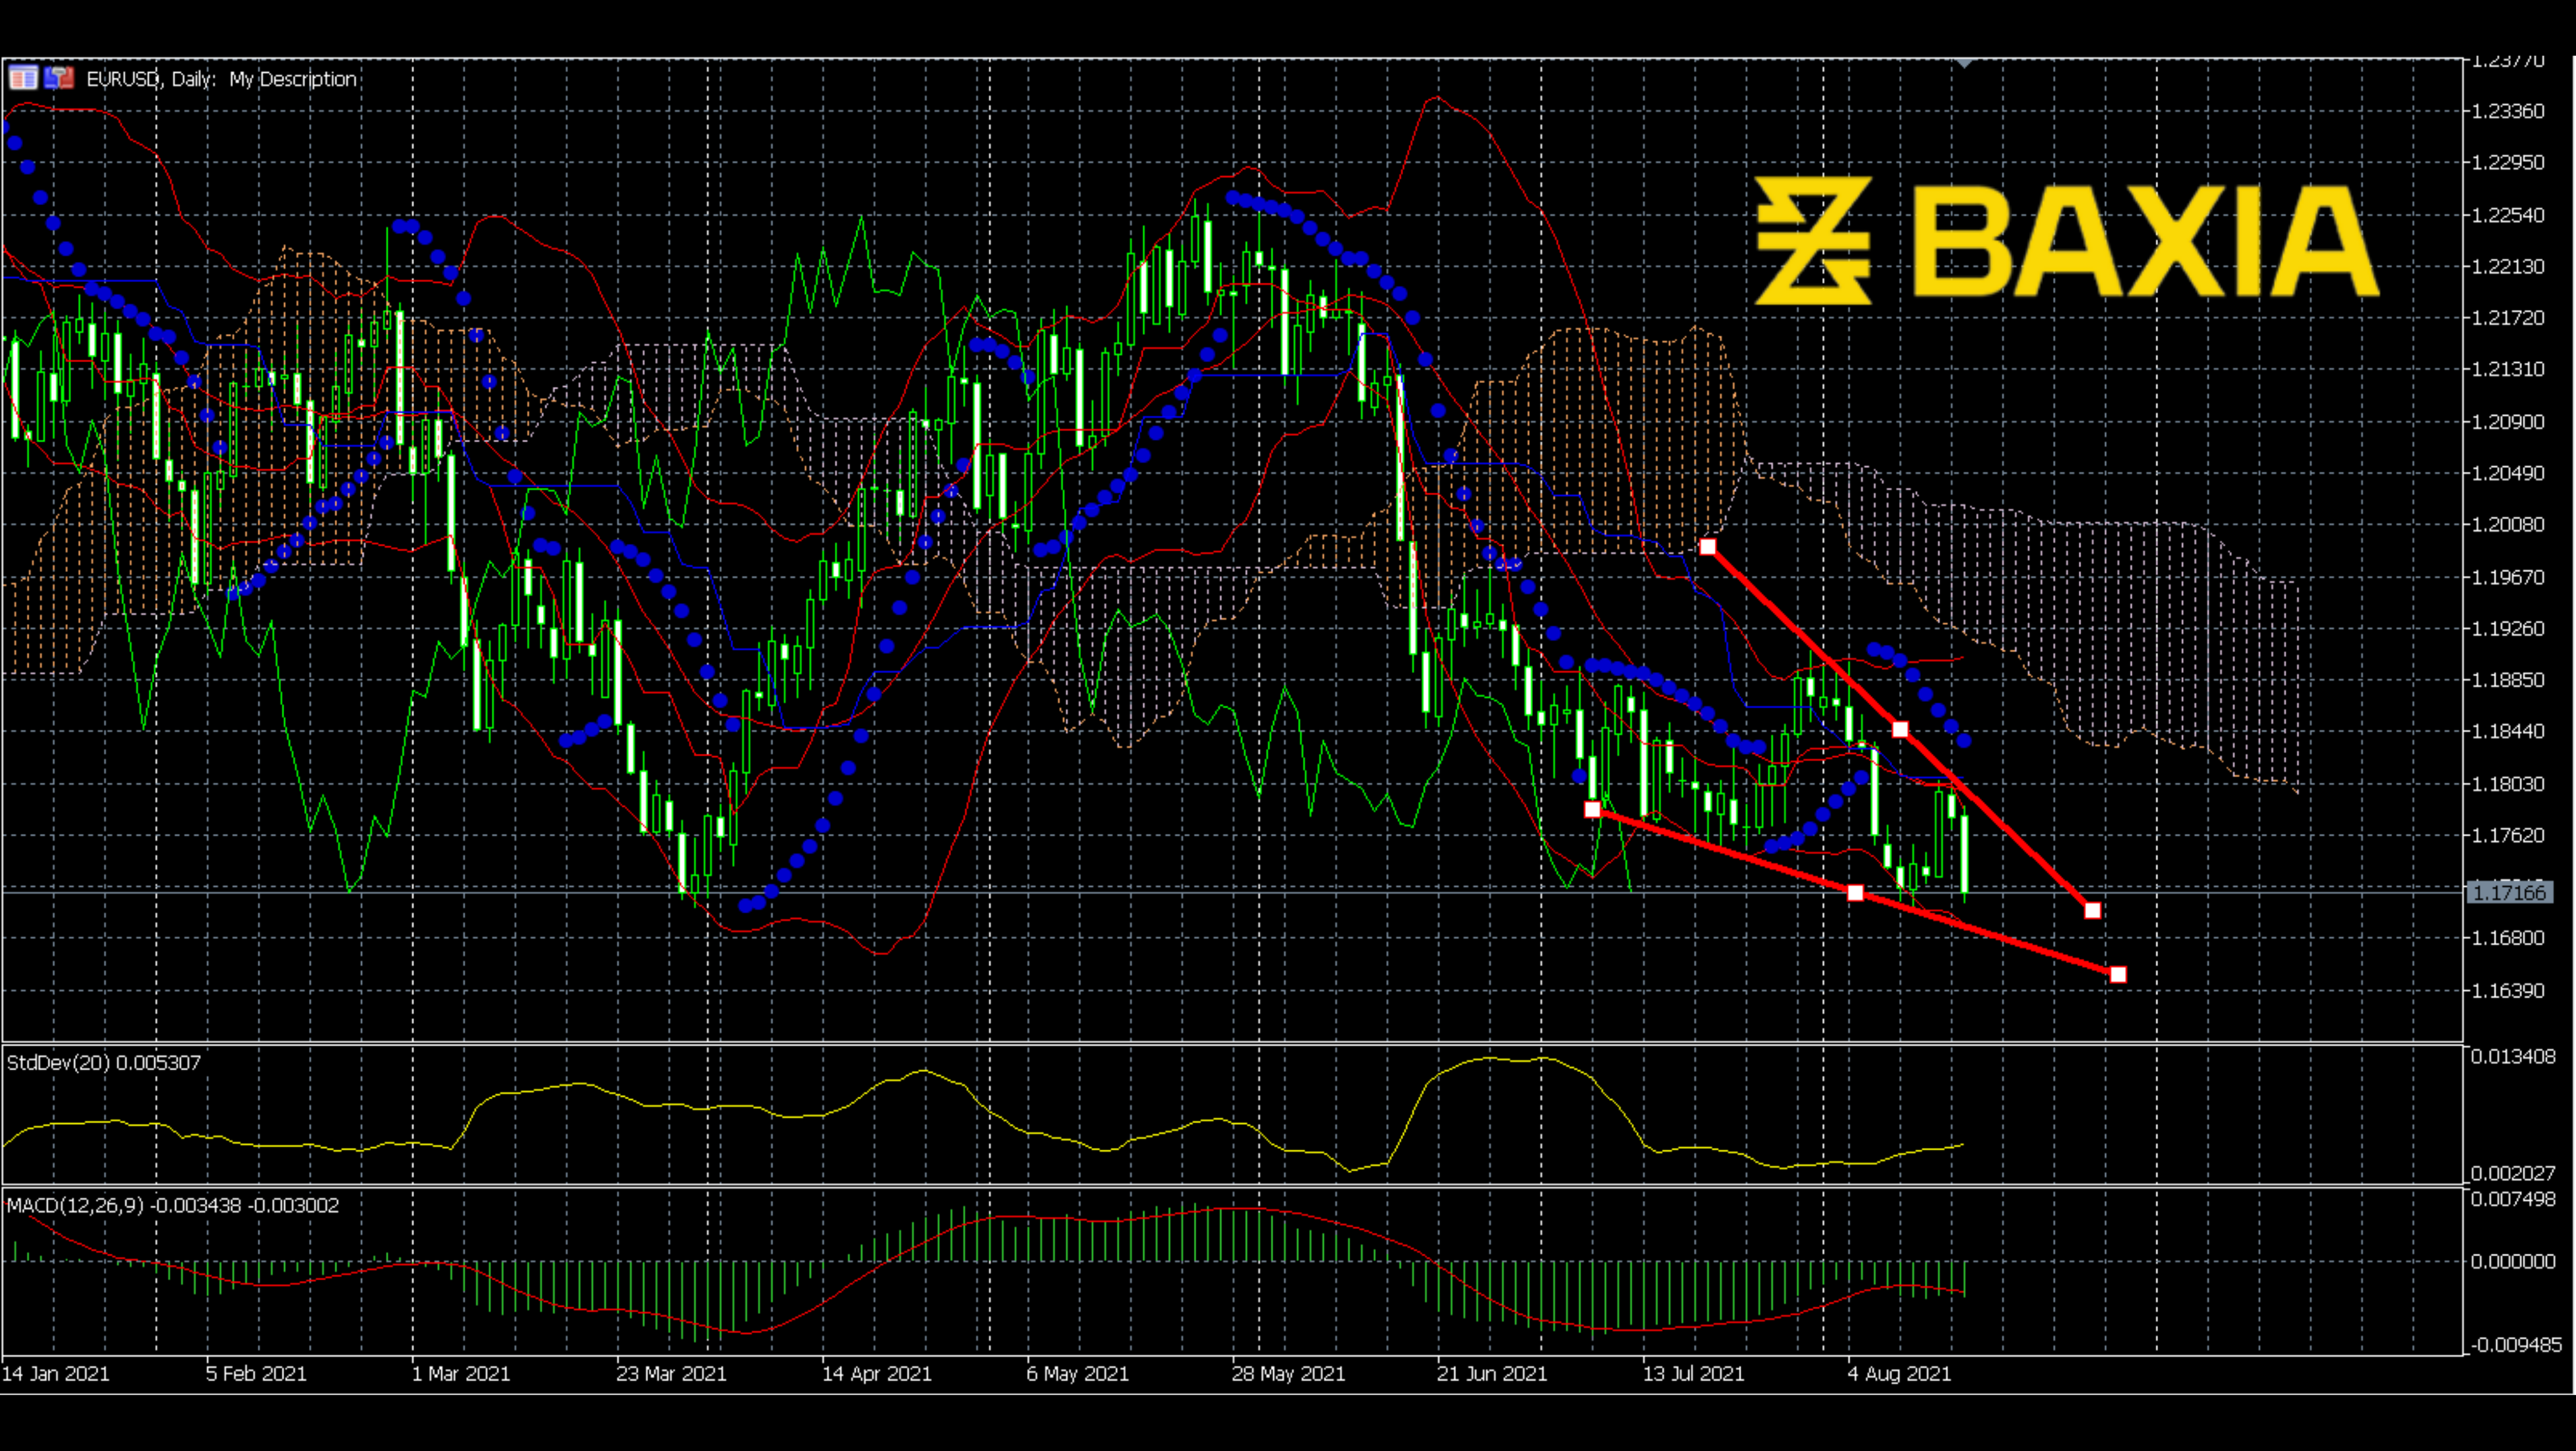
First, the Ichimoku gets thicker and goes down recently. If the price overlapped the Ichimoku, a breakout could take place soon. MACD is vague. But the Standard Deviation is going up, which means the price could make some big fluctuations.
We love to hear new ideas from traders and want to know what you think!
If you like this topic and want to suggest future topics that you find helpful, let us know by clicking the ‘submit your feedback’ button below.

Trading foreign exchange on margin carries a high level of risk, and may not be suitable for all investors. Before deciding to trade foreign exchange you should carefully consider your investment objectives, level of experience, and risk appetite.
Nothing contained in this website should be construed as investment advice. Any reference to an investment's past or potential performance is not, and should not be construed as, a recommendation or as a guarantee of any specific outcome or profit.