
The price of AUDUSD has hovered around 0.772 since the beginning of the year 2021. Thus, no longwave, no significant trend. It seems like the price is struggling. Traders are looking forward to seeing a trend that can lead the trade. Luckily, we have a pattern now. The falling wedge pattern has been forming for 40 days. As we know, the falling Wedge is a signal for break up, so now, is this a time for a breakout? The support level is showing up, and the falling Wedge is welcoming the end.
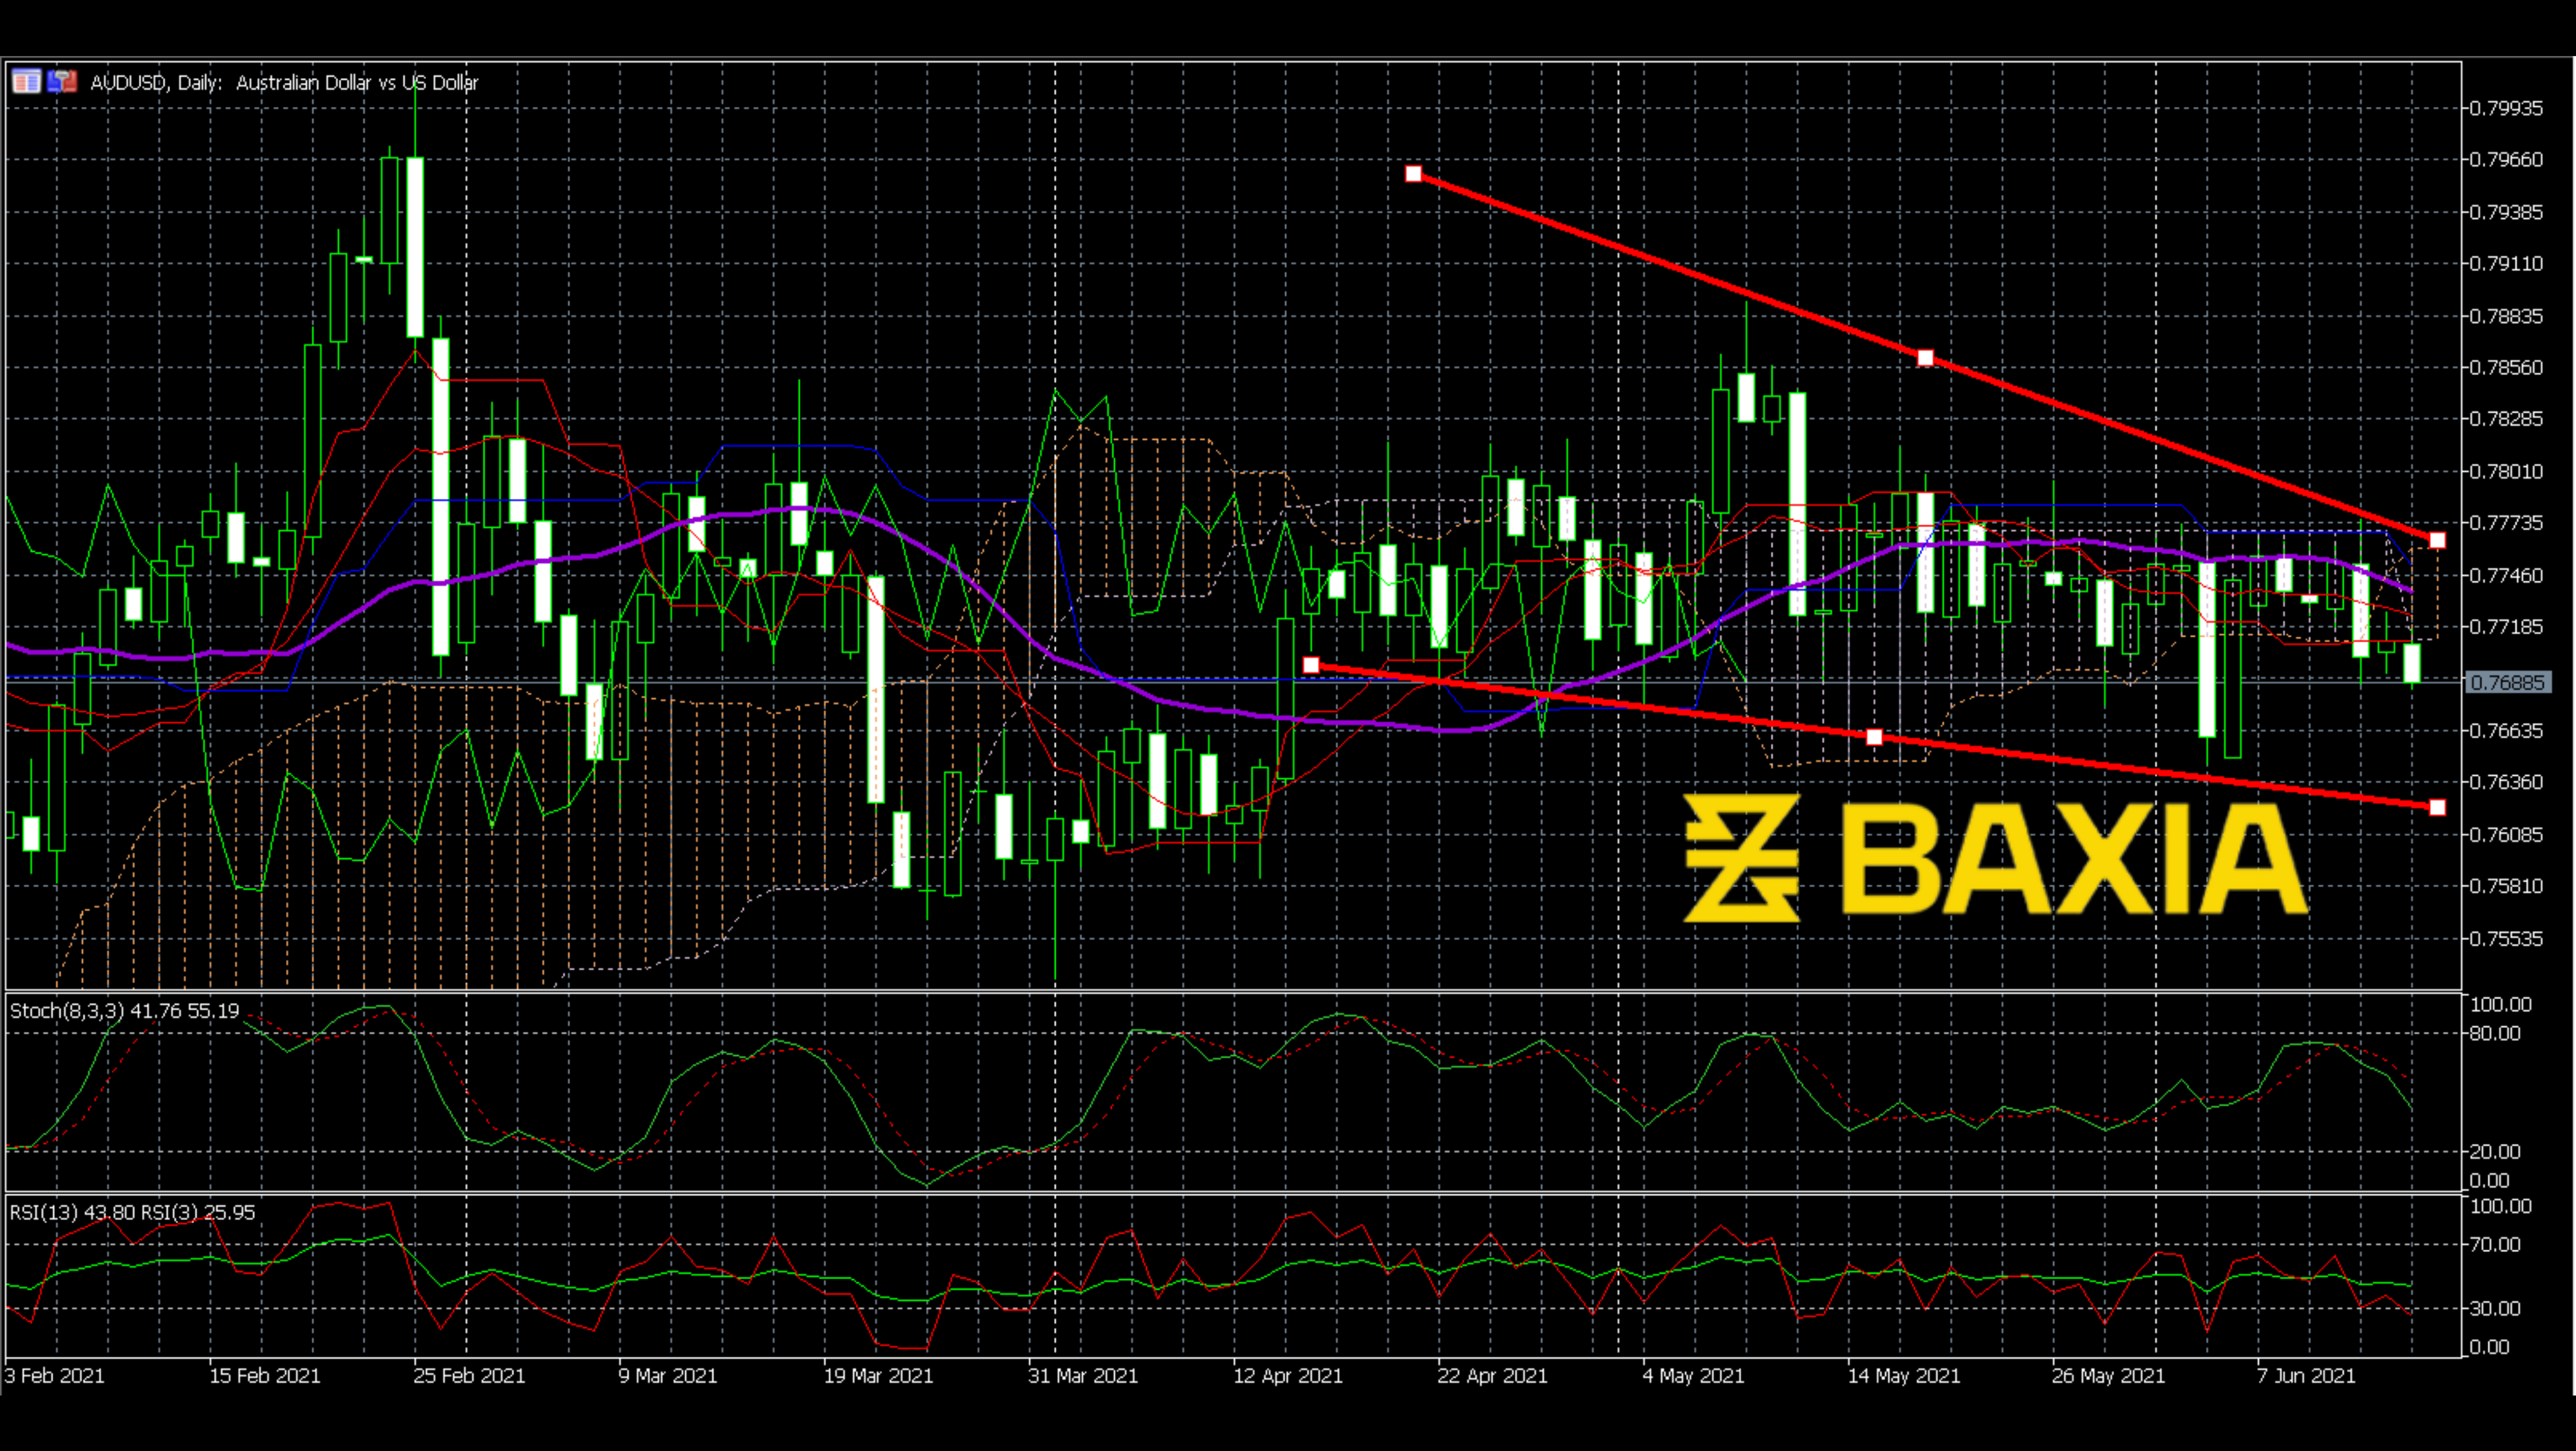
Since the pattern is a falling Wedge, the short-term trend is downward, most of the oscillators show the bearish signal. In addition, some indicators are lagged, like MACD. So, for a pattern like Wedges, we cannot just focus on the indicators. However, Ichimoku overlaps with the price line, which means the cloud may change the direction at any time. Therefore, I consider this as a breakout signal. The moving average is doing the same thing, overlaps with the price line; also, this could be considered a breakout signal.
We love to hear new ideas from traders and want to know what you think!
If you like this topic and want to suggest future topics that you find helpful, let us know by clicking the ‘submit your feedback’ button below.

Trading foreign exchange on margin carries a high level of risk, and may not be suitable for all investors. Before deciding to trade foreign exchange you should carefully consider your investment objectives, level of experience, and risk appetite.
Nothing contained in this website should be construed as investment advice. Any reference to an investment's past or potential performance is not, and should not be construed as, a recommendation or as a guarantee of any specific outcome or profit.