
The price of GBPUSD had been struggling around 1.414 for 30 days since May 17th, which was a stable and long trend. Then, the price has started to make a falling wedge since June 16th, till now, it is already 20 days; we can see that the price has almost finished the wedge. The falling wedge is a bull signal, and the price will break up when it finished the wedge pattern. Will the price bounce up as we expected on this falling wedge?
As we can see, the price is making its last wave, and the peak already beyond the 23.6 level Fibonacci. As I said, this is not the breakout; it’s a wave. The price started struggling at the last peak, and Stochastics shows that the price already overbought, which means the next step must be a bounce back.
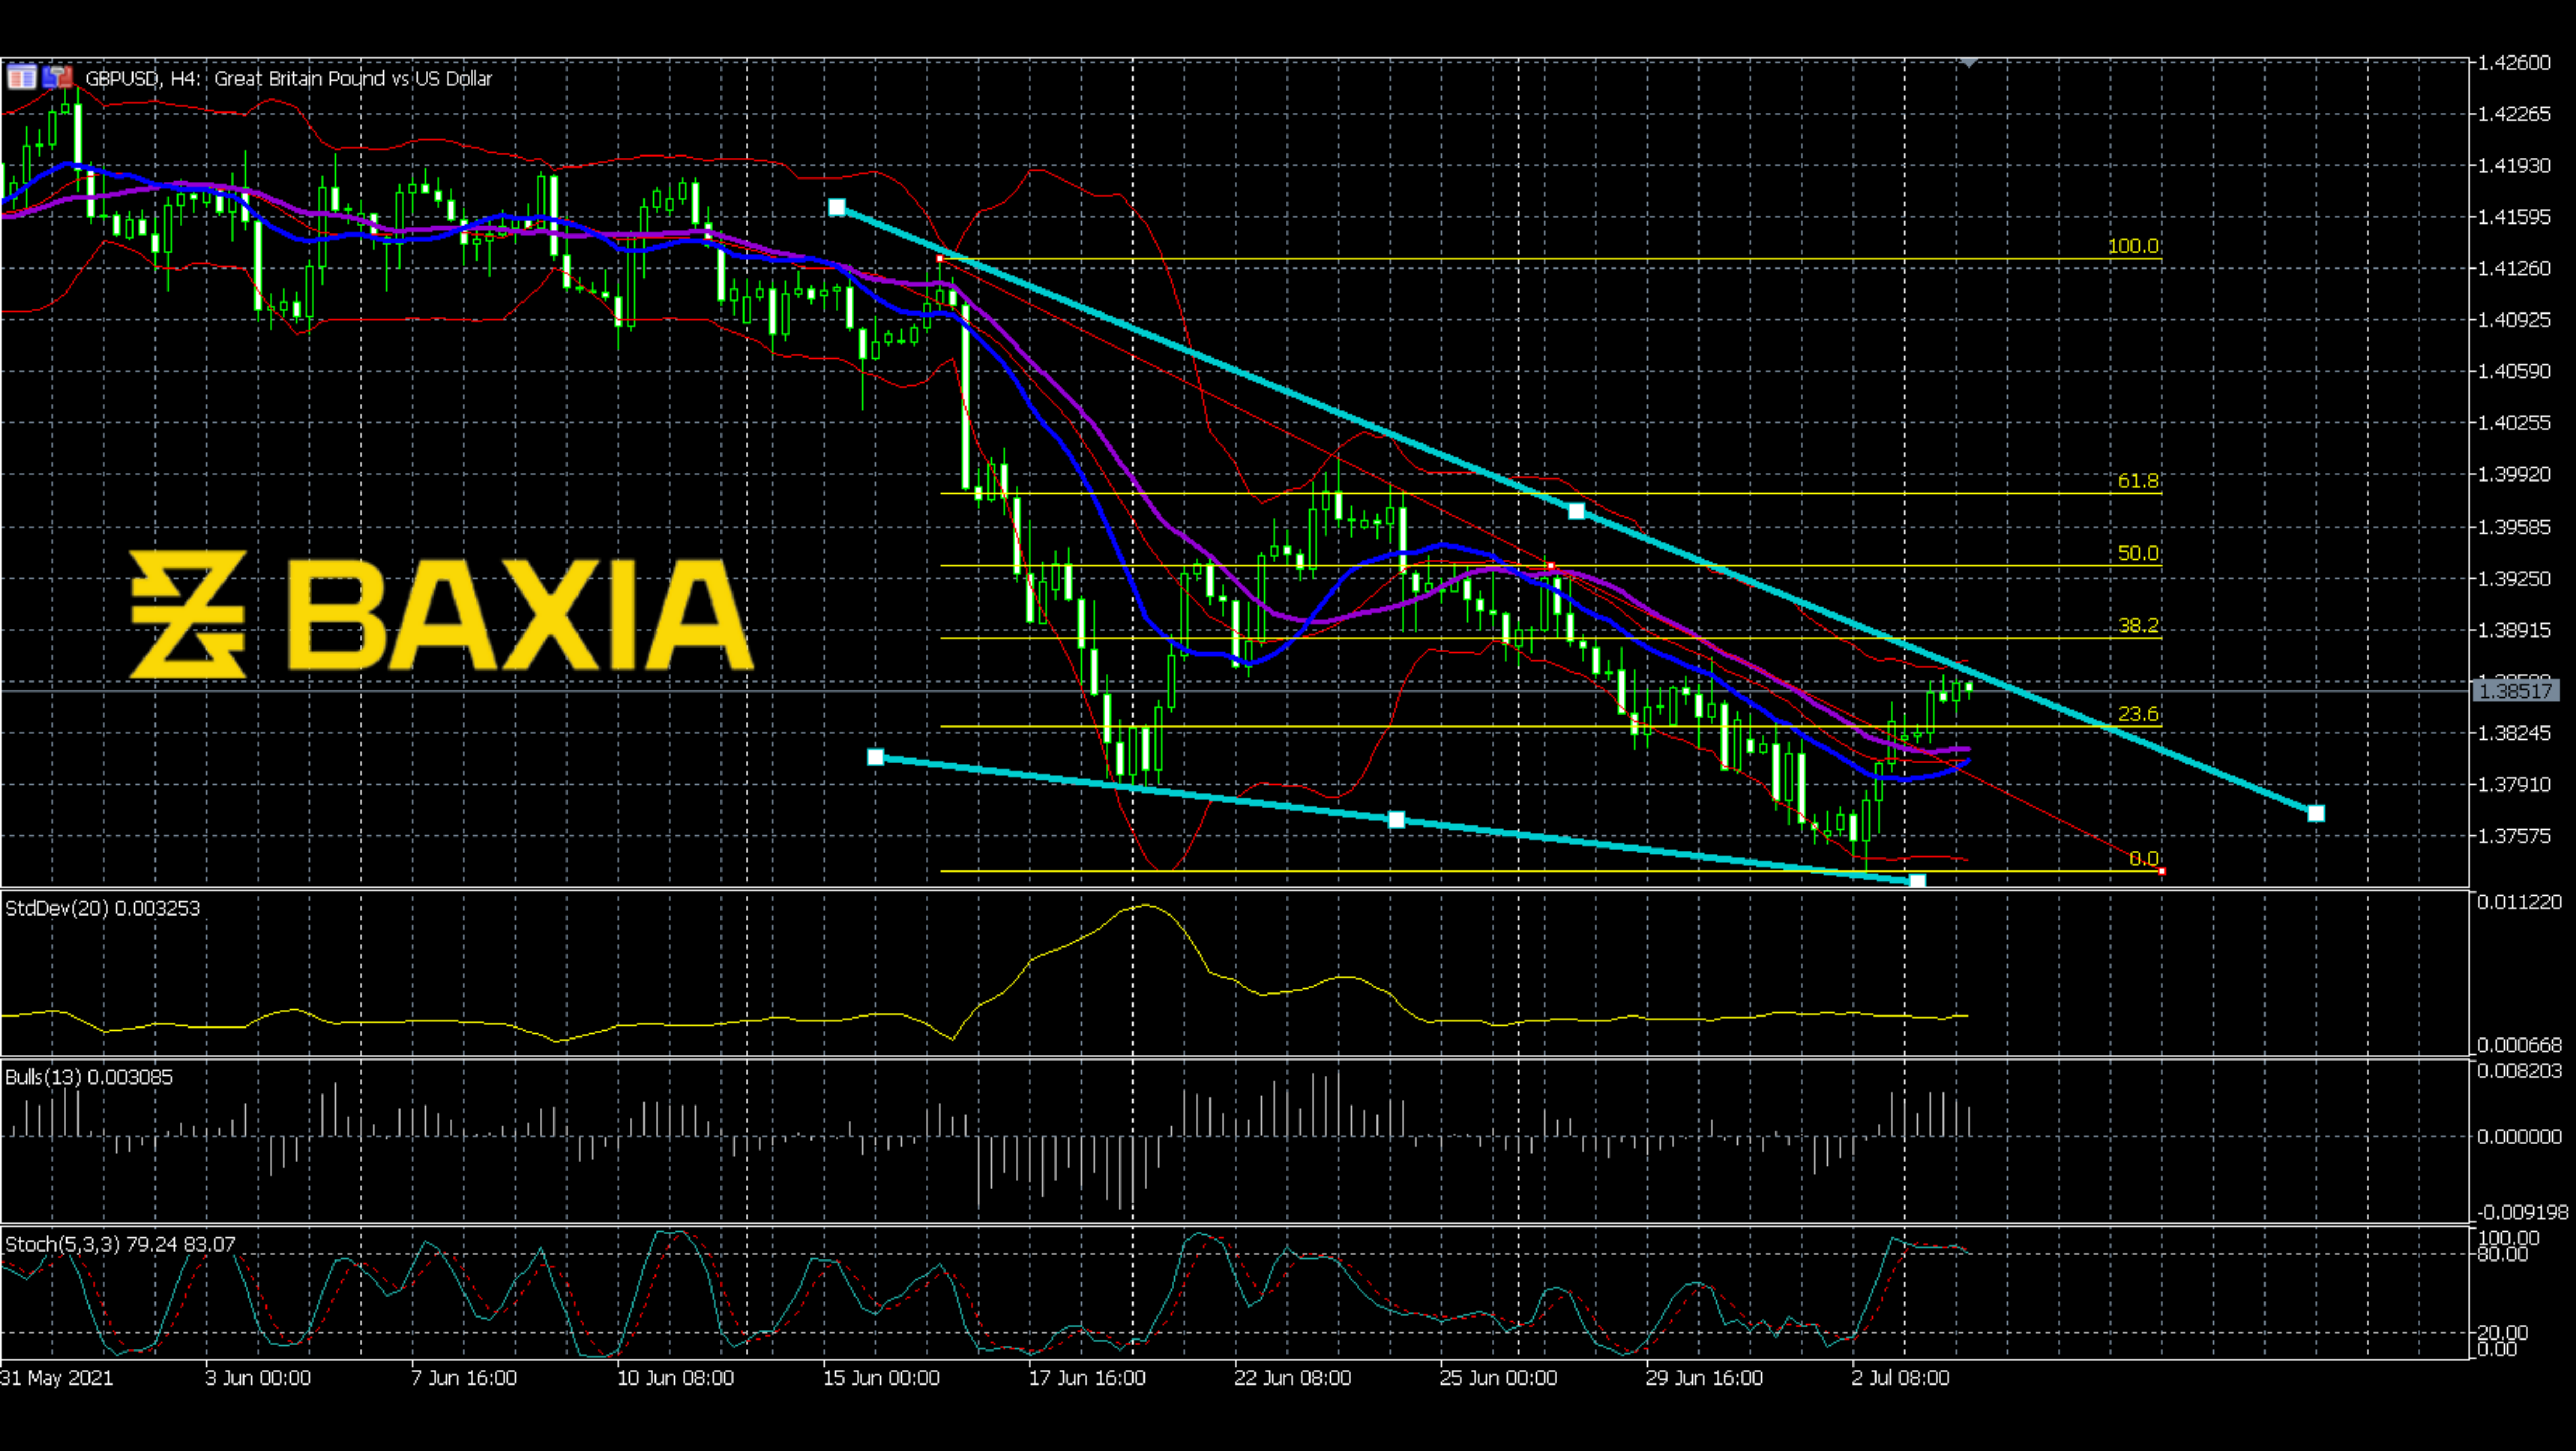
The Bollinger Bands are even; they have not shrunk yet. Also, the Standard deviation remains low, which means the price line is still preparing for the breakout. The Bull power already passed the peak and went down. The moving average of 25(purple) still moves below the 15(blue) moving average, but two lines are close, so now the price is making the final wave, after then the real breakout will come.
We love to hear new ideas from traders and want to know what you think!
If you like this topic and want to suggest future topics that you find helpful, let us know by clicking the ‘submit your feedback’ button below.

Trading foreign exchange on margin carries a high level of risk, and may not be suitable for all investors. Before deciding to trade foreign exchange you should carefully consider your investment objectives, level of experience, and risk appetite.
Nothing contained in this website should be construed as investment advice. Any reference to an investment's past or potential performance is not, and should not be construed as, a recommendation or as a guarantee of any specific outcome or profit.