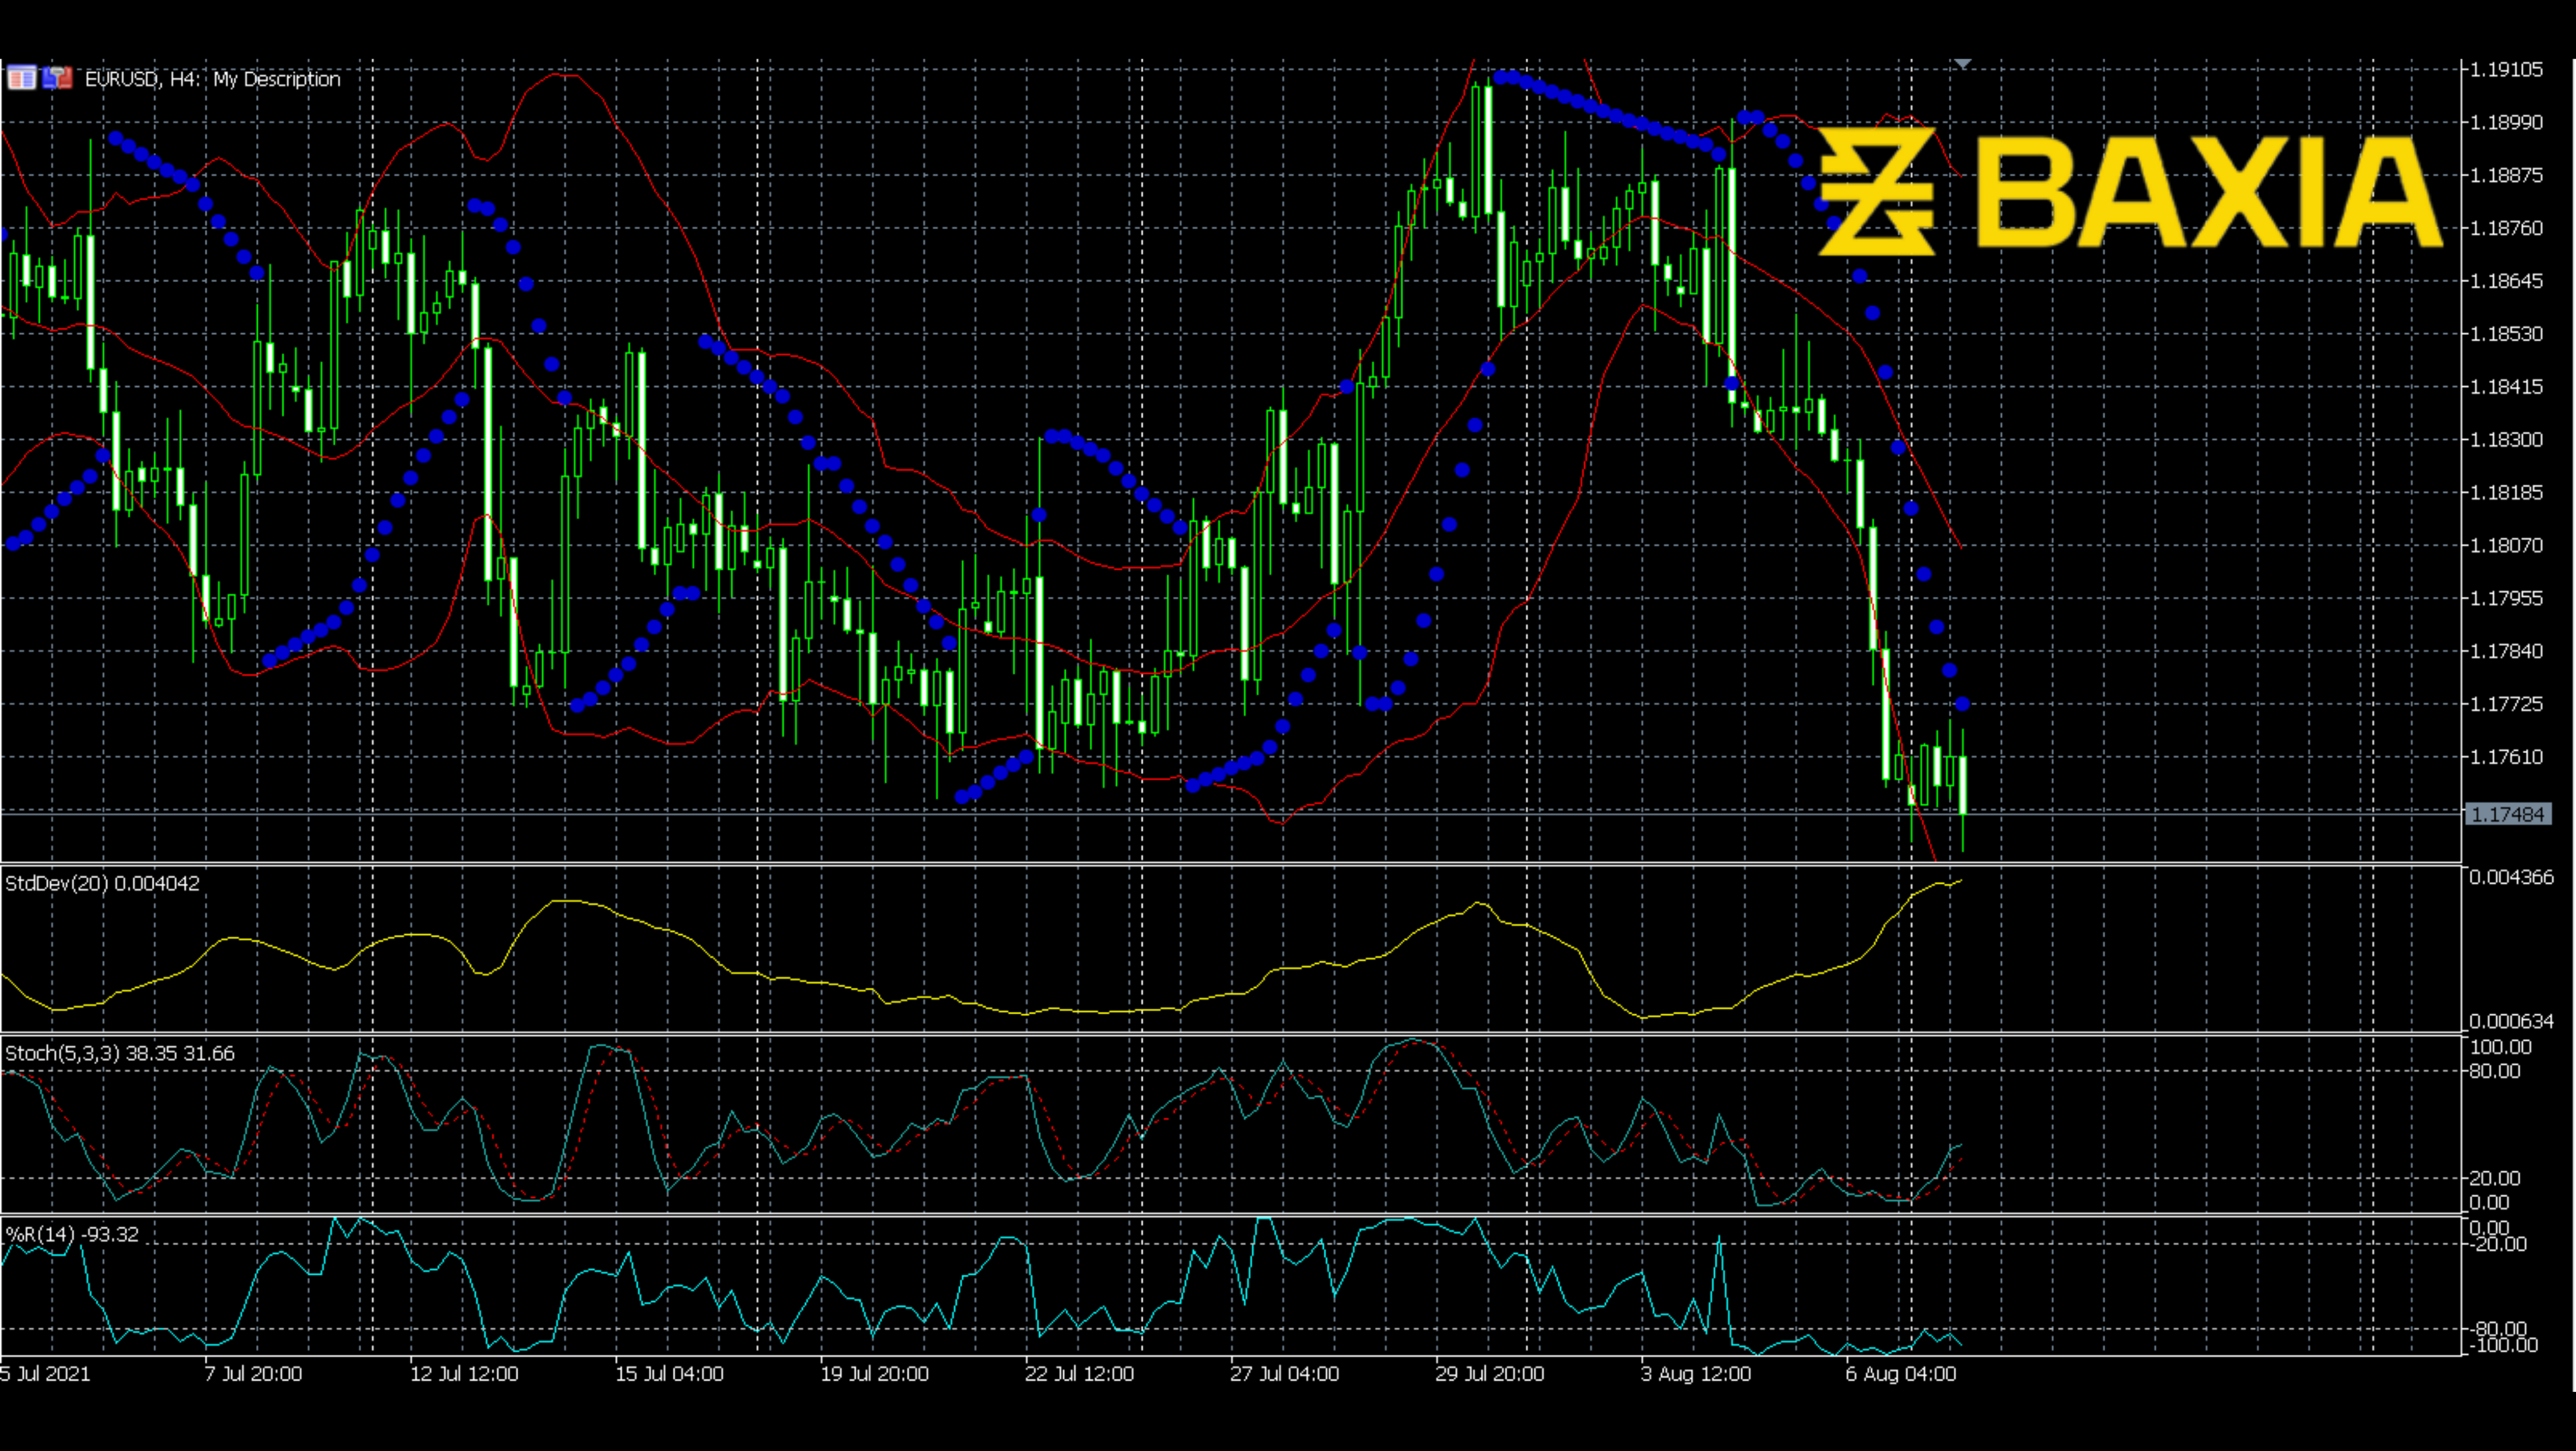

The price of GBPUSD has been through a big wave. The upward trend of the price started on July 20th; then, the price found a channel. The price has been hovering around 1.392 for five days. The price struggled to break out.
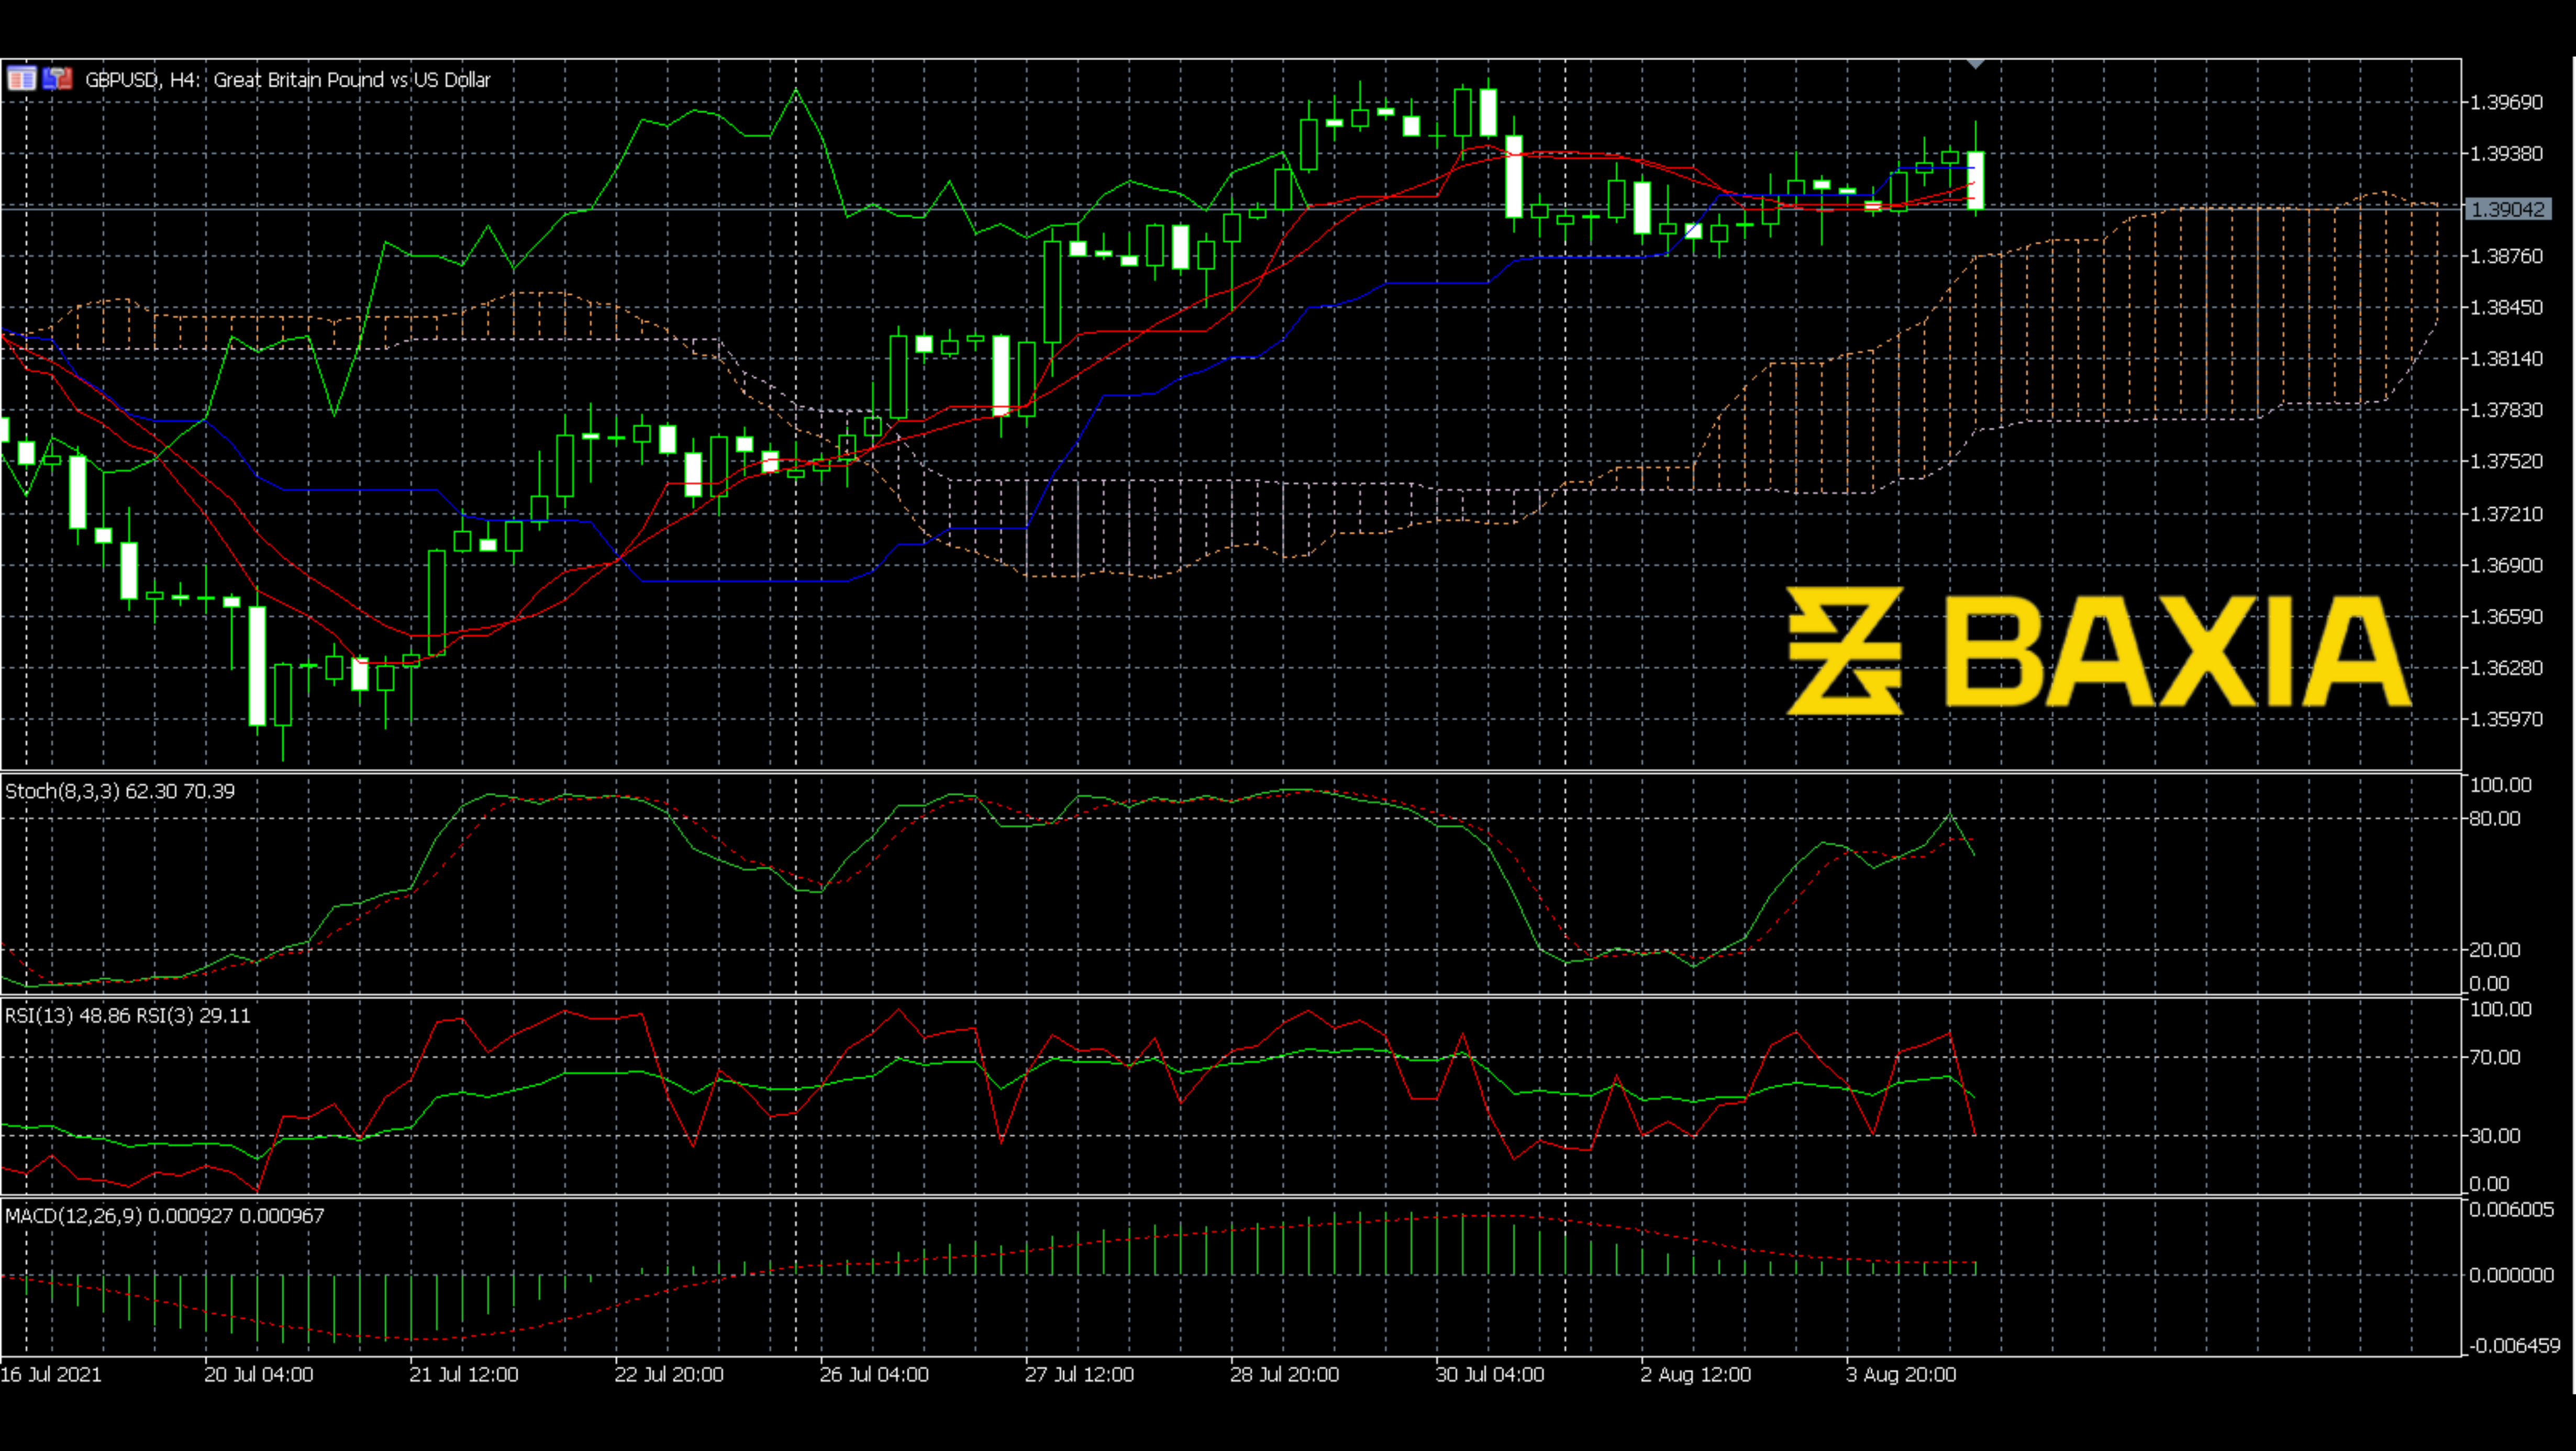
The Stochastics just touched the overbought area and returned, which means the price already met resistance. The RSI indicator shows the same thing; it broke up the 70 levels and then went down. All of those showed the same signal; the price stopped hovering and started making a breakout.
The MACD has already been in a downward trend which is considered a significant bearish signal. Also, the Ichimoku cloud goes up; and it almost touches the price line. When Ichimoku moves above the price line, the price could start to fall. Till now, some of the indicators show the beginning of the downward trend. We should keep our eyes on the price line and be ready for the breakdown.
We love to hear new ideas from traders and want to know what you think!
If you like this topic and want to suggest future topics that you find helpful, let us know by clicking the ‘submit your feedback’ button below.

Trading foreign exchange on margin carries a high level of risk, and may not be suitable for all investors. Before deciding to trade foreign exchange you should carefully consider your investment objectives, level of experience, and risk appetite.
Nothing contained in this website should be construed as investment advice. Any reference to an investment's past or potential performance is not, and should not be construed as, a recommendation or as a guarantee of any specific outcome or profit.