
In the dynamic realm of oil trading, USOIL (XTIUSD) has embarked on a confident advance over the last 24 hours, staging a notable recovery from the recent lows of $69-$70. The price action during this period has revealed intriguing patterns, hinting at the potential for a bullish reversal.
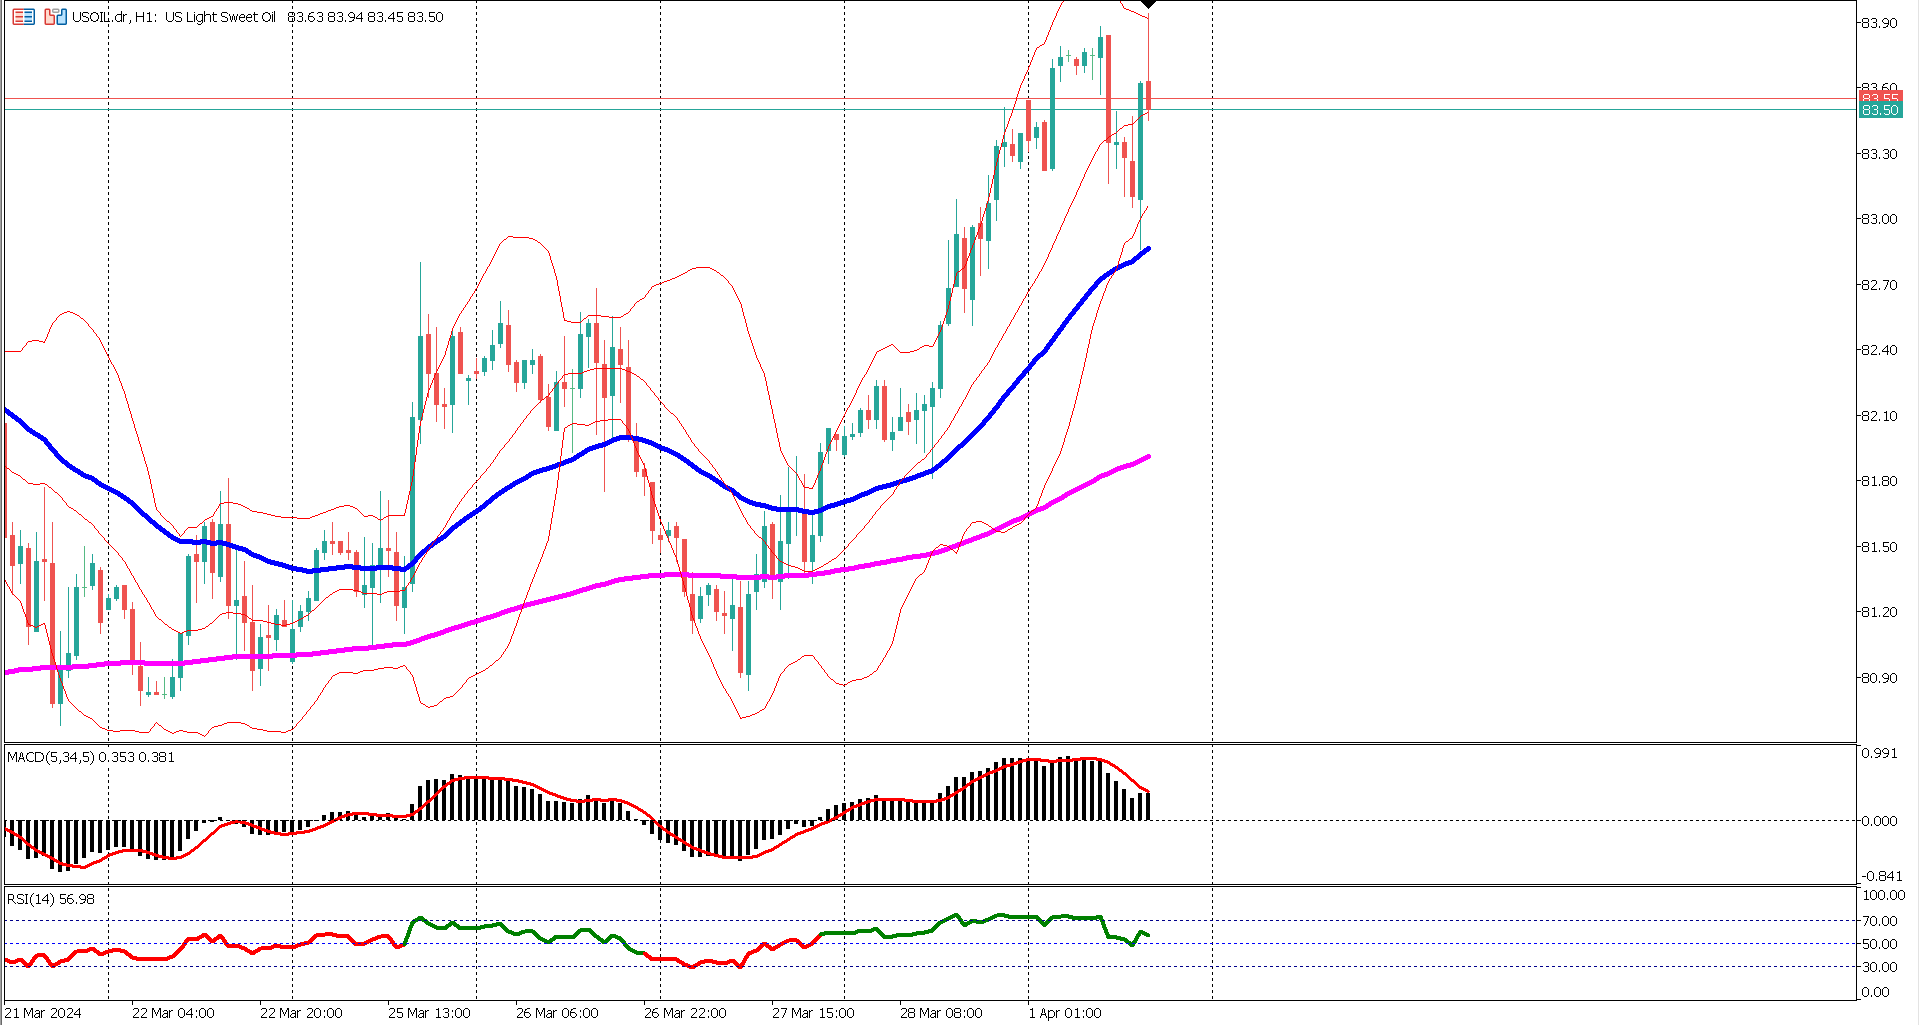
Multiple doji candlesticks, characterized by high wave patterns, have formed at the bottom of the recent bearish rally. This series culminated in a bullish engulfing candlestick, followed by two consecutive large body candlesticks that pierced the upper side of the Bollinger band (red colored). These developments present an early indication of a potential bullish reversal, signaling a shift in sentiment.
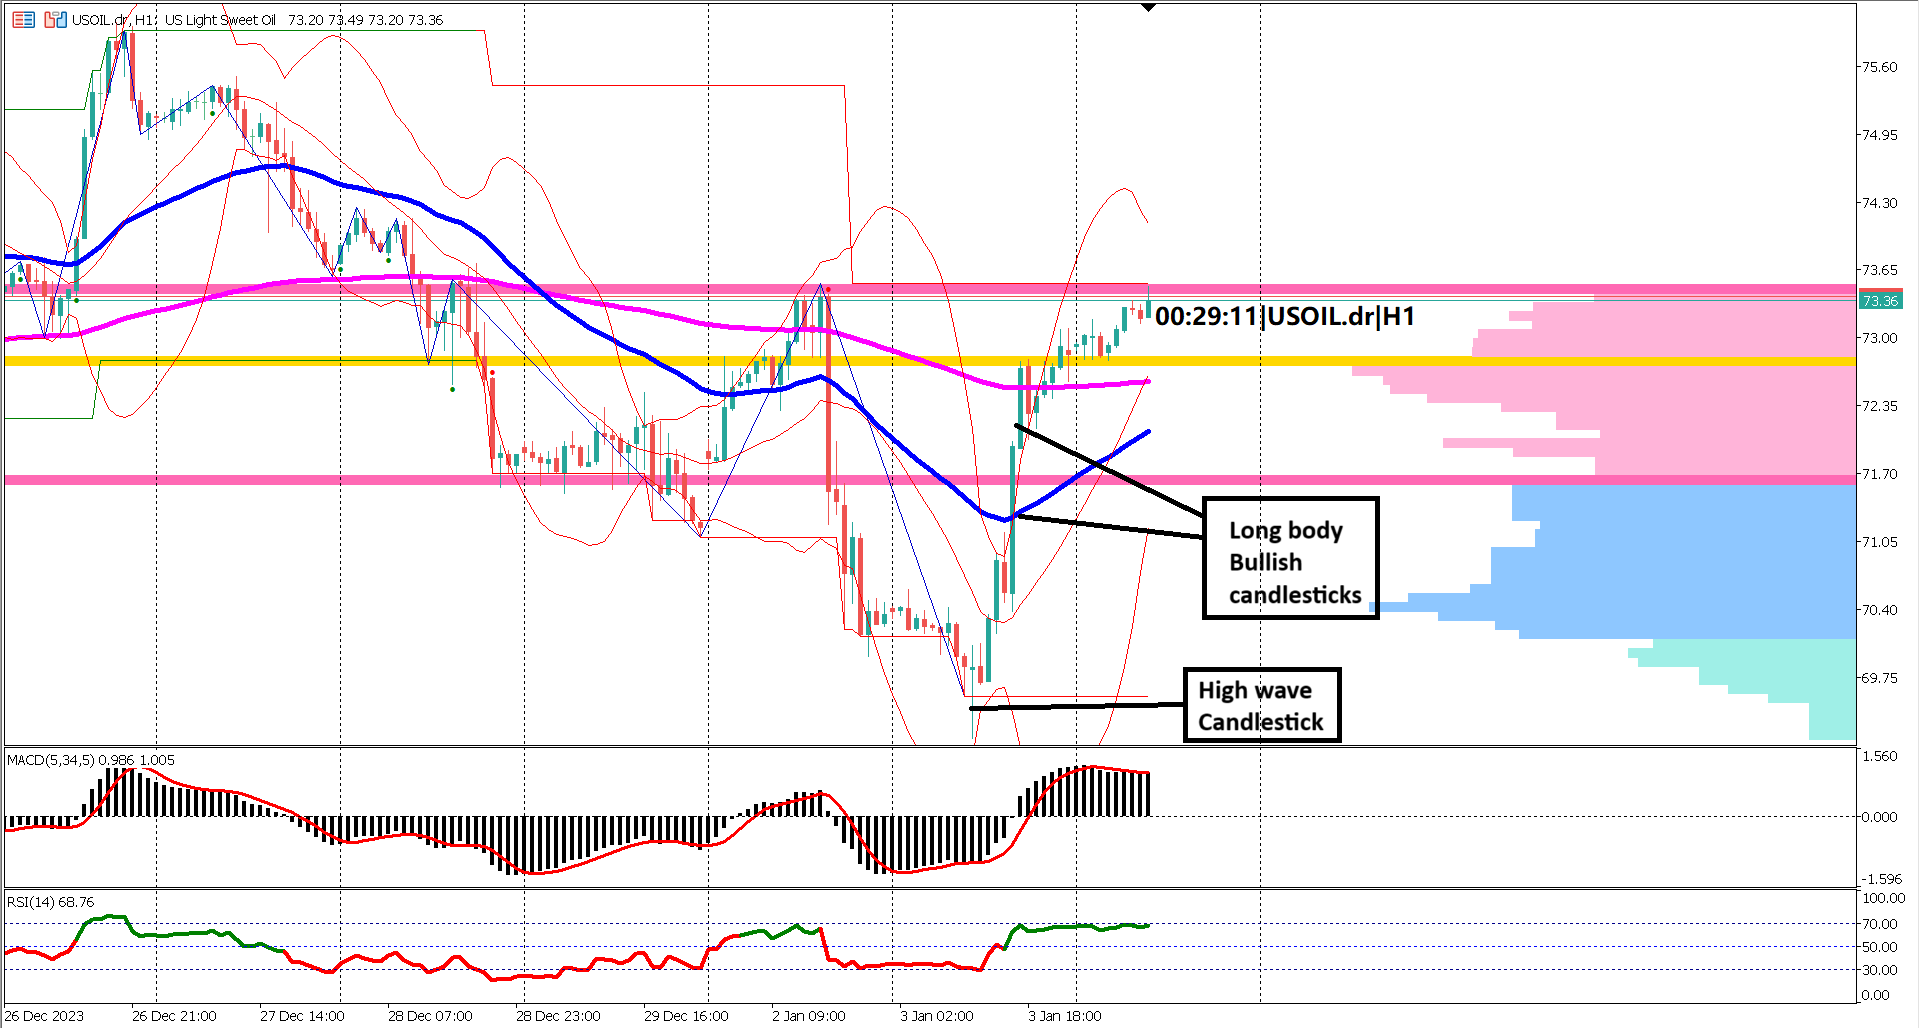
However, it's essential to acknowledge that the major trend remains bearish, as evidenced by the positioning of the Exponential Moving Average (EMA) indicators. The EMA 50 is currently under the EMA 200, with the former converging towards the latter. This convergence suggests a waning bearish momentum.
The volume profile indicator provides additional insights, indicating that prices have yet to break above the upperside of the value area. Once this breakthrough occurs, it may exert additional pressure on the bears, signaling a potential takeover by the bulls in the market dynamics.
Adding another layer of complexity to the situation, today's release of key economic news related to US crude oil inventories looms large. Economists anticipate an increase in inventory at -3.200M compared to the previous figure of -7.114M. This release holds the potential to influence market sentiment significantly.
If the actual inventory increase aligns with forecasts, it could present a selling opportunity, prompting a further drop in prices, potentially breaching the previous swing low at $70. On the contrary, a lower inventory outcome may propel prices higher, targeting the $75-$76 range.
Examining the oscillator technical indicators, the Moving Average Convergence Divergence (MACD) paints a bullish picture, with both the histogram and signal line residing above the 0 line. Simultaneously, the Relative Strength Index (RSI) breached the 60% level 17 trading sessions ago on an hourly timeframe. The RSI has demonstrated resilience, staying above the 40% level, indicating the sustainability of the bullish trend.
In summary, USOIL (XTIUSD) finds itself at a crossroads, with short-term indicators pointing to a bullish trend amidst the backdrop of a major bearish trend. The upcoming US crude oil inventories release will likely play a decisive role, making or breaking the bullish scenario. Traders are advised to exercise caution and closely monitor the outcome of this key economic news to navigate potential market shifts.

Trading foreign exchange on margin carries a high level of risk, and may not be suitable for all investors. Before deciding to trade foreign exchange you should carefully consider your investment objectives, level of experience, and risk appetite.
Nothing contained in this website should be construed as investment advice. Any reference to an investment's past or potential performance is not, and should not be construed as, a recommendation or as a guarantee of any specific outcome or profit.