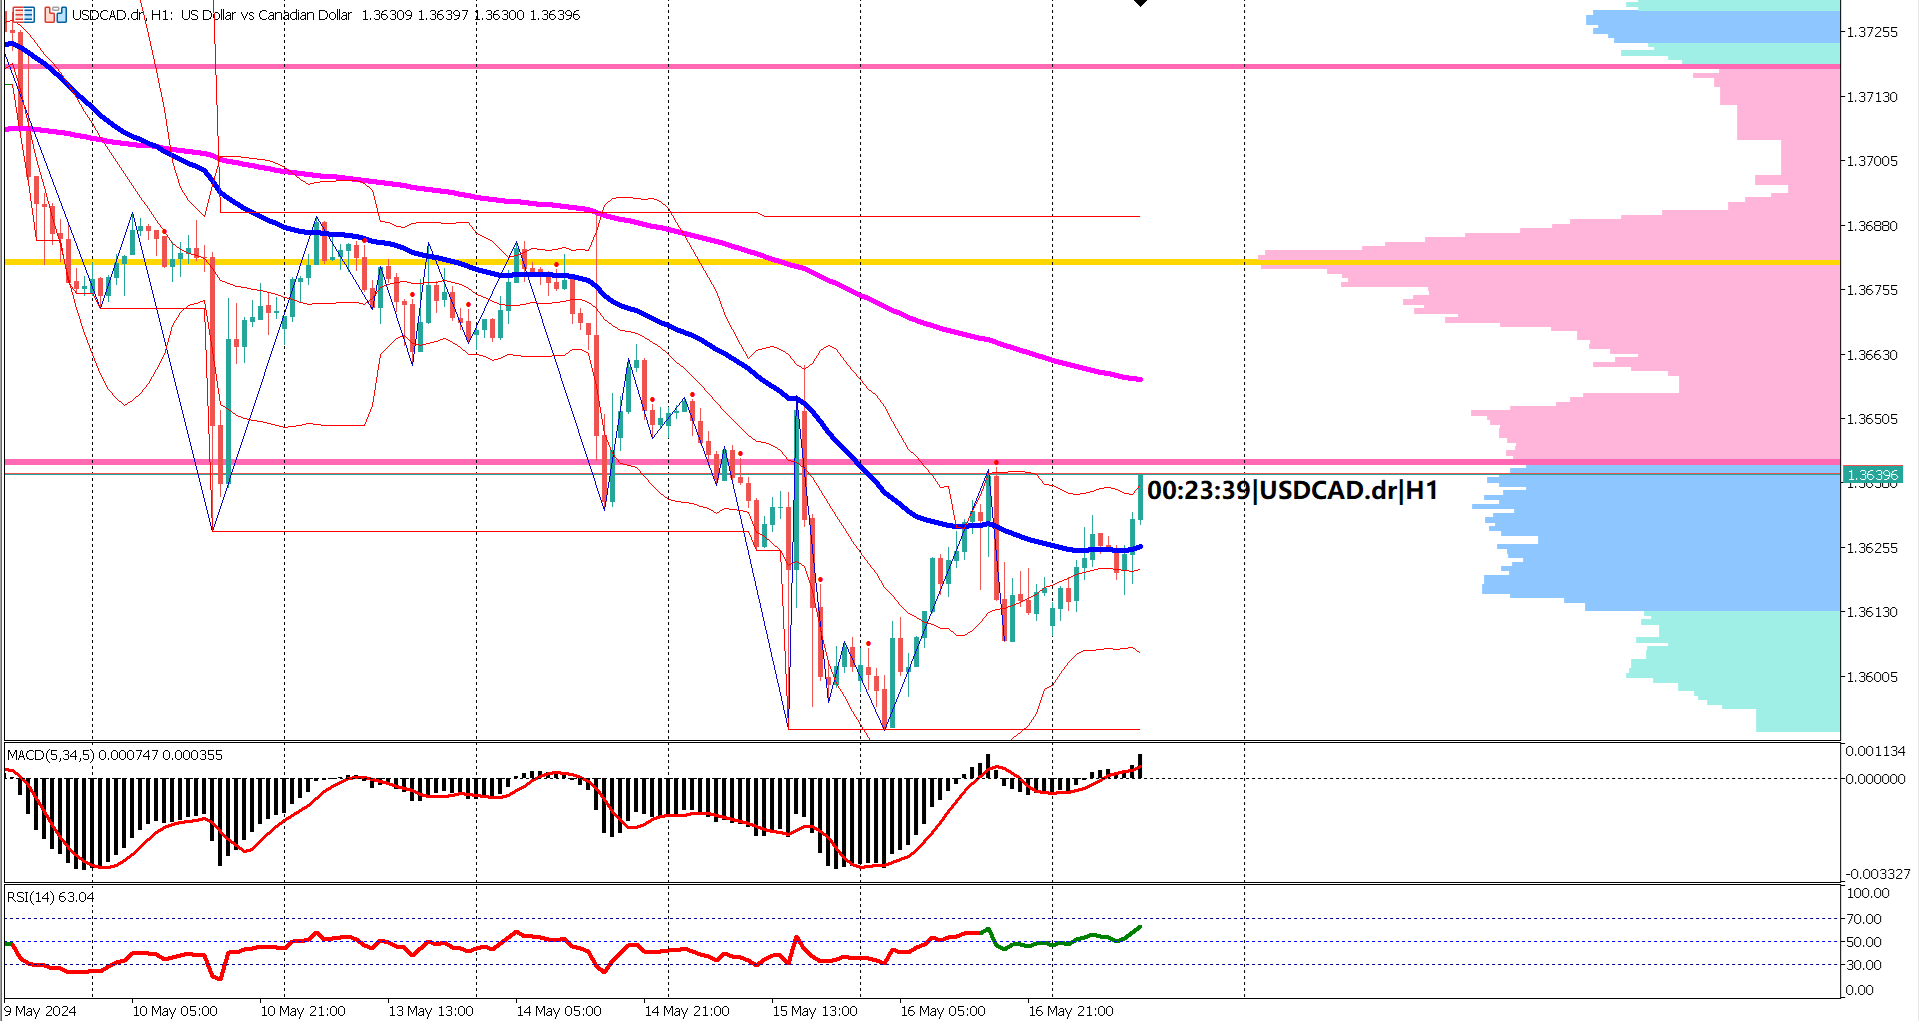

Amidst a backdrop of considerable volatility, USDCAD has navigated a wide-ranging terrain over the past three months, spanning approximately 186 pips.
Throughout this period, market observers have noted the formation of a potential triple top chart pattern, indicative of a looming bearish reversal. For validation of this pattern, market participants are closely monitoring the critical swing low at 1.3360, demarcated by a golden-brown rectangle at the bottom on the price chart.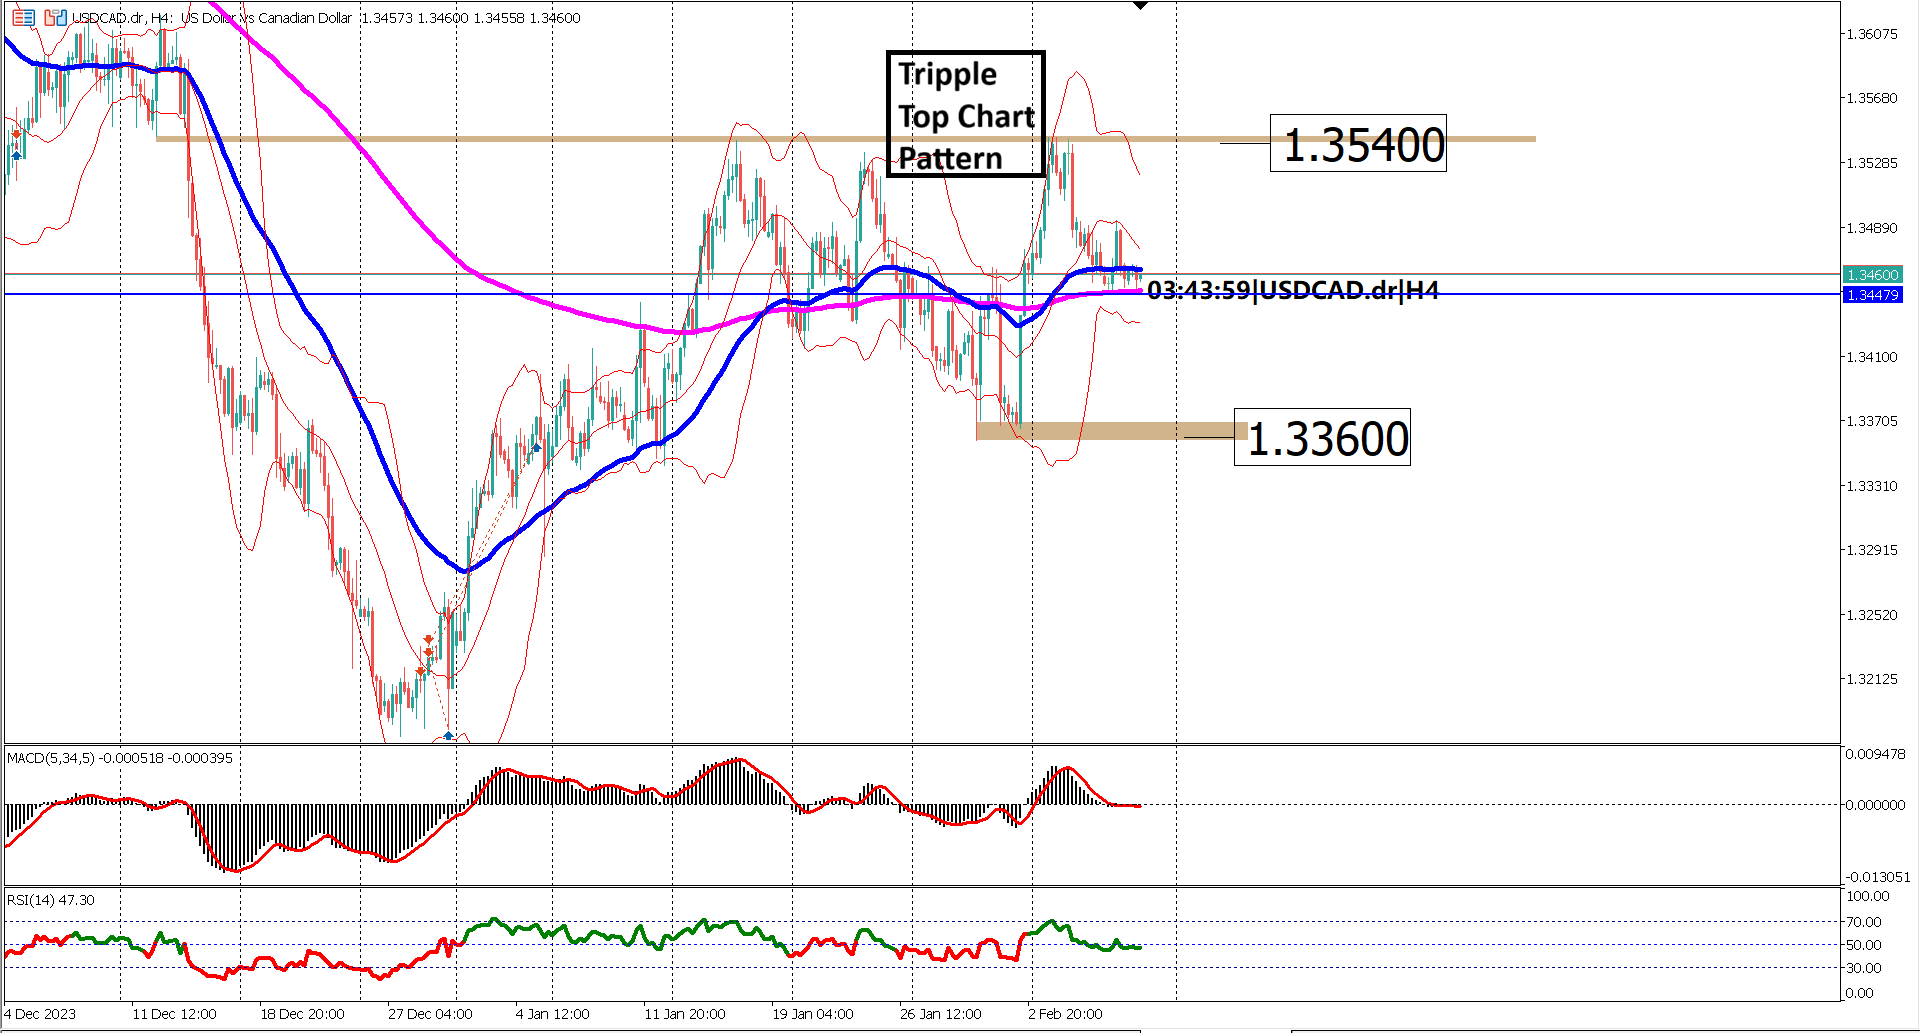
Meanwhile, the Bollinger Bands, a key technical indicator, reveal USDCAD trading within the lower band zone. Despite this proximity, prices have yet to breach below the lower band, suggesting a cautious market sentiment.
A closer examination of the moving averages paints a nuanced picture. While the EMA 50 currently resides above the EMA 200, the narrow gap between the two implies a lack of robust bullish momentum. Should the EMA 200 hold firm, preventing prices from dipping below, a potential breakout above the triple top pattern at $1.3540 could materialize. However, the MACD and RSI indicators present a mixed signal, reflecting the choppy nature of the market trend.
In essence, USDCAD finds itself in a sideways trend, awaiting further confirmation for a decisive breakout. Traders and investors alike are urged to monitor today's economic news releases, as they could catalyze heightened volatility and potentially pave the way for a breakout in either direction. As the market remains on edge, strategic positioning and diligent observation will be paramount for navigating the shifting landscape of USDCAD trading.
Forecast 0.2% vs Previous 0.1%
Forecast 16.0K vs Previous 0.1K
Forecast 5.9% vs Previous 5.8%

Trading foreign exchange on margin carries a high level of risk, and may not be suitable for all investors. Before deciding to trade foreign exchange you should carefully consider your investment objectives, level of experience, and risk appetite.
Nothing contained in this website should be construed as investment advice. Any reference to an investment's past or potential performance is not, and should not be construed as, a recommendation or as a guarantee of any specific outcome or profit.