
The USDJPY currency pair finds itself at a critical juncture, displaying signs of a potential reversal as bullish momentum encounters staunch resistance. Traders are closely scrutinizing key technical indicators for insights into the currency pair's next move.
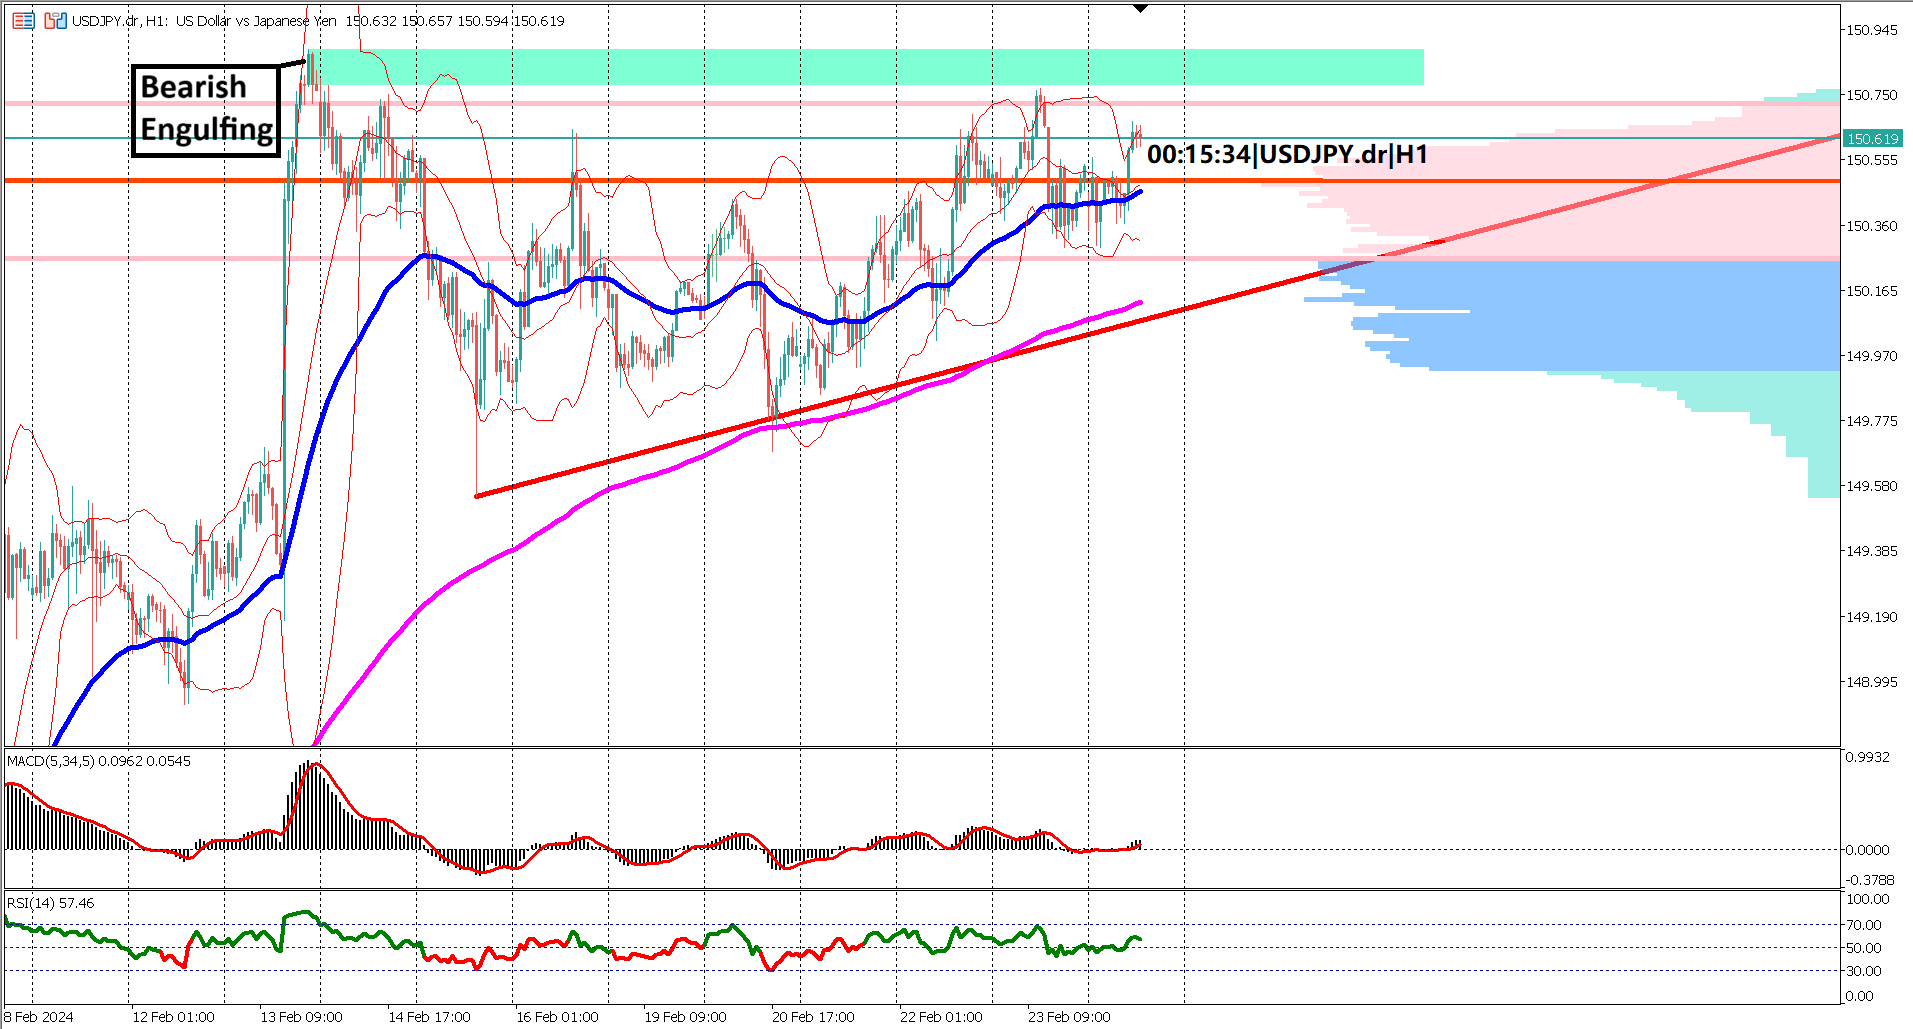
The recent bullish surge in USDJPY, while impressive, has been met with persistent challenges. A distinct pattern emerges as new highs are swiftly followed by retracements to the previous corrective phase, encapsulated by an orange rectangle on the chart.
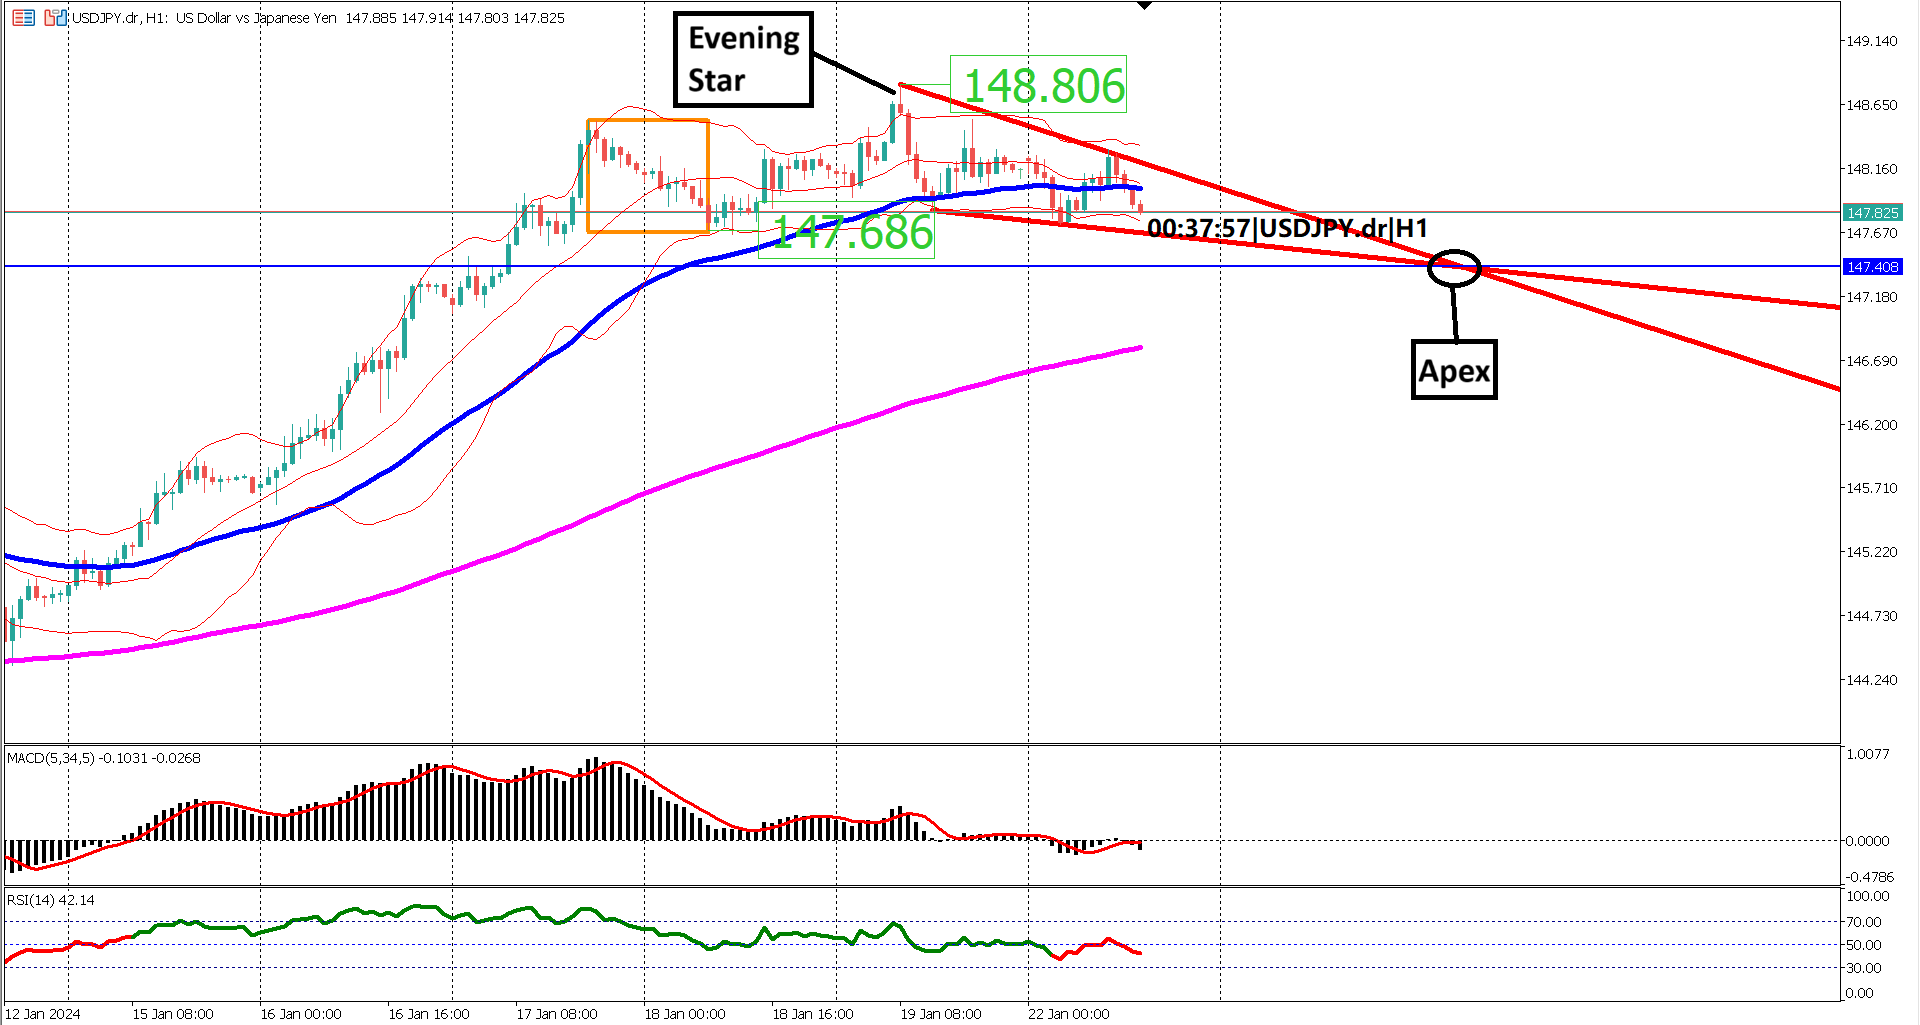
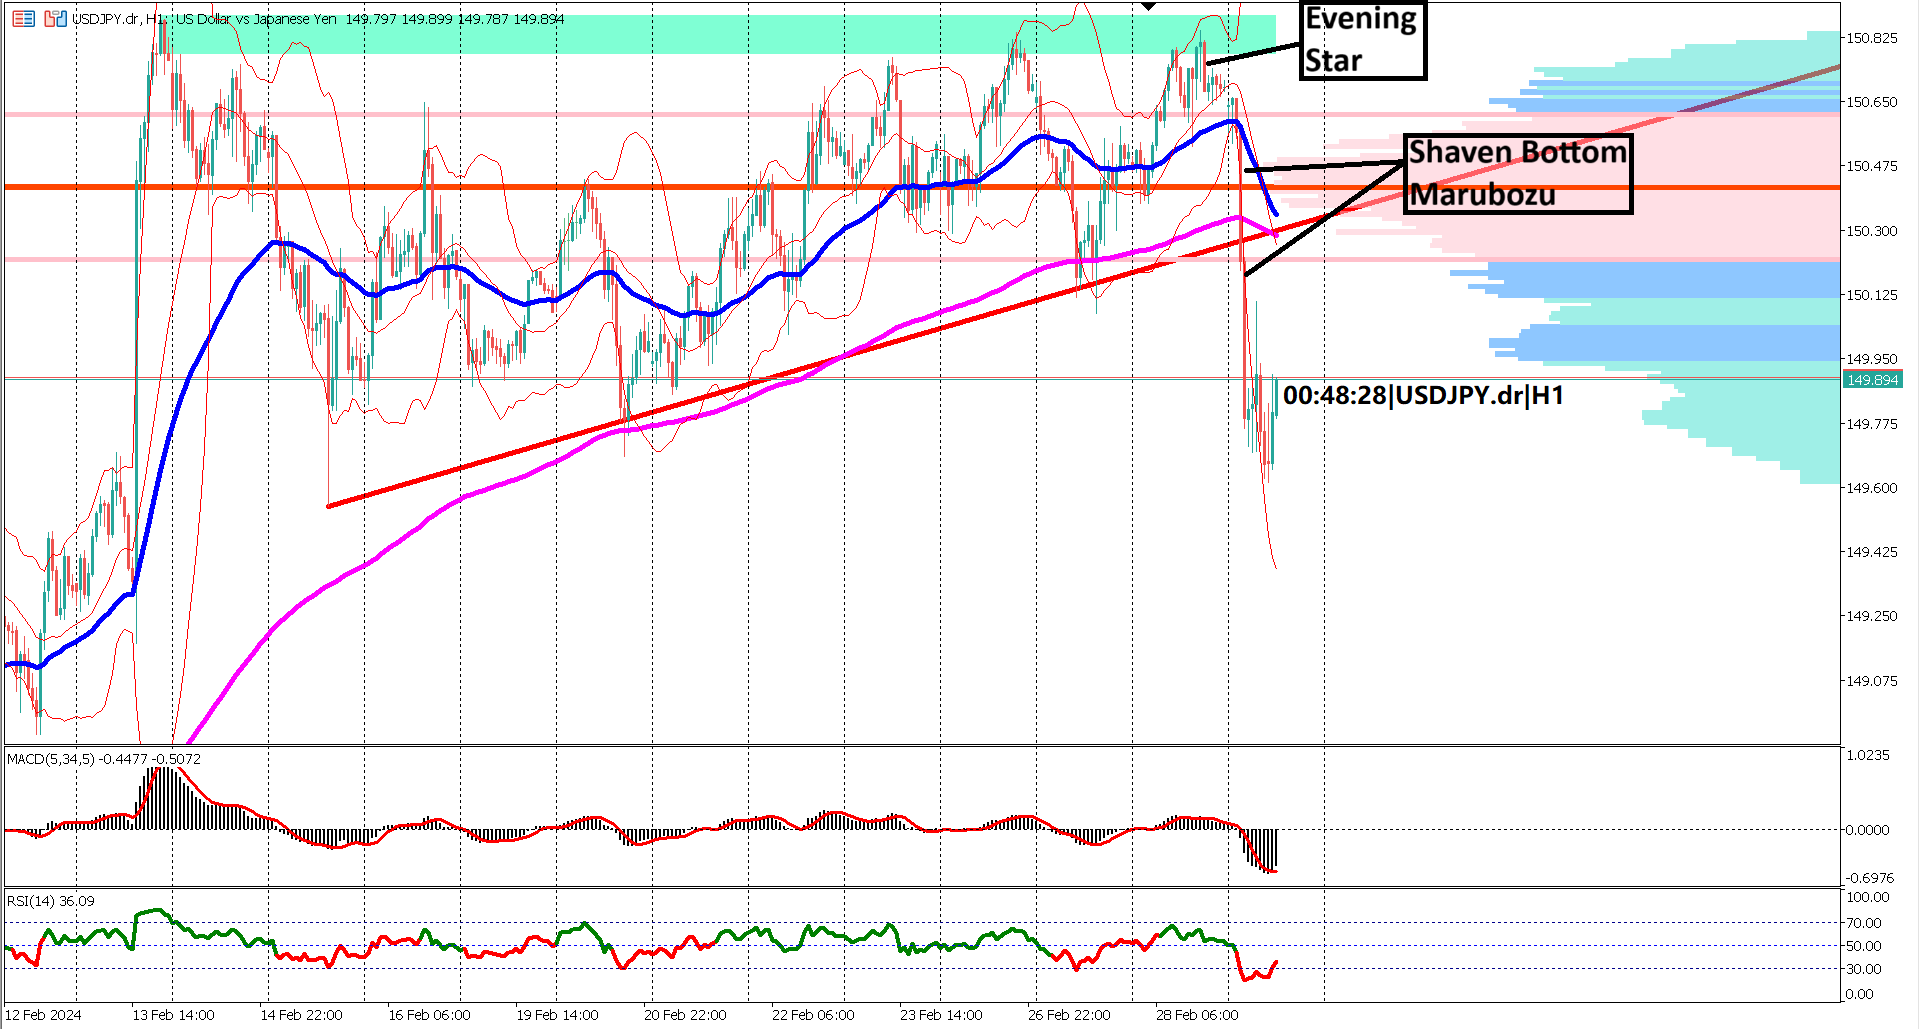
Adding to the cautionary tale is the appearance of a shooting star candlestick, followed by an evening star candlestick pattern. These patterns signal a formidable resistance zone, emphasizing the significance of the current levels.
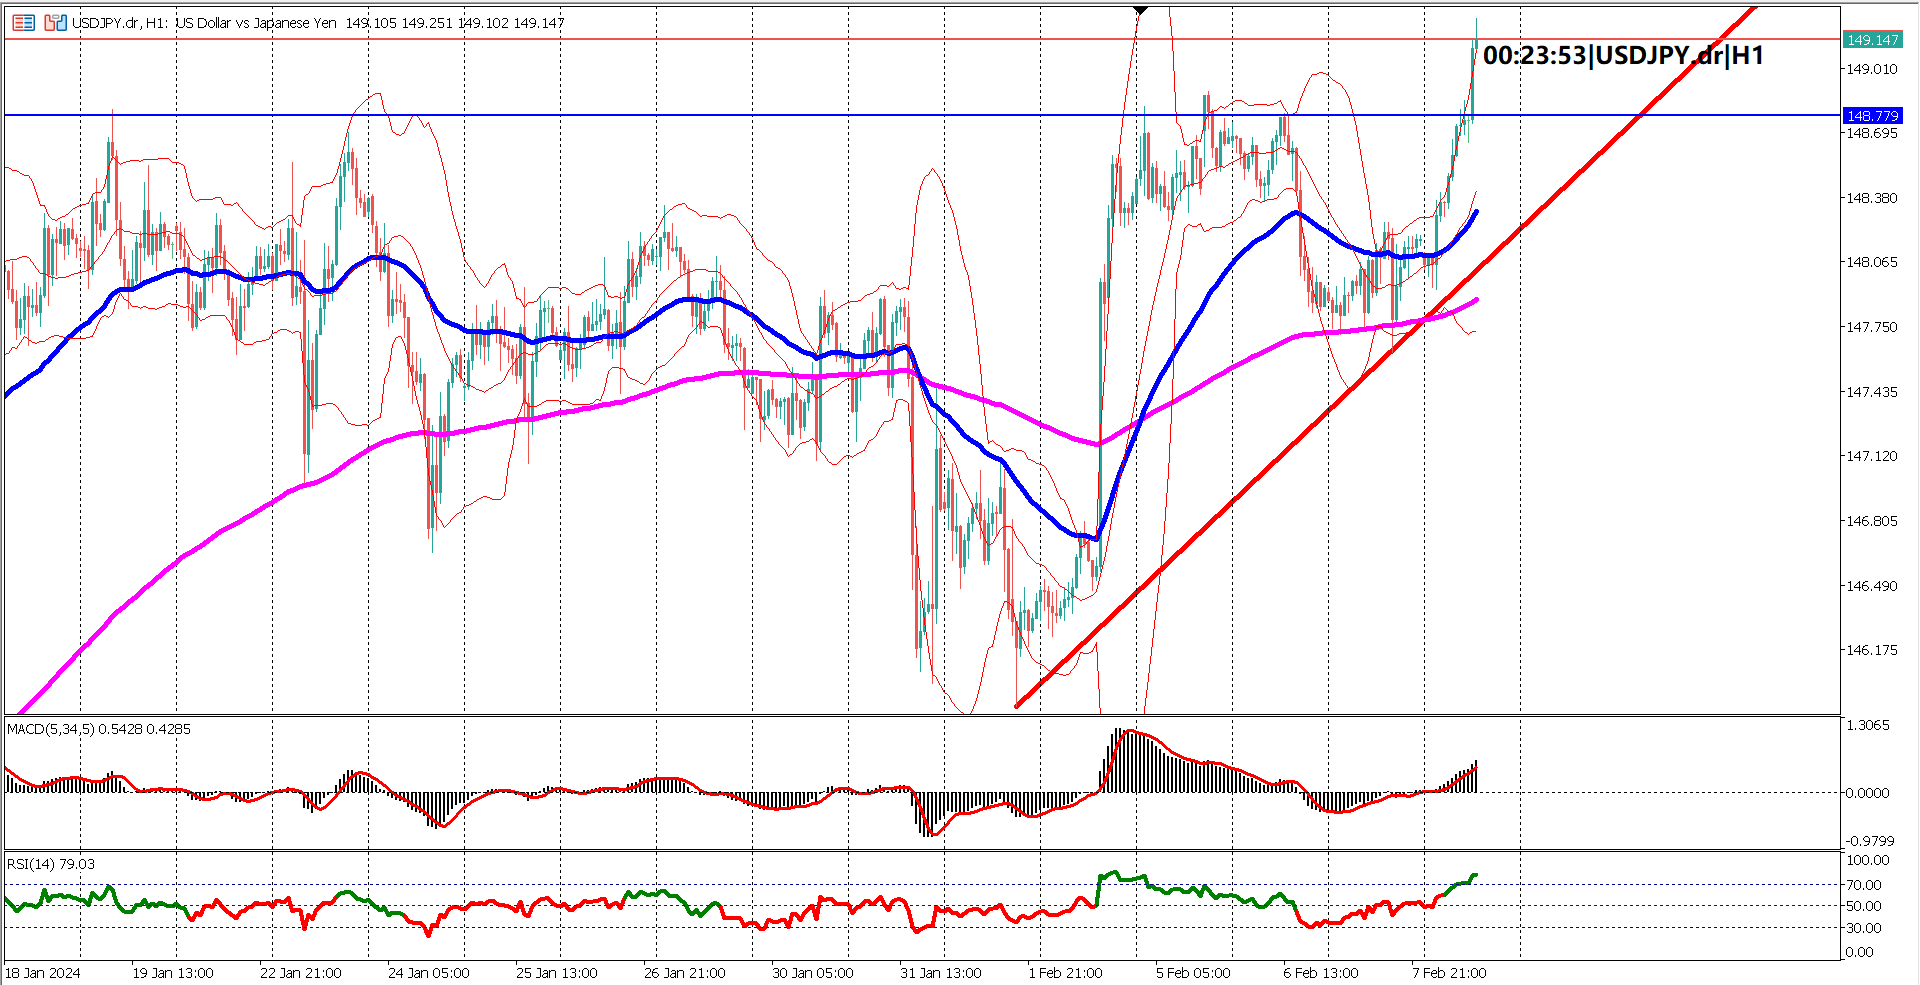
The price action tells a compelling story as USDJPY reacts to rejection by forming a falling wedge chart pattern. This pattern, if confirmed with a break below the last swing low at 147.686, could herald a bearish reversal. Traders are eyeing another critical support level at the apex, where the falling wedge converges. Conversely, a decisive break above the last swing high at 148.800 may reignite bullish momentum, challenging the prevailing signs of a slowdown.
In the realm of moving averages, the EMA 50 has adopted a flat line, signaling an impending deceleration of momentum. A convergence toward the EMA 200 further underscores the potential slowdown, prompting traders to tread cautiously.
Bollinger Bands, currently tight and narrow, point to low volatility. Traders brace for a surge in volatility and potential reversal when prices breach the upper or lower bands. A key indicator is the divergence or expansion of both bands, signifying dynamic market conditions.
Turning to oscillator indicators, both MACD and RSI are sounding bearish alarms. The MACD histogram and signal line have crossed below the 0 line, indicating a shift in momentum. Concurrently, the RSI has dipped below the 40% level, maintaining its position below the 60% mark.
In summary, USDJPY stands at a pivotal moment, displaying signs of a potential bearish reversal. Traders are closely monitoring the interplay of key levels, candlestick patterns, and oscillator signals for cues on the currency pair's next trajectory. The shifting dynamics invite a cautious approach, urging traders to stay vigilant and adapt to evolving market conditions.
Critical Inflection Point: USDJPY encounters resistance after each bullish surge, signaling a potential reversal. Traders scrutinize key technical levels for cues.
Candlestick Patterns Signal Caution: The appearance of a shooting star and evening star candlestick patterns emphasizes a formidable resistance zone, heightening the significance of current levels.
Falling Wedge Chart Pattern: USDJPY reacts to rejection by forming a falling wedge, suggesting a potential bearish reversal. Attention is on the break below the last swing low for confirmation.
Moving Averages and Momentum: EMA 50's flatlining and convergence toward EMA 200 indicate a slowdown in bullish momentum. Traders observe these moving averages for potential shifts.
Volatility and Oscillator Signals: Tight Bollinger Bands suggest low volatility, with traders anticipating a surge upon breaching upper/lower bands. MACD and RSI both signal bearish sentiments, adding to the cautionary outlook.
Forecast -0.3% vs Previous -0.5%

Trading foreign exchange on margin carries a high level of risk, and may not be suitable for all investors. Before deciding to trade foreign exchange you should carefully consider your investment objectives, level of experience, and risk appetite.
Nothing contained in this website should be construed as investment advice. Any reference to an investment's past or potential performance is not, and should not be construed as, a recommendation or as a guarantee of any specific outcome or profit.