
As BTCUSD enthusiasts eagerly monitor the cryptocurrency markets, recent price actions present a conundrum of signals, combining bullish resilience and hints of potential retracement. In this analysis, we delve into the key dynamics influencing BTCUSD, shedding light on both technical indicators and critical levels.
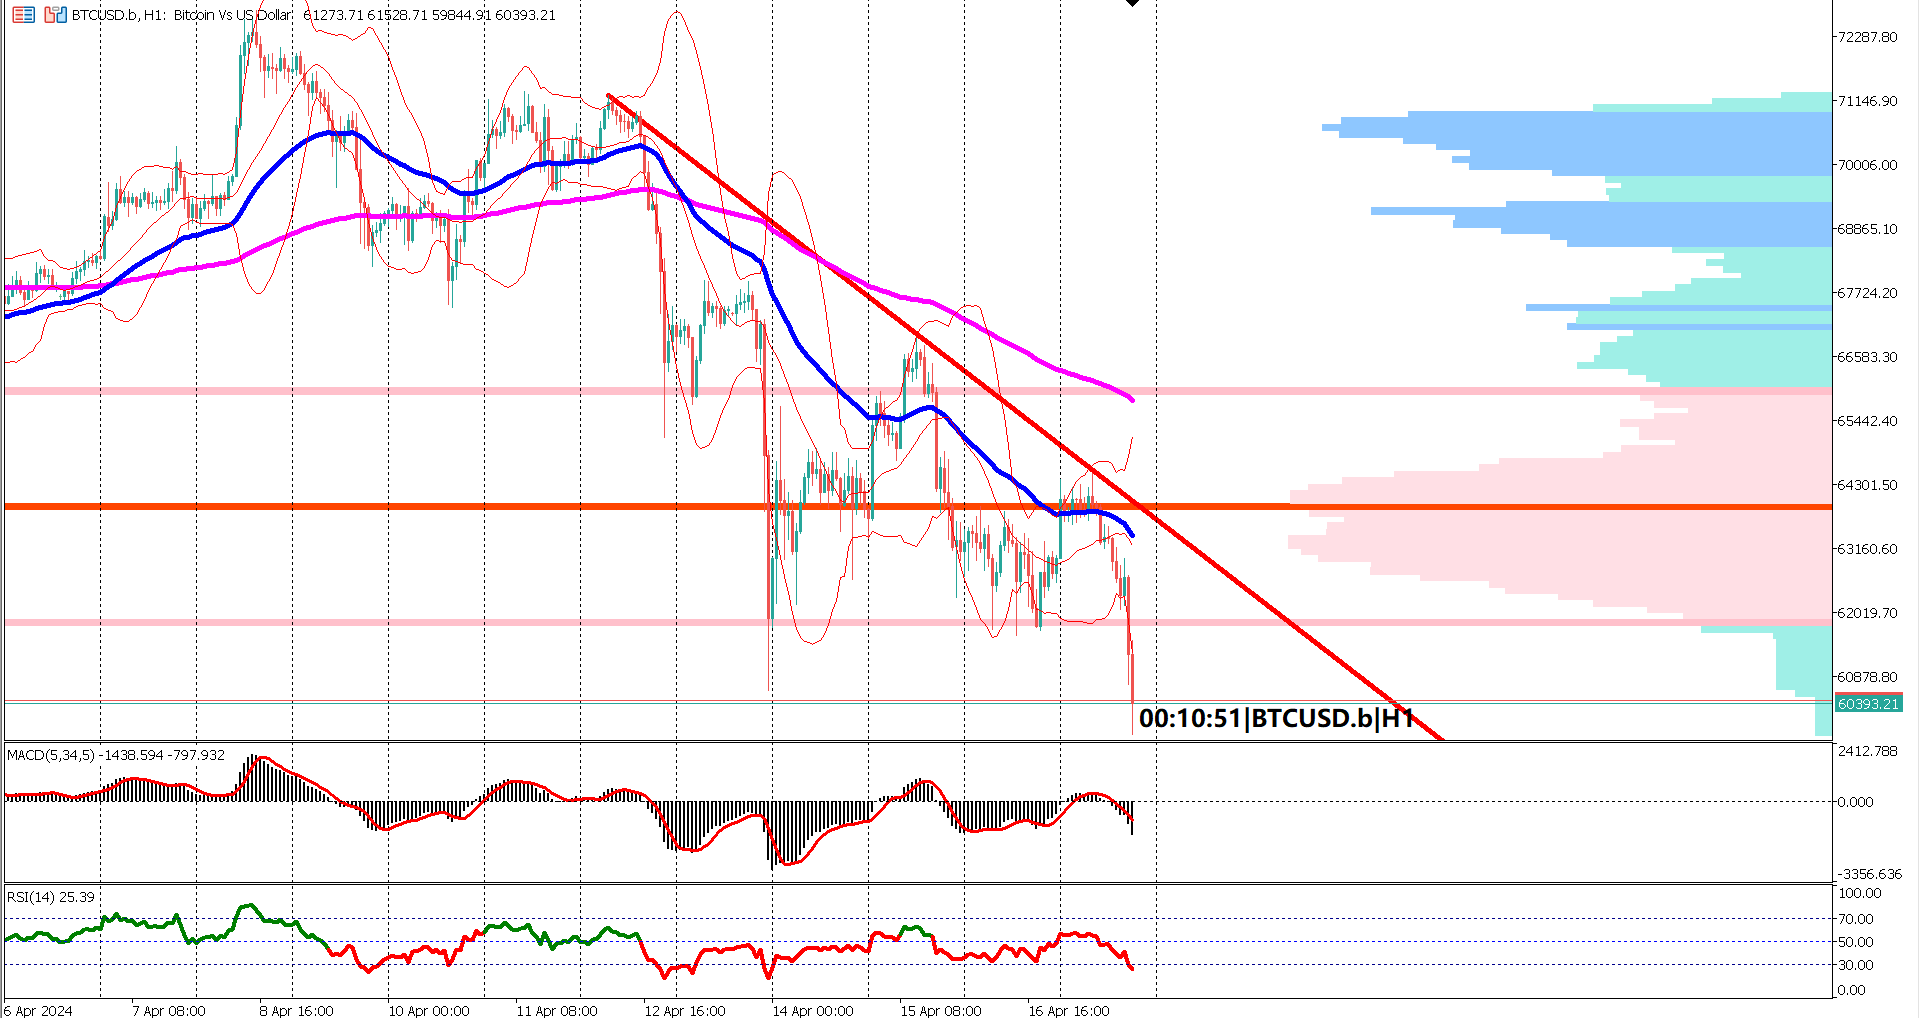
BTCUSD's bullish rally encountered a formidable barrier at $42,870, a level marked by historical significance. On January 17, 2024, this zone witnessed the formation of a bearish engulfing candlestick, signifying strong selling pressure. Recognizing such levels as key resistance points is a prudent approach, as historical patterns often repeat. Traders should keep a keen eye on this level as it could shape future price actions.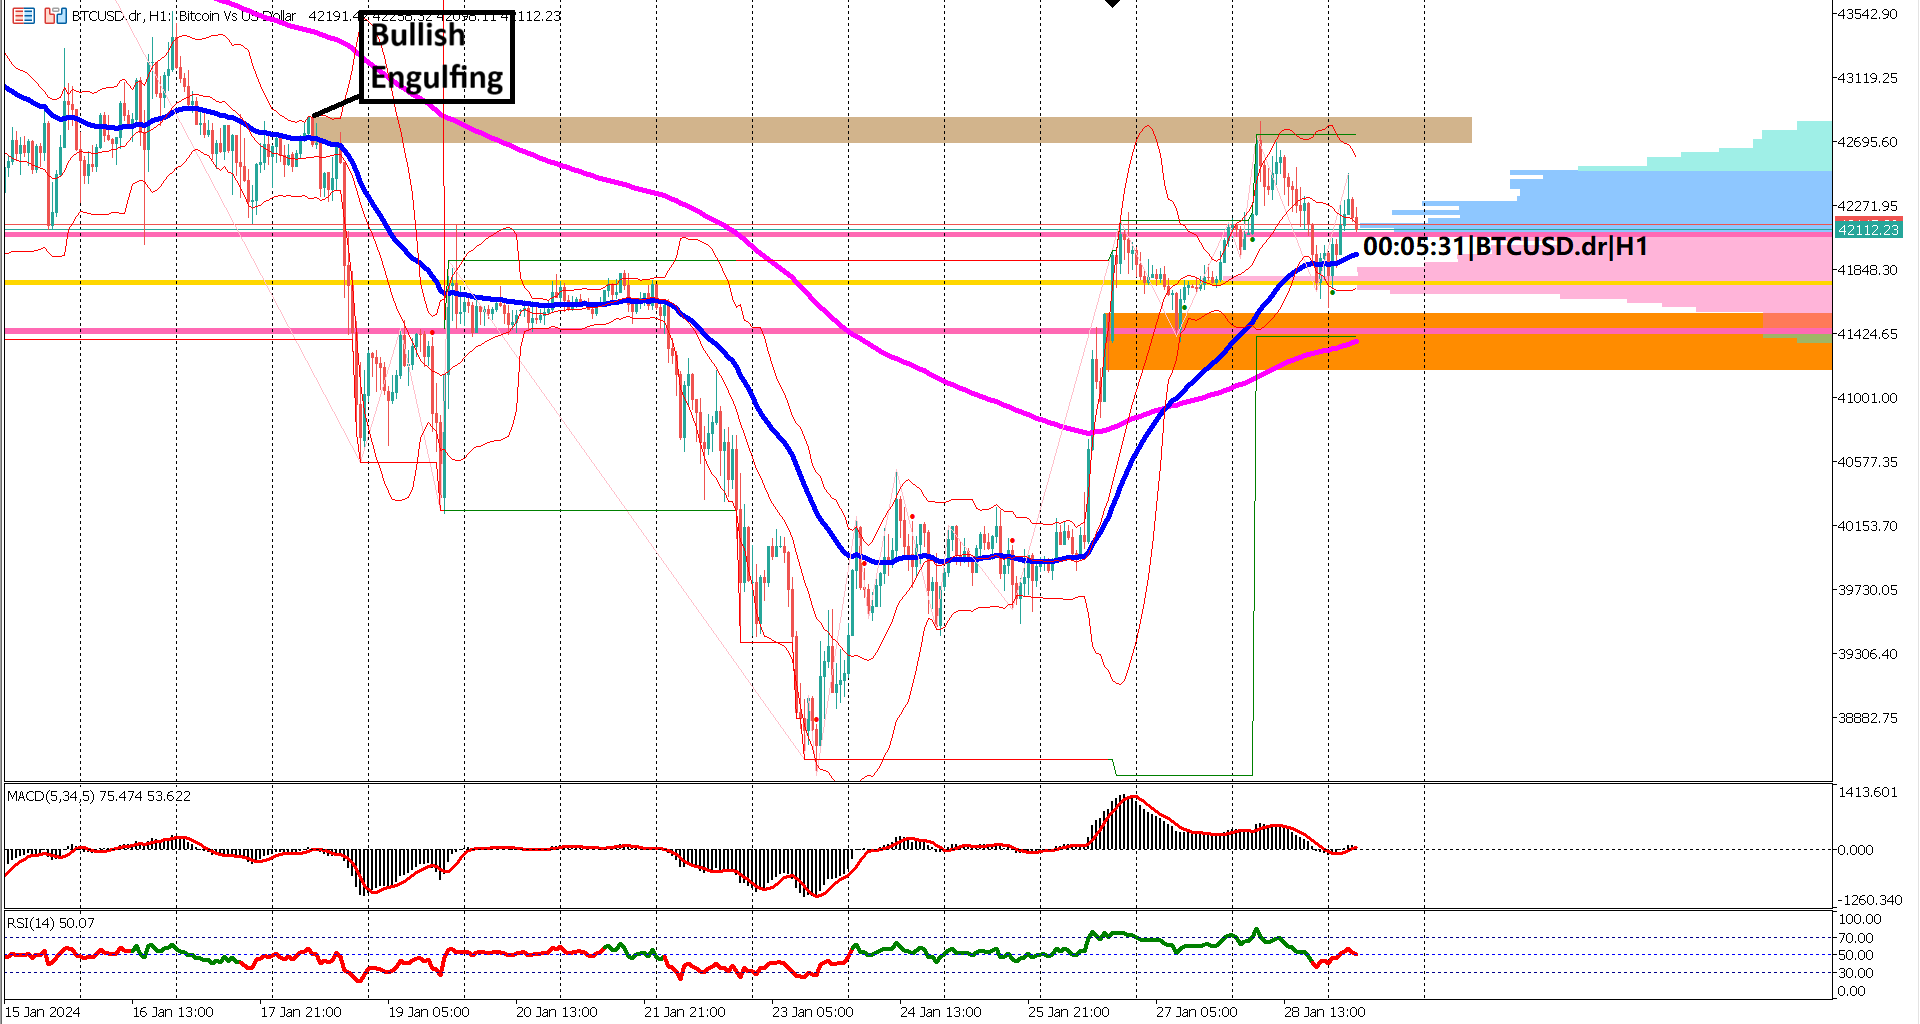
A noteworthy development on the charts is the formation of a golden cross, where the Exponential Moving Average (EMA) 50 crossed above the EMA 200. This technical occurrence typically signals a prolonged bullish trend. As these moving averages intertwine, the market sentiment leans toward optimism, suggesting that the upward trajectory might persist.
Despite encountering resistance, BTCUSD enjoys support at $41,190, positioned just below the EMA 200. This level serves as a crucial foundation, and any breach could trigger a deeper correction. Traders closely monitor this support to gauge the cryptocurrency's resilience against potential bearish pressures.
The Relative Strength Index (RSI) and Moving Average Convergence Divergence (MACD) oscillators provide a nuanced perspective. While the RSI recently breached the 40% threshold – traditionally a bearish signal – the subsequent failure to prompt a break below key support suggests a resilient market. Similarly, the MACD, after dipping below the 0 line, is now oscillating in a non-trending manner, reflecting the indecision prevalent in the current market conditions.
In conclusion, BTCUSD stands at a crossroads, juggling historical resistance, the promising golden cross, and critical support levels. Traders should remain vigilant, especially around the $42,870 resistance, for potential shifts in momentum. The interplay between technical signals and market dynamics creates an environment of uncertainty, urging traders to exercise caution and adapt their strategies accordingly.
As the cryptocurrency market continues to evolve, astute traders are poised to seize opportunities amid the nuanced interplay of bullish and bearish forces.
Historical Resistance Holds Fort: BTCUSD grapples with a historical resistance level at $42,870, marked by a significant bearish engulfing candlestick on January 17, 2024. This zone serves as a pivotal battleground for bulls and bears, demanding careful scrutiny.
Golden Cross Illuminates Bullish Momentum: The formation of a golden cross, where the EMA 50 crosses above the EMA 200, hints at a sustained bullish trend. This technical occurrence underscores the potential for upward momentum in the cryptocurrency.
Critical Support at $41,190: Positioned just below the EMA 200, the $41,190 support level acts as a crucial foundation for BTCUSD. Traders closely monitor this level, recognizing its significance in determining the cryptocurrency's resilience against potential bearish pressures.
Mixed Signals from RSI and MACD: The RSI's breach below the 40% threshold, conventionally a bearish signal, is juxtaposed against BTCUSD's refusal to break below key support. The MACD's oscillation around the 0 line adds to the market's indecision, highlighting the nuanced and evolving nature of current conditions.
Adaptability in Uncertain Times: BTCUSD traders navigate a complex landscape, requiring adaptability in response to the interplay of bullish and bearish forces. The $42,870 resistance zone becomes a focal point, demanding careful monitoring for potential shifts in market dynamics.
Actual -323M, Forecast -975M vs Previous -1,250M

Trading foreign exchange on margin carries a high level of risk, and may not be suitable for all investors. Before deciding to trade foreign exchange you should carefully consider your investment objectives, level of experience, and risk appetite.
Nothing contained in this website should be construed as investment advice. Any reference to an investment's past or potential performance is not, and should not be construed as, a recommendation or as a guarantee of any specific outcome or profit.