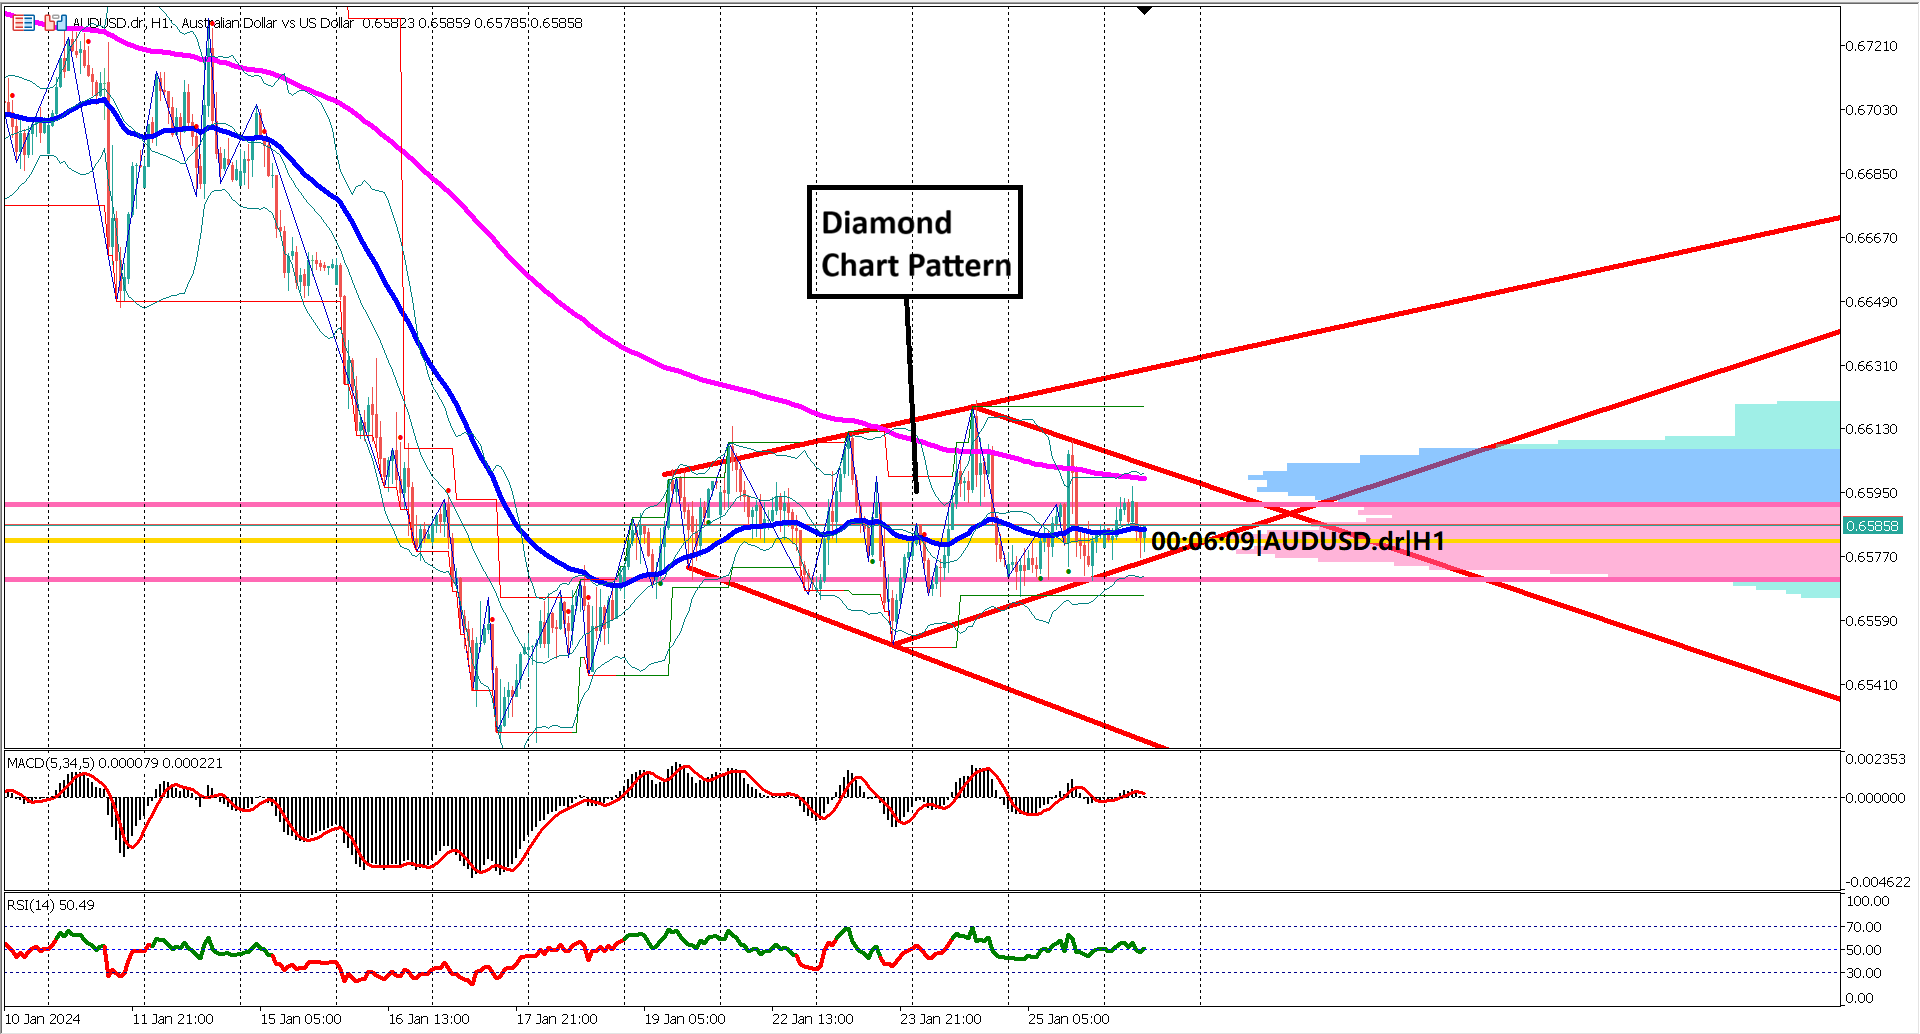
In the aftermath of the unexpected surge in US GDP figures, AUDUSD finds itself at a critical juncture, navigating the complex interplay of economic data and technical patterns. Here's a closer look at the current dynamics:
1. US GDP Boosts Dollar, Yet AUDUSD Remains Bearish: Yesterday's revelation of a higher-than-expected US GDP at 3.3% versus the forecasted 2.0% triggered a surge in the US dollar. However, the AUDUSD pair continues to lack a clear bullish market structure, maintaining its bearish trend
2. Diamond Chart Pattern on 1-Hour Chart Signals Reversal: On the 1-hour chart, a diamond chart pattern, typically indicative of a reversal, has emerged over the last five trading sessions. In the context of the prevailing bearish trend, this formation suggests a potential bullish reversal in the near future.
3. US GDP News Impact on Diamond Pattern Breakout: Despite the positive impact of the US GDP news, a clear bullish breakout from the diamond chart pattern on the 1-hour chart remains elusive. This development raises questions about the sustainability of the bullish sentiment, especially if prices break below the ascending trendline of the diamond pattern.
4. EMA 50 Flattening Amid Narrowing Gap with EMA 200: Technical indicators also signal caution. The EMA 50 is flattening, and its position below the EMA 200 hints at a bearish undertone. The diminishing gap between these two EMAs suggests a potential shift in momentum. If EMAs distance are getting wider, the bearish momentum shall continue.
5. Oscillator Signals and the Sideways Conundrum: Oscillator indicators, usually reliable in trending markets, present a challenge in this sideways scenario. With no clear trend over the past five trading sessions and the presence of a diamond chart pattern, traditional oscillator signals might lack reliability. Traders should exercise caution in interpreting signals in this nuanced context.
In Summary: Navigating the Diamond Crossroads: AUDUSD stands at a pivotal moment, torn between the bullish potential signaled by the diamond chart pattern and the bearish undertone highlighted by the persisting trend. A decisive breakout from the diamond pattern will likely determine whether a bullish reversal or a continuation of the bearish trend is in store for the pair. Traders should stay vigilant and monitor key levels for potential entry and exit points.
Forecast 0.2% vs Previous 0.1%
Forecast 3.0% vs Previous 3.2%
 Trading foreign exchange on margin carries a high level of risk, and may not be suitable for all investors. Before deciding to trade foreign exchange you should carefully consider your investment objectives, level of experience, and risk appetite.
Nothing contained in this website should be construed as investment advice. Any reference to an investment's past or potential performance is not, and should not be construed as, a recommendation or as a guarantee of any specific outcome or profit.
