
In the ever-evolving landscape of the forex market, GBPJPY takes center stage, driven by recent developments in the UK and the intricate dance of technical indicators. A crucial factor impacting the pair is the UK Consumer Price Index (CPI) hitting 2-year lows, setting a tone of economic uncertainty. The anticipation of a rate cut at the May MPC meeting adds another layer, with the Bank of England's forecast signaling the potential for a rate cut in May 2024.
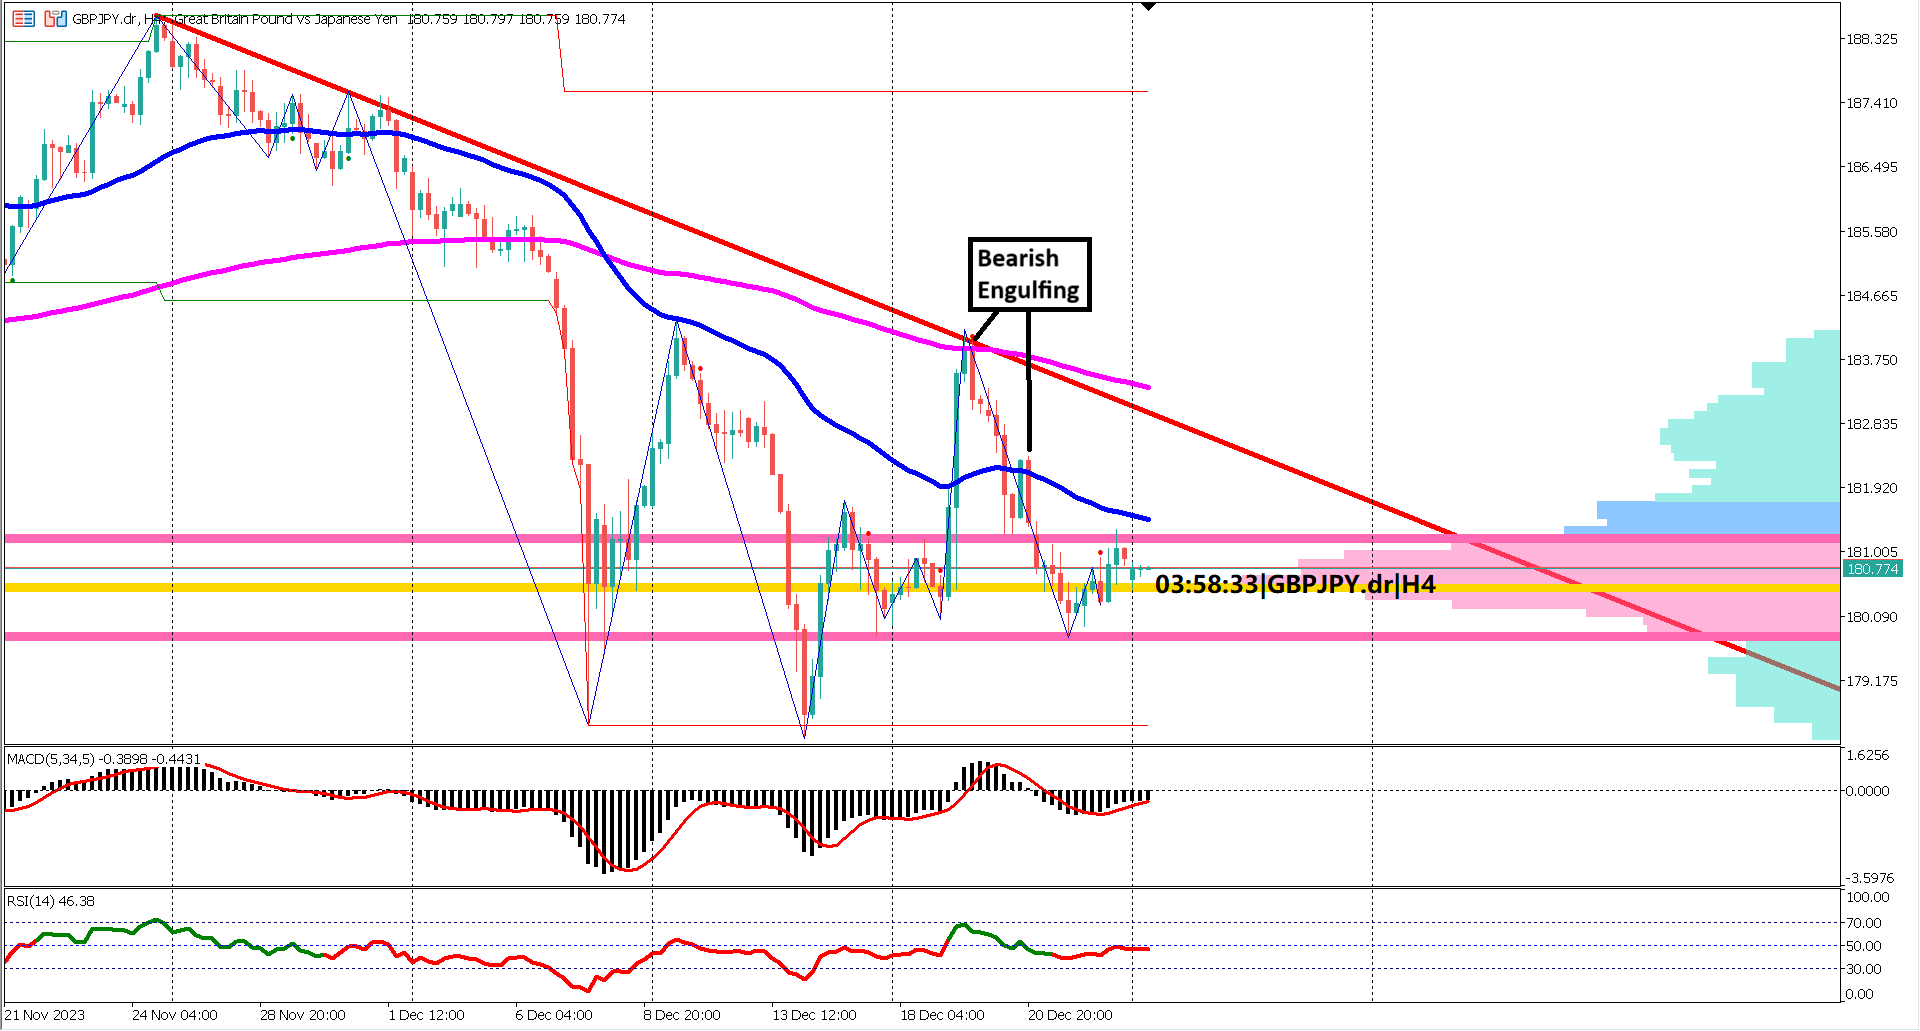
Zooming in on the 4-hour chart timeframe, GBPJPY's trend paints a bearish picture. The Exponential Moving Average (EMA) 50 positioned below EMA 200 signifies a prevailing bearish trend. The expansion of both lines underlines the momentum's strength, suggesting a sustained bearish sentiment.
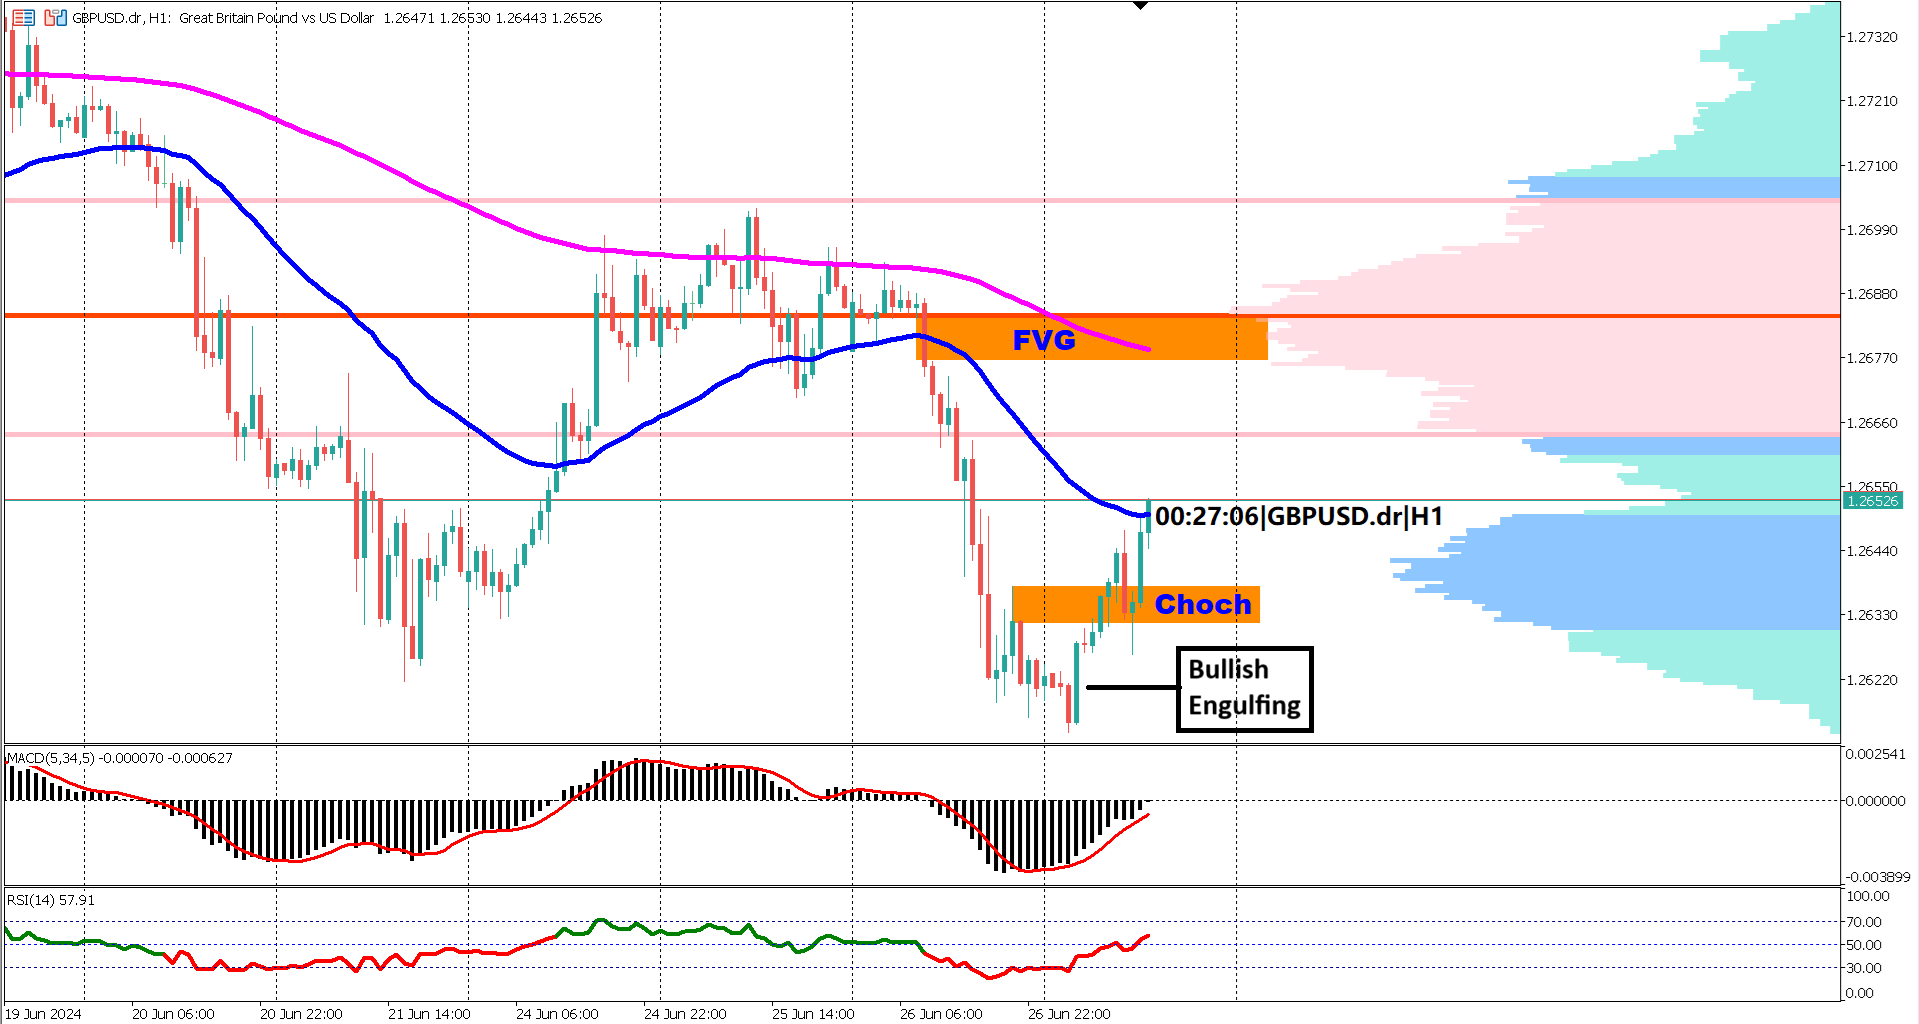
A bearish engulfing candlestick appeared when price touched EMA 200 this indicate that the EMA 200 is a strong dynamic resistance. Another bearish engulfing candlestick appeared when price touched EMA 50 proofing that EMA 50 provides a solid resistance. A break above these 2 EMAs may provide early indication of a bullish reversal, a confirmation of the bullish reversal would be when there's a golden cross of EMA 50 & 200.
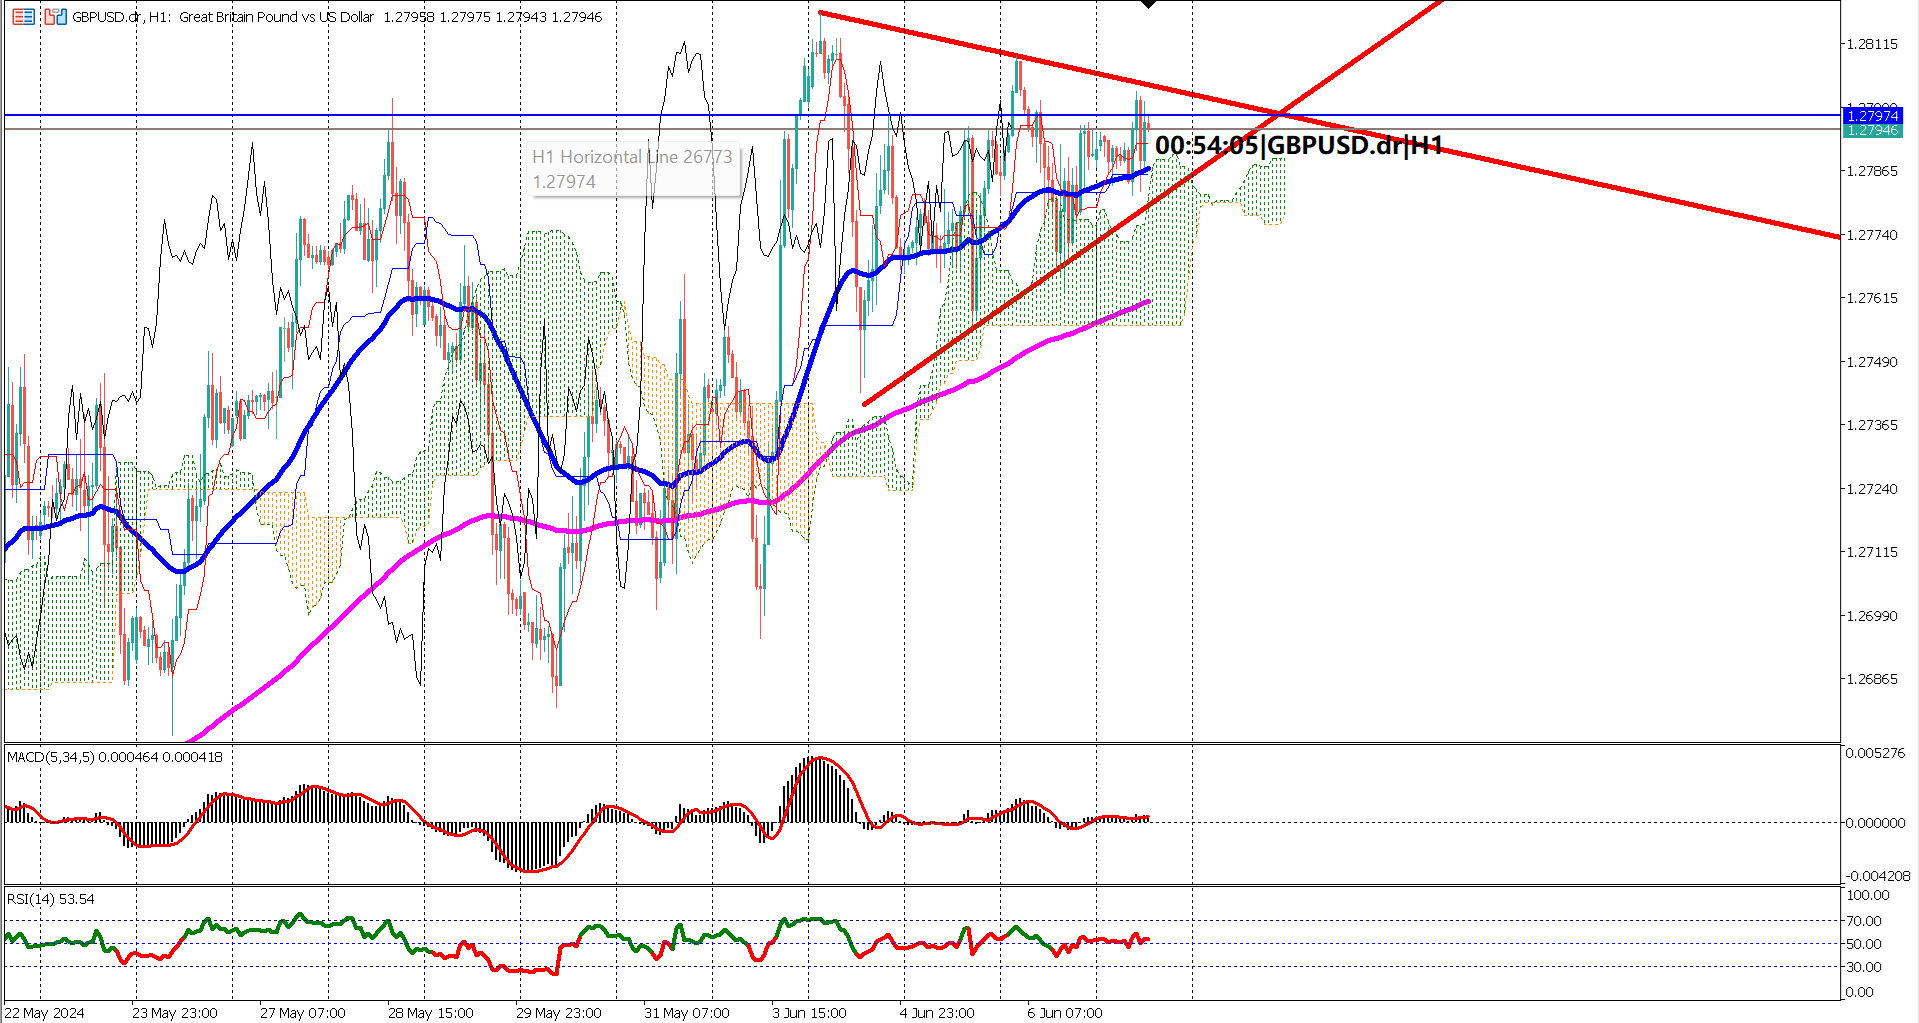
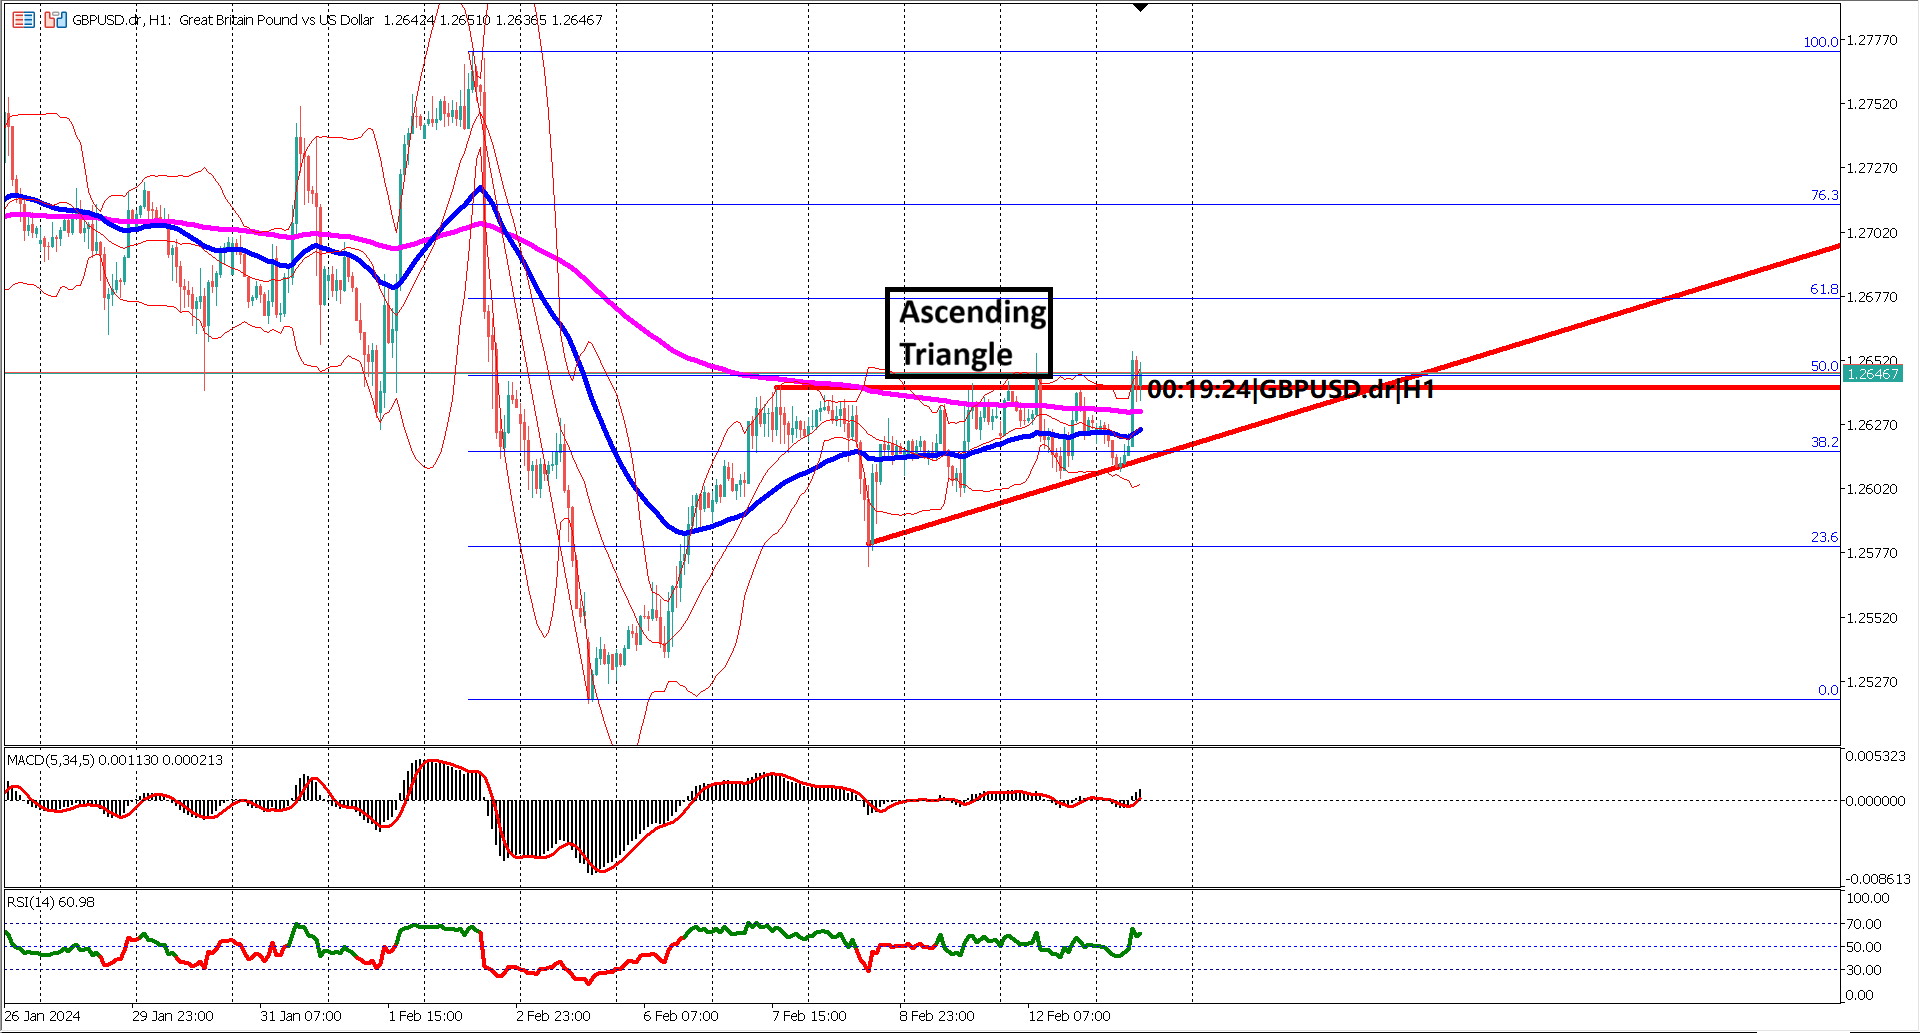
Key technical levels become crucial navigational markers. The resistance at 187.57 emerges as a pivotal point, a breach of which might signal a robust bullish reversal. Breaking a descending red-colored trendline to the upside may provide early signals especially with a substantial bullish Marubozu candlestick breaking this trendline may offer a more potent reversal indication.
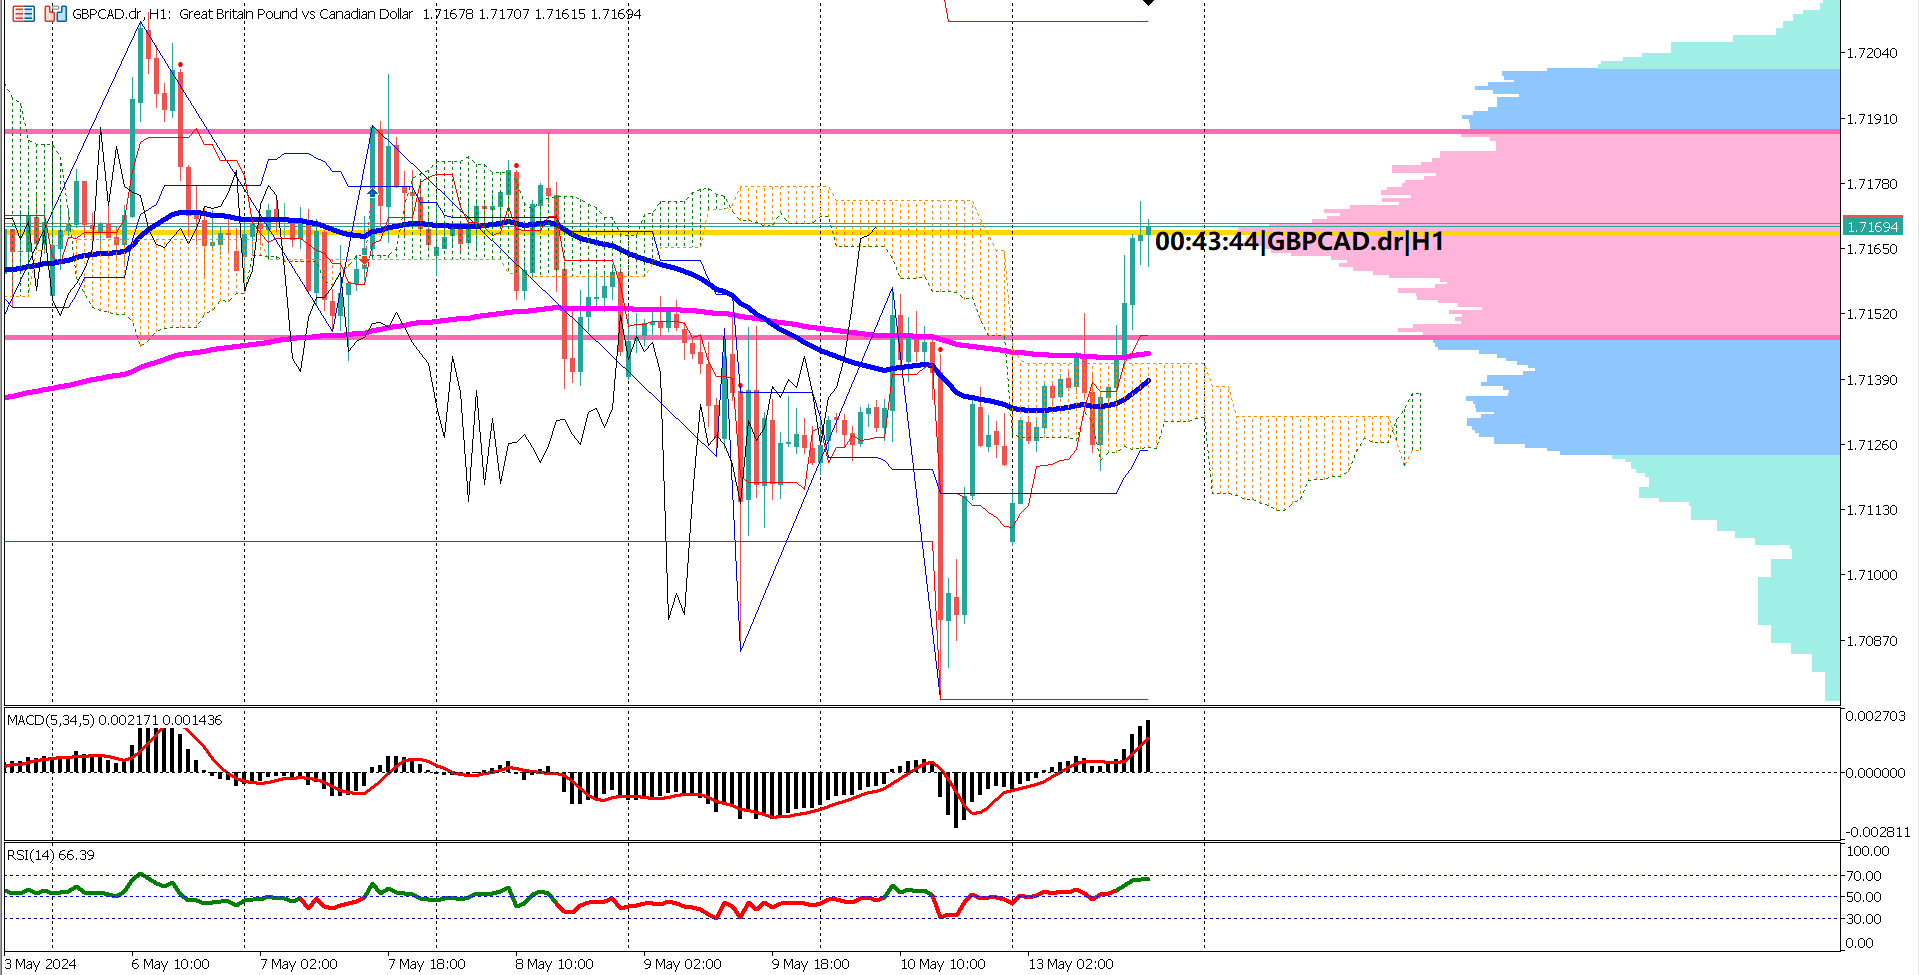
Delving into the Volume Profile indicator reveals a neutral trend, with prices oscillating within the value area denoted by pink horizontal lines. A breakout to the upside of the value area could signify a shift towards a bullish trend, while a downside break might indicate a bearish turn.
The oscillator indicators add depth to the analysis. The MACD histogram and signal line residing below the 0 line align with a bearish outlook, suggesting potential downward pressure. Similarly, the Relative Strength Index (RSI) breaking the 40% level and steadfastly remaining below 60% paints a consistent picture of bearish dominance.
In summation, GBPJPY is ensconced in a bearish trend, reflecting the broader economic uncertainties and technical signals. As traders navigate these trends, the intricate dance of indicators and economic nuances becomes pivotal for strategic decision-making in the GBPJPY trading landscape.

Trading foreign exchange on margin carries a high level of risk, and may not be suitable for all investors. Before deciding to trade foreign exchange you should carefully consider your investment objectives, level of experience, and risk appetite.
Nothing contained in this website should be construed as investment advice. Any reference to an investment's past or potential performance is not, and should not be construed as, a recommendation or as a guarantee of any specific outcome or profit.