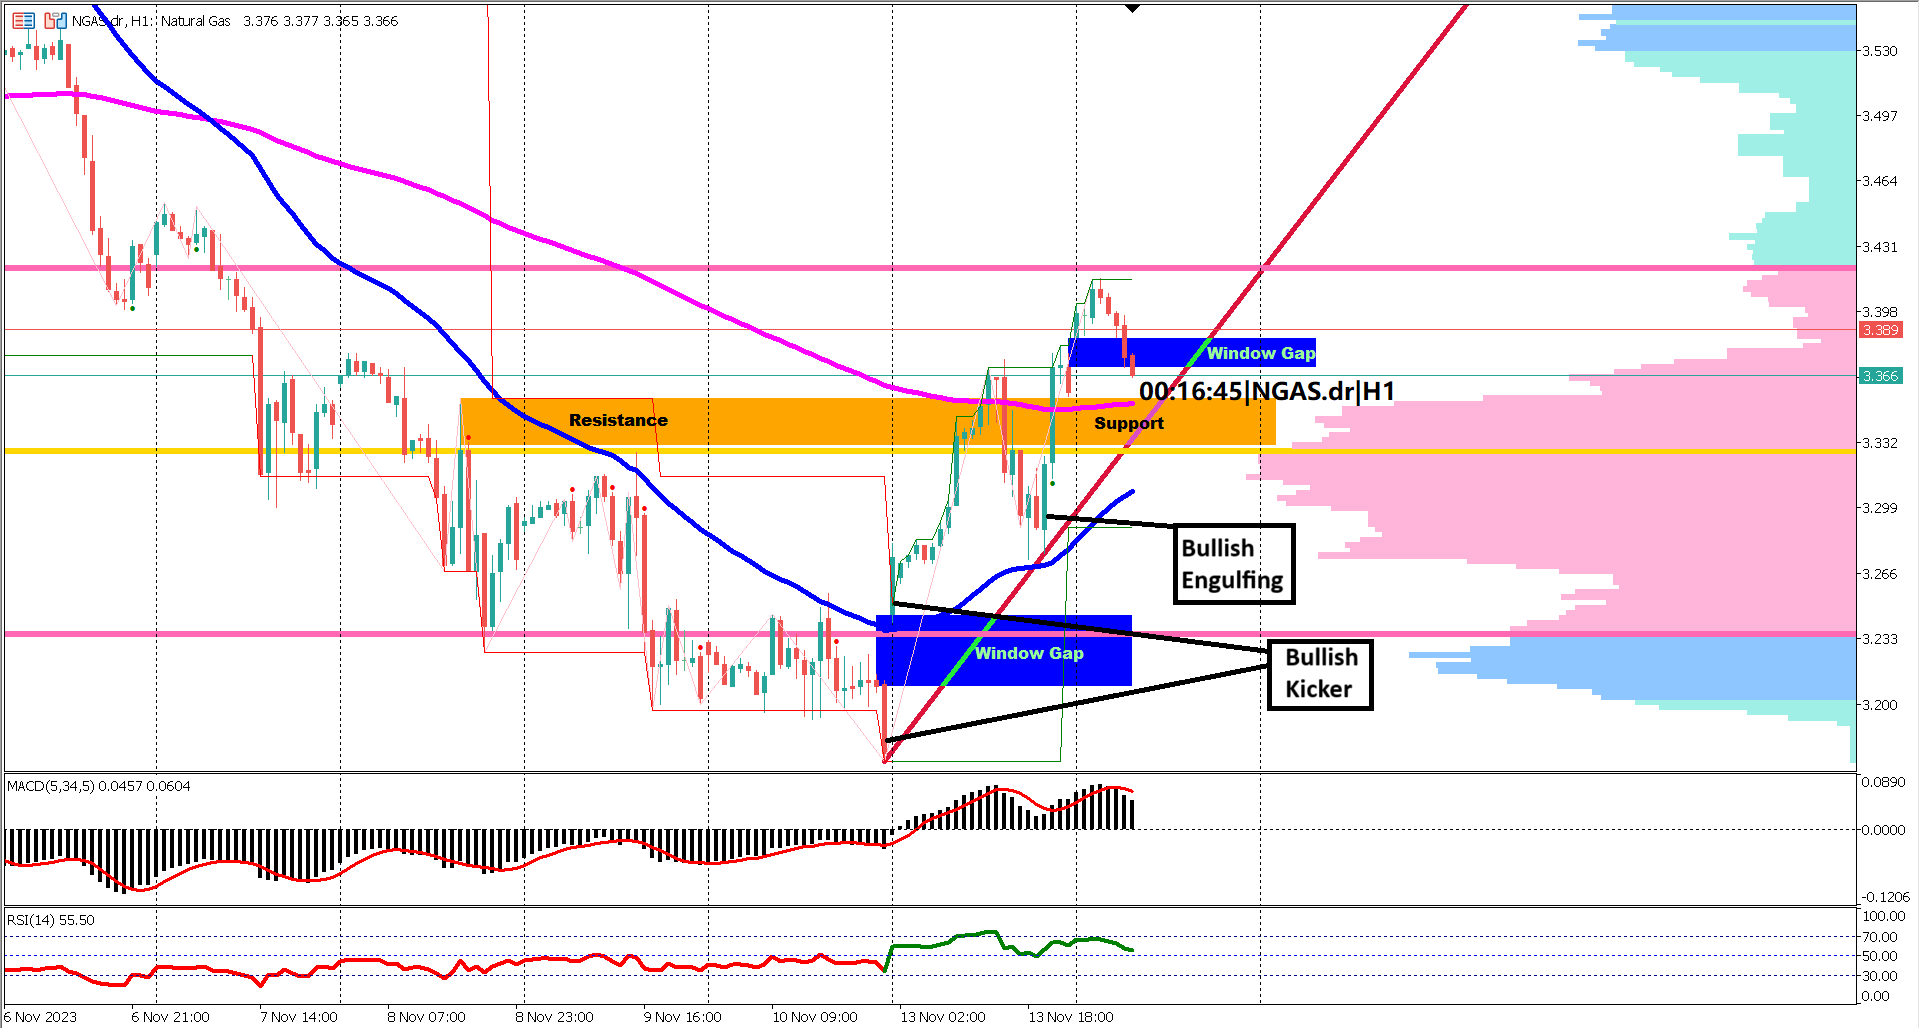
NGAS has experienced a significant 14% decline from its yearly high of 3.69. The bearish phase concluded with a Bullish Kicker candlestick pattern, initiating a subsequent bullish rally that successfully breached the key resistance level (highlighted in an orange rectangle) and thrust through the EMA 200 level on two occasions. Following the second breakout, a corrective phase unfolded towards the previous resistance, now acting as a support. The crucial juncture lies in whether this support holds, potentially paving the way for a bullish golden cross between the EMA 50 and EMA 200. However, a failure to maintain support, closing below the bullish engulfing pattern, might lead to a further descent below the low established by the Bullish Kicker pattern.

Delving into the oscillator indicators, RSI and MACD continue to signal a bullish trend. Both the histogram and signal line remain positioned above the 0 line, while the RSI maintains its stance above the 40 level. Sustaining these levels could propel natural gas prices further upward.
In summary, the bullish trend for Natural Gas is still evolving. The potential for a continued bullish rally exists as long as prices remain above the key support level and the bullish engulfing pattern. To maintain bullish momentum, it's essential for the oscillators, particularly the MACD, to stay above the 0 level, with the RSI avoiding a dip below the 40 level.
Actual -2.6% vs Forecast 0.7%
Forecast 665.0B vs Previous 2,310.0B
GBP, Unemployment Rate
Forecast 4.3% vs Previous 4.2%
Trading foreign exchange on margin carries a high level of risk, and may not be suitable for all investors. Before deciding to trade foreign exchange you should carefully consider your investment objectives, level of experience, and risk appetite.
Nothing contained in this website should be construed as investment advice. Any reference to an investment's past or potential performance is not, and should not be construed as, a recommendation or as a guarantee of any specific outcome or profit.
