
Parity Technologies, the company behind the Polkadot blockchain, is implementing a significant workforce reduction, cutting approximately 30% of its employees, which amounts to around 100 staff members. This move comes in response to a broader trend of staffing cuts within the cryptocurrency industry. In the past two days, following the announcement, Polkadot has experienced a notable downward correction in its price. Other companies in the cryptocurrency technology sector, such as Polygon Labs and Circle, have also disclosed layoffs in the past year.
The decentralized finance (DeFi) sector, encompassing decentralized exchanges and peer-to-peer lending platforms, has encountered challenges due to diminishing risk appetite and increased volatility in the cryptocurrency market. Despite this, the overall cryptocurrency industry has been steadily rising over the last couple of weeks. This upward momentum is supported by positive news related to ongoing SEC lawsuits.
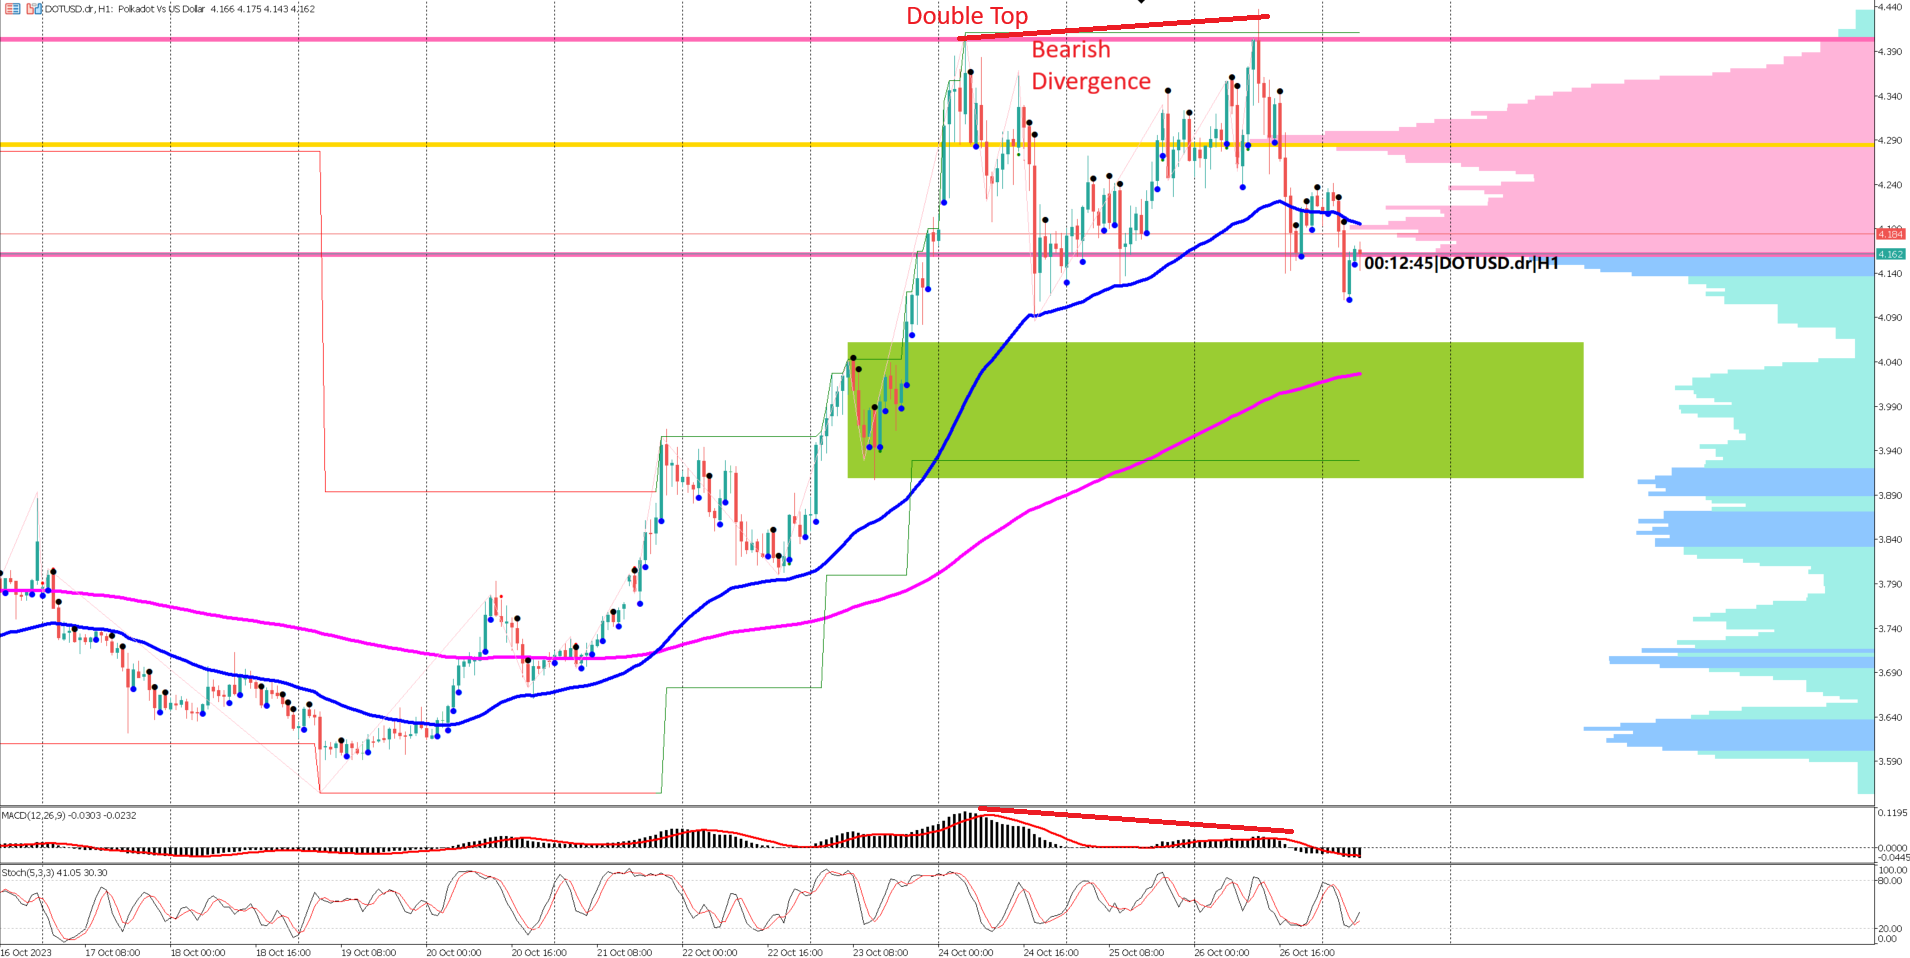
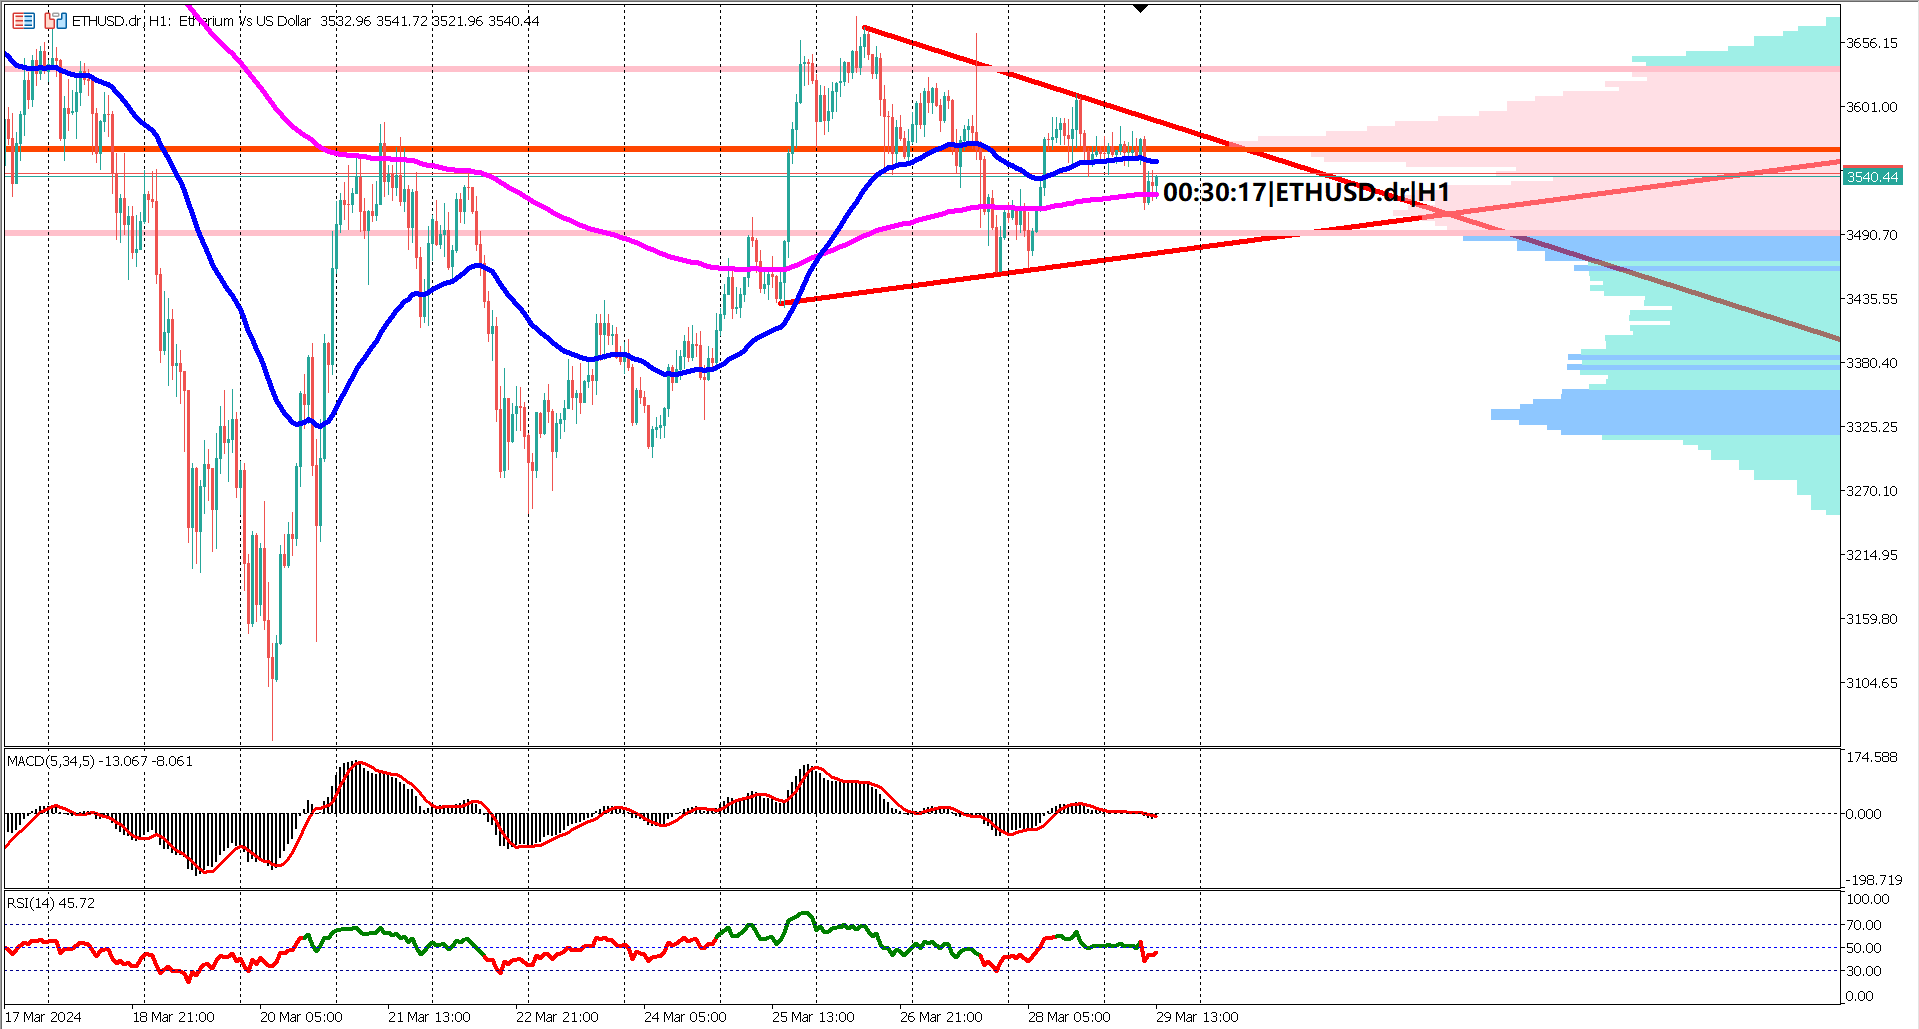
Recently, a bearish pattern known as the "double top" has emerged in Polkadot's price action. While this pattern may not necessarily signal a complete bearish reversal, it indicates that the bulls might be slowing down, possibly taking a breather and moving sideways. Bearish divergence is observed when the price briefly forms a higher high, but the MACD (Moving Average Convergence Divergence) indicator does not follow the same upward trajectory. An important support level to monitor lies in the range of $3.80 to $4.00, as depicted within a green rectangle on the chart.
Despite the presence of the double top pattern and bearish divergence, the market maintains a bullish outlook, indicated by the EMA 50 (Exponential Moving Average with a 50-period setting) positioned above the EMA 200. This mixed signal, originating from the candlestick reversal pattern and EMAs, suggests that the market may be slowing down after a recent bullish rally. The EMA 200 serves as a dynamic key support level, in addition to the aforementioned support range between $3.80 and $4.00.
The Volume Profile indicator is a valuable tool for identifying key support levels. It typically reflects shifts from a point of high volume (point of control) to a low volume node. This low volume node can be recognized as a potential turning point zone, acting as both support and resistance. In the volume profile, this low volume node is denoted by a light blue color. In this context, both the EMA 200 and the key support range of $3.80 to $4.00 coincide with this low volume node, making them crucial areas to monitor for potential price movements.
Forecast 0.3% vs Previous 0.1%
Forecast 3.7% vs Previous 3.9%

Trading foreign exchange on margin carries a high level of risk, and may not be suitable for all investors. Before deciding to trade foreign exchange you should carefully consider your investment objectives, level of experience, and risk appetite.
Nothing contained in this website should be construed as investment advice. Any reference to an investment's past or potential performance is not, and should not be construed as, a recommendation or as a guarantee of any specific outcome or profit.