
Amidst recent market movements, XAUUSD (Gold) undergoes a significant shift, with bearish sentiment dominating the scene. Here's a breakdown of the latest developments:
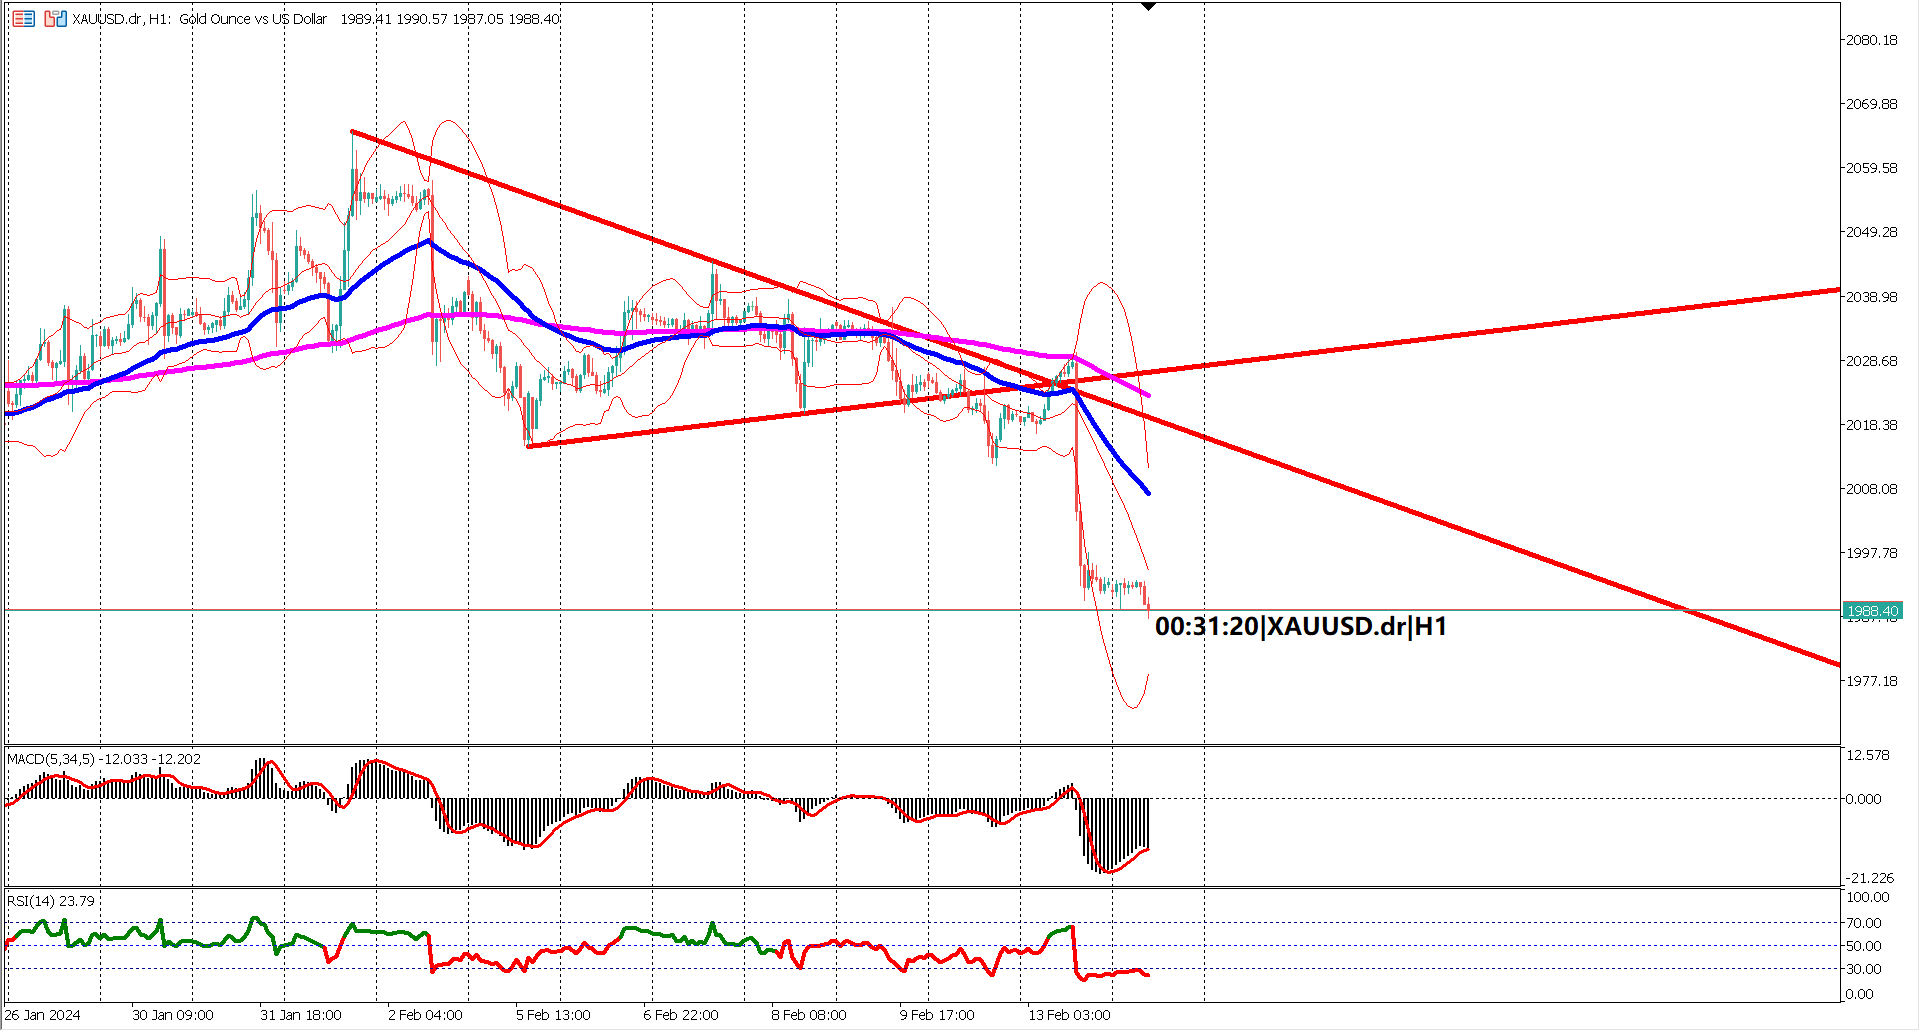
XAUUSD has recently broken below its ascending trendline, marking a notable reversal in the trend. This bearish signal suggests a potential downturn in prices, prompting traders to adopt a cautious approach.
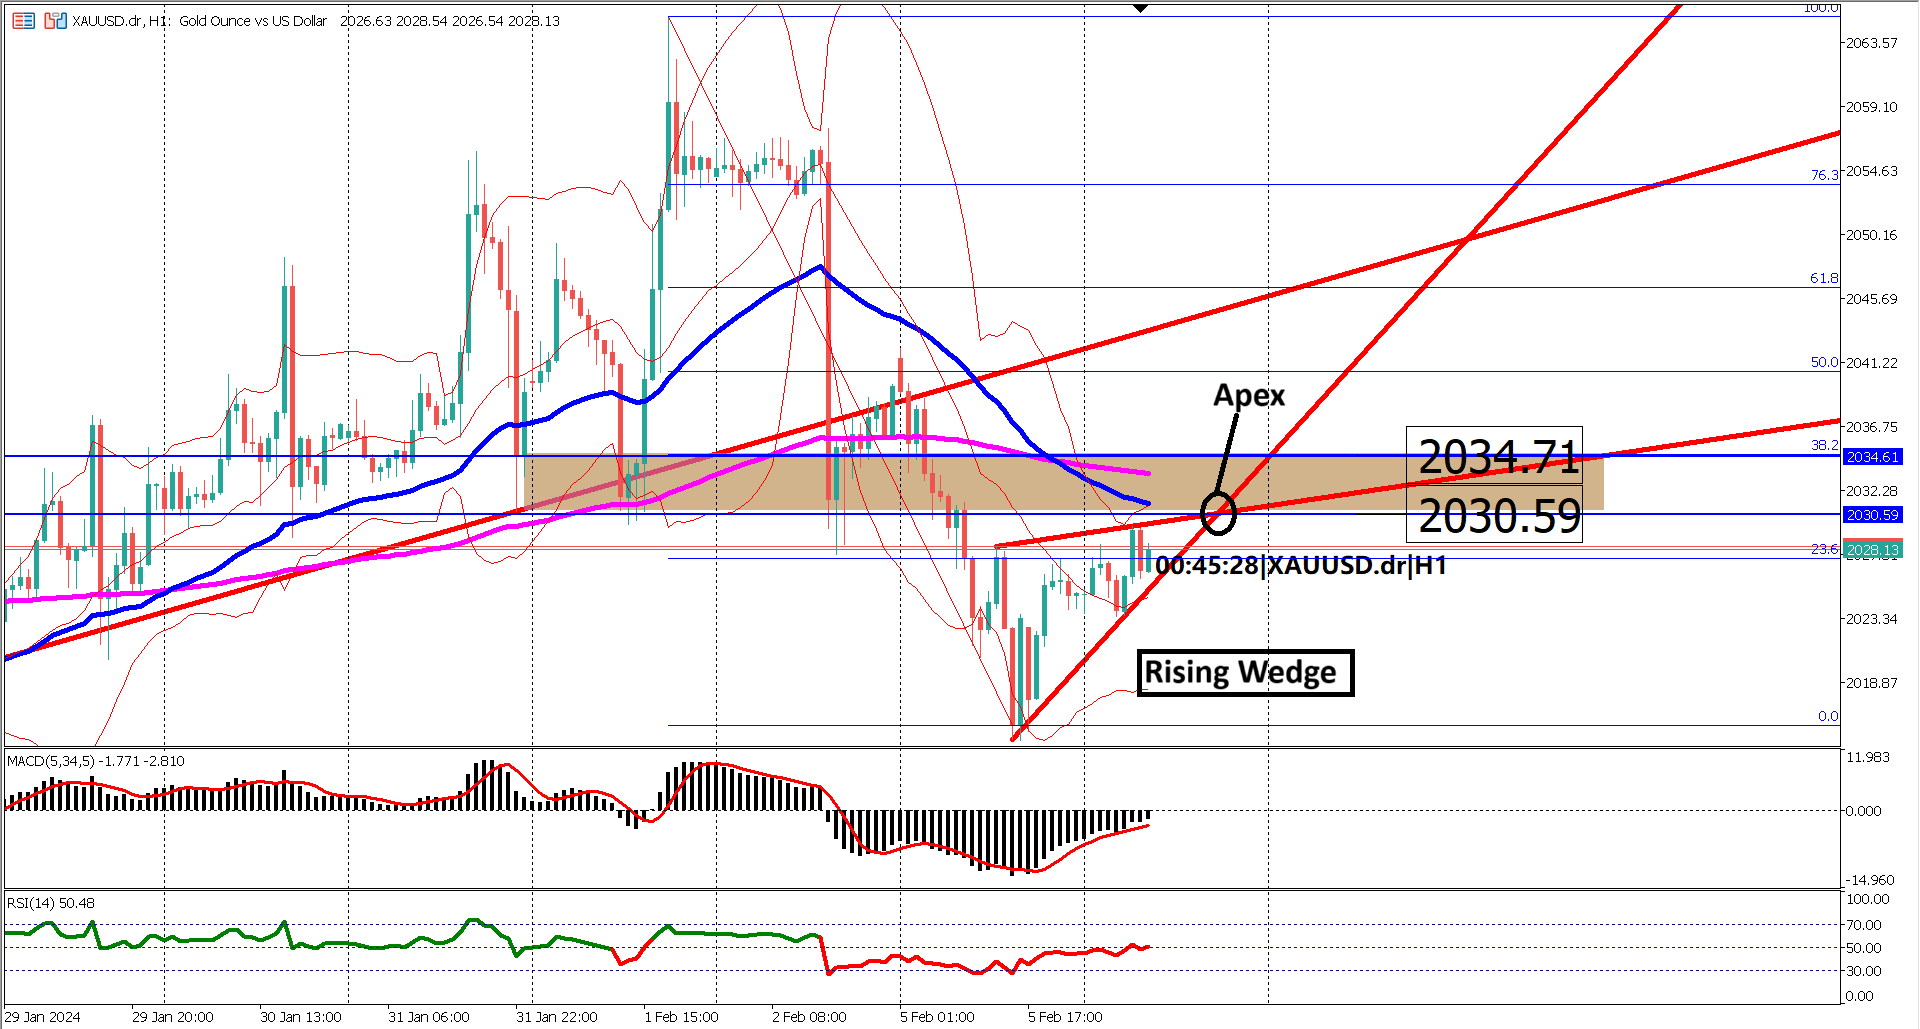 Following a steep decline of 2.5% from $2065 to $2014, XAUUSD experiences a slight rebound. However, attention shifts to key resistance levels, particularly the 38.2% Fibonacci retracement at $2034. This zone holds significance as a potential barrier to further upside movement.
Adding to the bearish narrative is the confirmation of a death cross between the EMA 50 and EMA 200. This technical crossover underscores the strength of the bearish reversal, with EMA 200 likely to act as a formidable resistance level amidst price retracements.
The current bounce in prices forms a rising wedge chart pattern, characterized by converging trendlines. The apex of this pattern, intersecting at $2030, emerges as a critical resistance level to monitor. Traders keenly observe whether prices can breach this barrier or succumb to further downside pressure.
While the Bollinger Bands contract, signaling reduced volatility, prices struggle to breach the upper band. This suggests that bearish momentum remains dominant, limiting upward price movements.
Examining oscillator indicators, both RSI and MACD continue to reflect bearish trends. The MACD signal line lingers below the 0 level, indicating downward momentum, while the RSI remains within bearish territory, ranging between 0% and 60% over the past 24 hours.
In conclusion, XAUUSD's outlook remains bearish, with the current bounce or corrective phase potentially offering selling opportunities at higher price levels. Traders remain vigilant, closely monitoring key resistance levels and technical signals for further insights into market direction.
Bearish Reversal: XAUUSD exhibits a clear bearish reversal signal with the break below its ascending trendline, indicating a shift in market sentiment towards the downside.
Resistance Levels: Traders should closely monitor key resistance levels, particularly the 38.2% Fibonacci retracement at $2034 and the EMA 200, which may act as significant barriers to further upside movement.
Technical Confirmations: The confirmation of a death cross between the EMA 50 and EMA 200 underscores the strength of the bearish reversal, reinforcing the importance of these moving averages as resistance levels.
Rising Wedge Pattern: The formation of a rising wedge chart pattern suggests a potential continuation of the bearish trend, with the apex of the pattern serving as a critical resistance level at $2030.
Bearish Momentum: Oscillator indicators such as the MACD and RSI continue to reflect bearish momentum, with the MACD signal line below the 0 level and the RSI remaining within bearish territory, indicating further downside pressure.
Forecast 1.8% vs Previous -3.9%
Forecast 55.0 vs Previous 56.3

Trading foreign exchange on margin carries a high level of risk, and may not be suitable for all investors. Before deciding to trade foreign exchange you should carefully consider your investment objectives, level of experience, and risk appetite.
Nothing contained in this website should be construed as investment advice. Any reference to an investment's past or potential performance is not, and should not be construed as, a recommendation or as a guarantee of any specific outcome or profit.