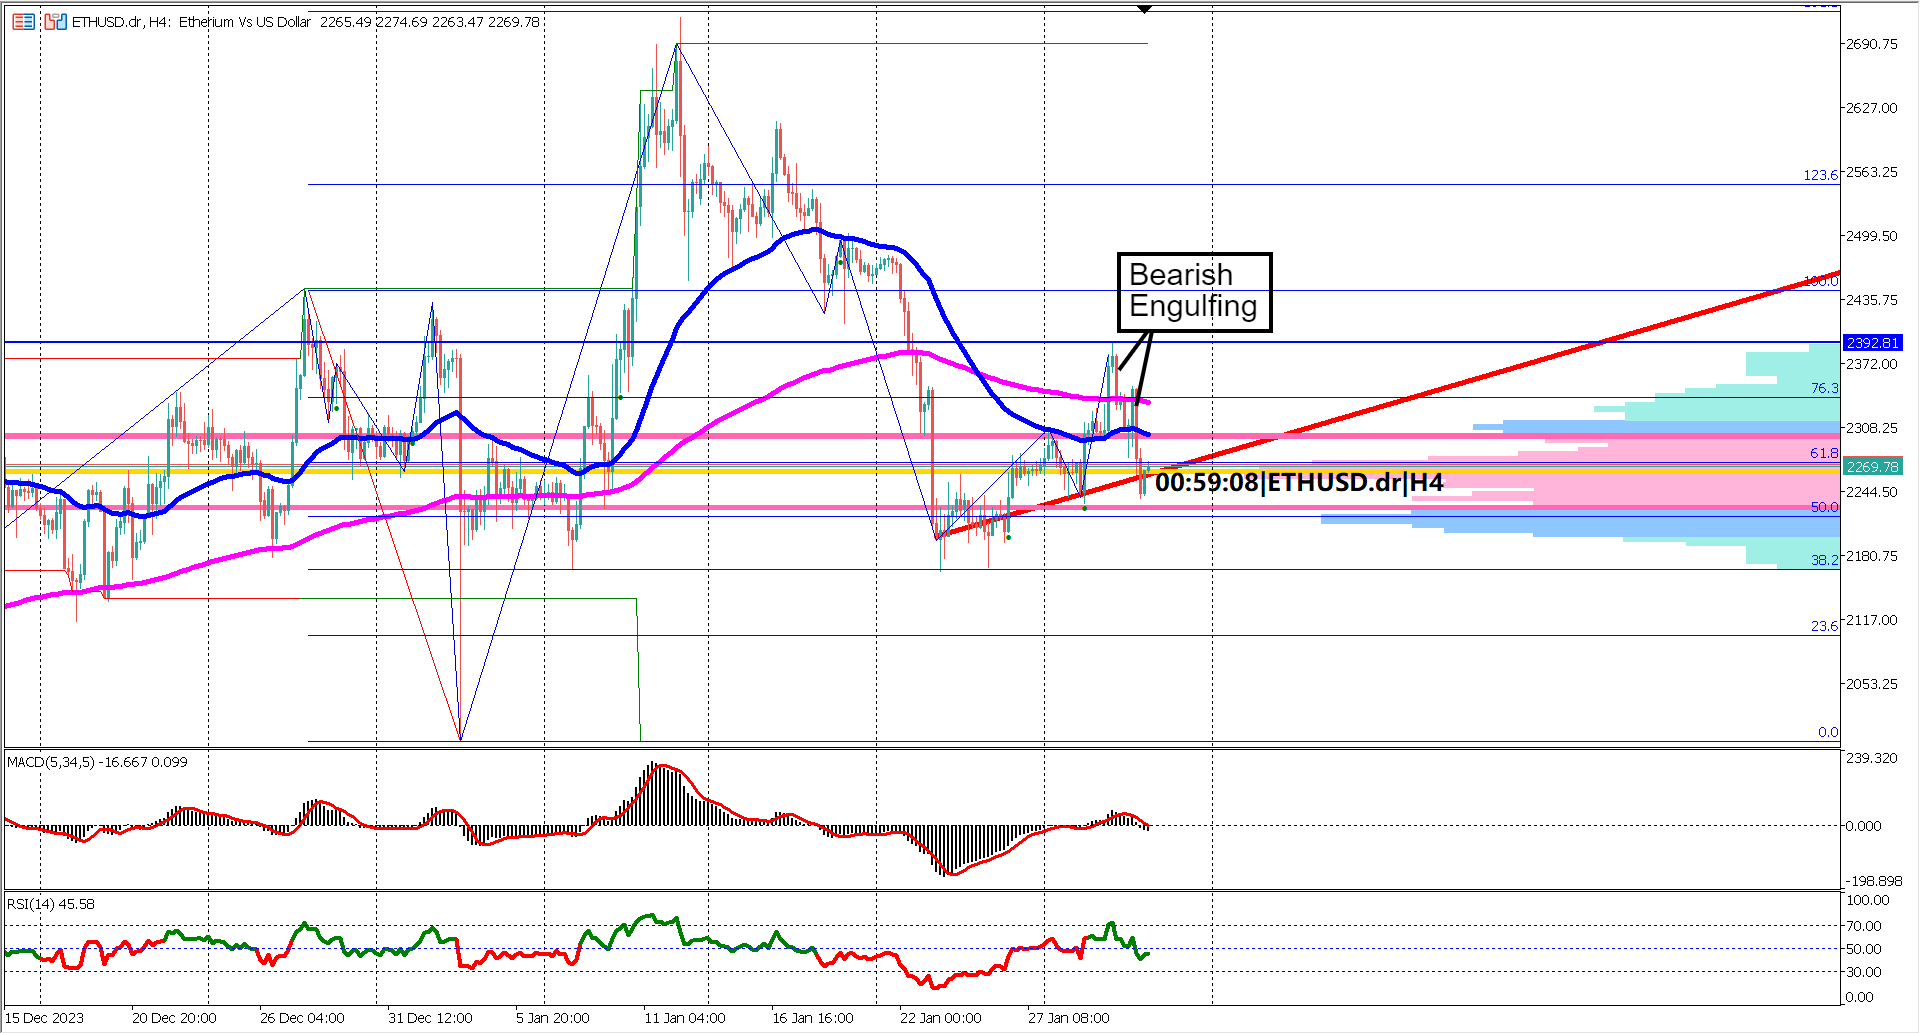

ETHUSD has experienced a notable 12% surge over the past week, reflecting a bullish sentiment in Ethereum's market. However, recent price declines touching the previous swing low around $2472 suggest that bulls may be taking profits, with key support levels identified between $2472 and $2461.
Bearish signals have emerged, notably with the appearance of a shooting star candlestick at the peak of the recent bullish rally. Subsequent bearish engulfing candlesticks further indicate a potential shift in sentiment towards bearish territory.
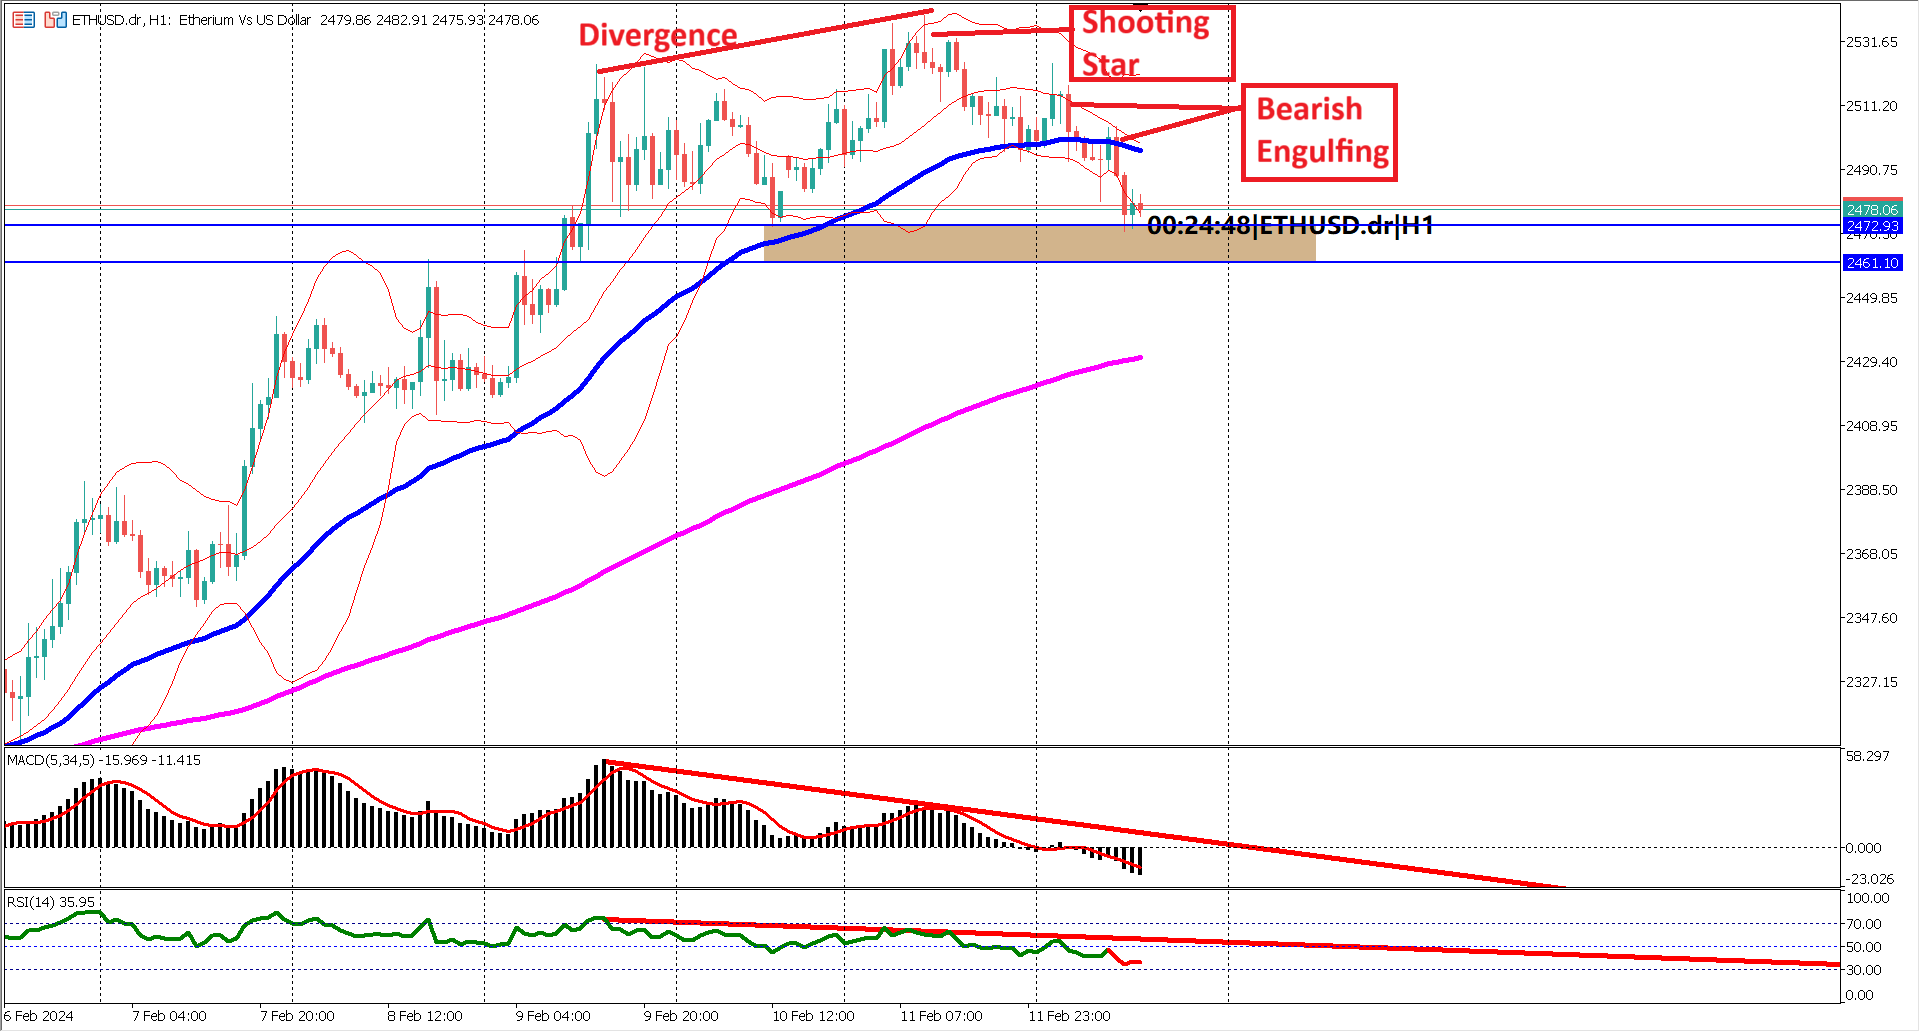
Adding to the cautious outlook, the EMA 50 has started bending towards the EMA 200, signaling a weakening of bullish momentum. This suggests that prices may find support somewhere between these key moving averages.
Furthermore, the break below the lower Bollinger band indicates a short-term bearish trend, possibly signaling a corrective phase in the market. This sentiment is echoed by both MACD and RSI indicators, which have turned bearish. The MACD signal line crossing below the 0 line and the RSI dropping below 40% confirm the bearish divergence, indicating a higher likelihood of downward price movement.
As ETHUSD navigates these shifting market dynamics, traders should remain vigilant and monitor key support levels and indicators for potential trading opportunities.

Trading foreign exchange on margin carries a high level of risk, and may not be suitable for all investors. Before deciding to trade foreign exchange you should carefully consider your investment objectives, level of experience, and risk appetite.
Nothing contained in this website should be construed as investment advice. Any reference to an investment's past or potential performance is not, and should not be construed as, a recommendation or as a guarantee of any specific outcome or profit.