
In the dynamic world of cryptocurrency, ETHUSD has been navigating a shallow bearish correction over the past 24 trading sessions, following a noteworthy 20% drop from $2717 to $2166. This correction, however, is not without its nuances and potential turning points.
One notable feature on the chart is the emergence of a clear ascending trendline amid the bearish correction. The significance of this trendline lies in its potential to either signal a bearish trend continuation or mark the starting point of a bullish reversal. Recent price action has seen ETHUSD testing the boundaries of this trendline, with a tentative break that awaits confirmation through sustained open and close movements below this critical level.
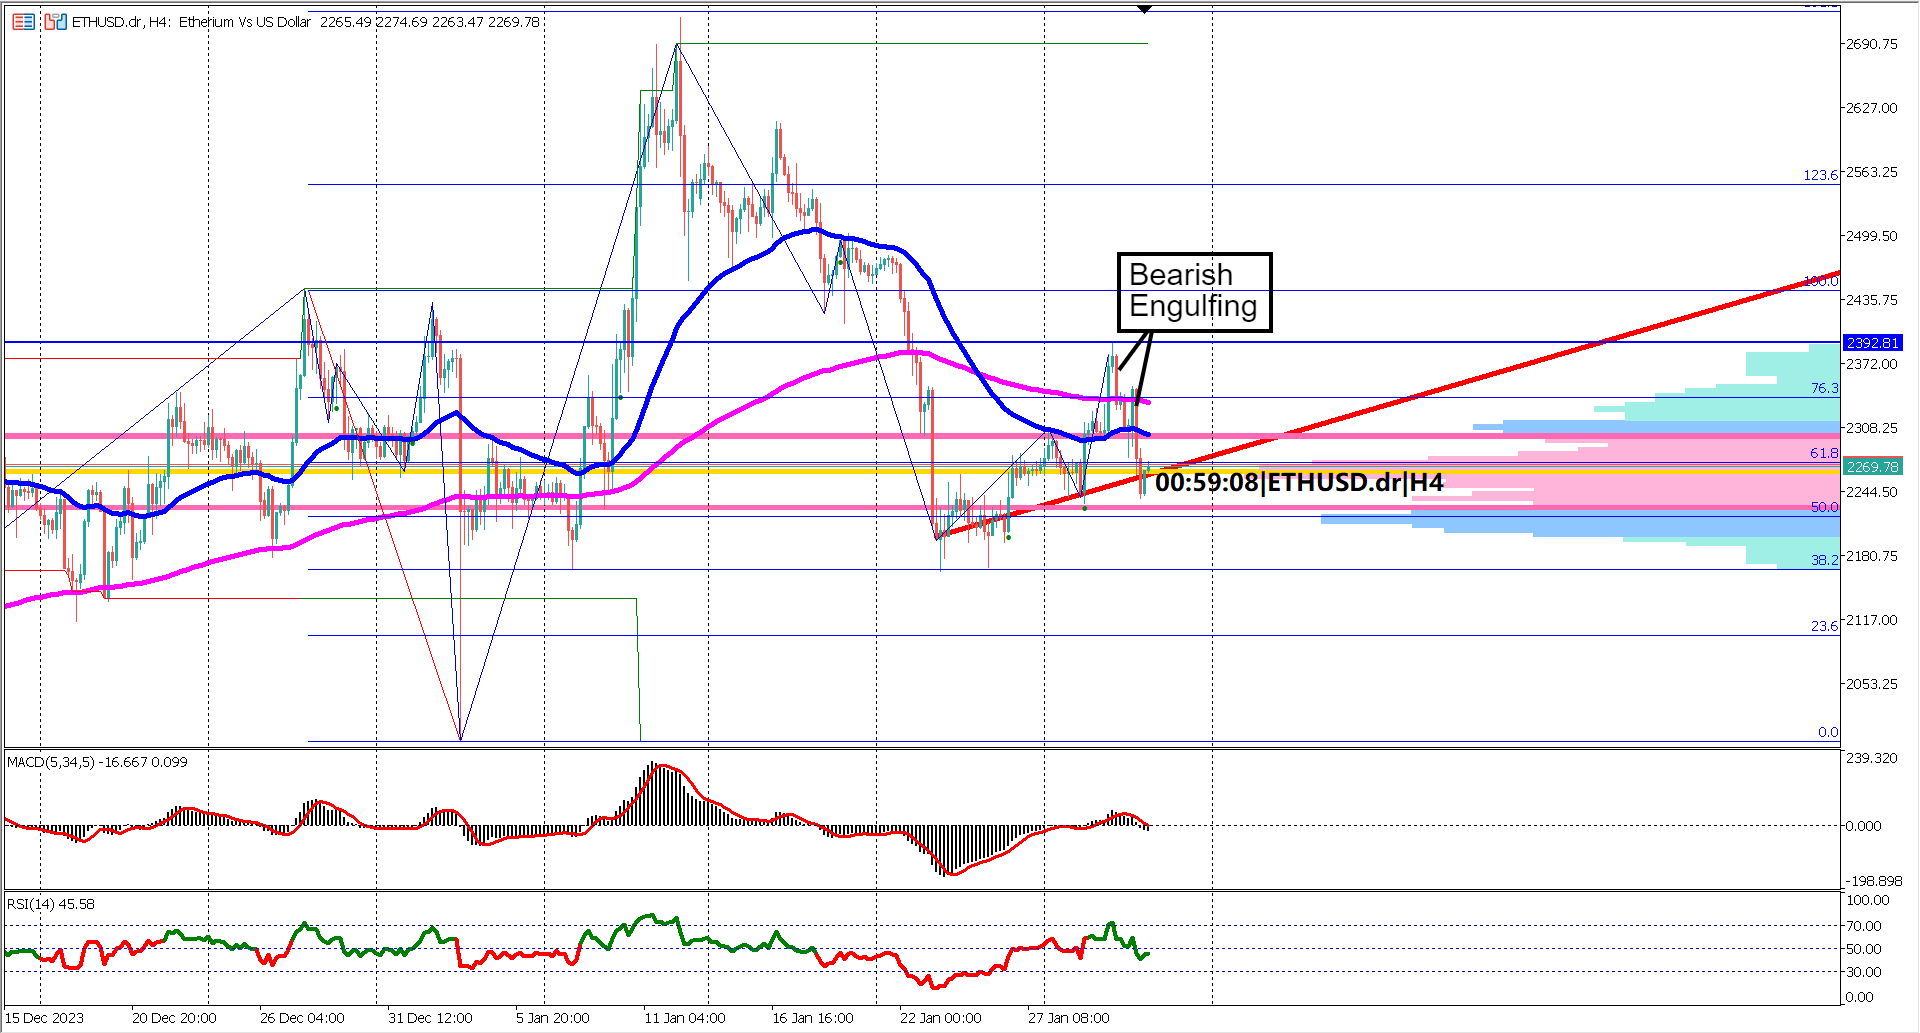
Adding to the intrigue are two distinct bearish engulfing candlestick patterns that materialized at the pinnacle of the bearish correction. These candlestick formations serve as potent signals of bearish pressure. However, the narrative could swiftly change if prices manage to surge above the highest point of these engulfing patterns, indicating a resurgence of bullish sentiment.
Zooming out to the broader picture, the interaction between the Exponential Moving Averages (EMA) 50 and 200 reveals a notable development. The formation of a death cross, where the EMA 50 crosses below the EMA 200, signals a reversal in the trend towards bearish territory. The divergence between the two EMAs amplifies the notion that bearish momentum is steadily gaining strength.
Turning our attention to oscillator indicators, the Relative Strength Index (RSI) remains in bullish territory, holding above the crucial 40% level. However, the Moving Average Convergence Divergence (MACD) is inching closer to a potential bearish crossover, as the signal line approaches the zero level.
In conclusion, ETHUSD is delicately poised at the intersection of trendlines, candlestick patterns, and moving averages. Traders must keenly watch for decisive moves below the ascending trendline for potential bearish confirmation or a resilient surge above the bearish engulfing candlestick patterns to herald a bullish resurgence. The interplay of technical indicators suggests a landscape where both bears and bulls are vying for dominance, making each move crucial in shaping the future trajectory of ETHUSD.
Shallow Correction Dynamics: Over the last 24 trading sessions, ETHUSD has undergone a shallow bearish correction, with prices retracing nearly 20% from $2717 to $2166.
Trendline Tussle: A clear ascending trendline defines the ongoing correction. Breaking below this trendline could signal a continuation of the bearish trend, while a sustained rebound might indicate bullish resurgence.
Bearish Engulfing Signals: Two bearish engulfing candlestick patterns at the peak of the correction suggest significant bearish pressure. A breakout above the highest bearish engulfing candlestick could mark a return of bullish momentum.
EMA Death Cross Confirmation: The EMA 50 and 200 have formed a death cross, signaling a reversal in the trend to bearish. The growing divergence between EMA 50 and 200 indicates an amplifying bearish momentum.
Oscillator Insights: RSI remains bullish, holding above the 40% level, while MACD teeters on the brink of a potential bearish signal. The oscillators add complexity to the ongoing battle between bulls and bears in the ETHUSD market.
Tug of War Continues: The article underscores the ongoing struggle between bullish and bearish forces, emphasizing the importance of key technical indicators and trendline dynamics in understanding ETHUSD's current market dynamics. Traders are urged to closely monitor these factors for potential trend shifts and strategic decision-making.
Forecast 2.7% vs Previous 2.9%
Forecast 5.25% vs Previous 5.25%
Forecast 213K vs Previous 214K

Trading foreign exchange on margin carries a high level of risk, and may not be suitable for all investors. Before deciding to trade foreign exchange you should carefully consider your investment objectives, level of experience, and risk appetite.
Nothing contained in this website should be construed as investment advice. Any reference to an investment's past or potential performance is not, and should not be construed as, a recommendation or as a guarantee of any specific outcome or profit.